Open Journal of Safety Science and Technology
Vol.2 No.3(2012), Article ID:22586,4 pages DOI:10.4236/ojsst.2012.23010
Causal Exploration of Bike Accidents in the Bay Area
Department of Civil Engineering, California State Polytechnic University, Pomona, USA
Email: giovannibryden@csupomona.edu
Received April 19, 2012; revised June 2, 2012; accepted June 18, 2012
Keywords: Bicycles; Safety; Multinomial Logit Regression
ABSTRACT
Although the proportion of bicycles to cars on the road remains low in the United States, it is on an upward trend. The high cost of gasoline and the re-introduction of bicycles as an attractive way to commute have contributed to an increase in ridership nationwide. However, as the number of bicycles on the road grows, so do the associated challenges. Without a clear understanding of how these two parties interact in a road network it is possible that we may stunt the growth of this sustainable and beneficial form of transportation and endanger riders through car-centered design practices and an unwillingness to accommodate for cyclists and their needs on the road. Five years of bicycle crash data from the city of San Francisco were analyzed. Using multinomial logistic regression, it is possible to relate different factors to the likelihood of an accident occurring, the corresponding severity, and the party at fault. Through this statistical analysis the study hopes to determine some of the statistically significant contributing factors to accidents involving cyclists in the city of San Francisco and make recommendations on how planners and design professionals can keep bicyclist safety considerations in mind. A few significant trends in the data were found, and recommendations are made to try and mitigate the risk of these factors on bicycle related accidents and their severity.
1. Introduction
In San Francisco, transportation is a prominent issue. Limited right of way and the dense nature of the city make relatively simple infrastructure projects such as a lane widening or addition almost impossible. In the past the city has dealt with such issues through projects such as the Bay Area Rapid Transit (BART) system. Although this service has seen success and boasts an average daily weekday ridership of almost 325,000 passengers, it was an extremely costly project (equivalent cost in 2004 of $15 billion dollars). Instead of merely adding more bus lines and laying down light rail in different parts of the city, it may be a good idea to explore ways in which the existing transportation facilities can operate more efficiently and sustainably. It is possible that through the enactment of policies and programs that promote bicycling as a part of intermodal transportation, the burden on the cities roads and public transit systems can be alleviated and the existing public transportation system can be made to run more efficiently.
Planners have answered the call by placing an emphasis on transit-oriented development. These developments encourage public transportation and take the pressure off of San Francisco’s already struggling corridors. Just placing an emphasis on public transportation, however, may not be enough to stave off the effects of population growth and the increases in trip generation that come with real estate and commercial development. With many high-density developments planned for San Francisco and forecasted population growth increasing the number of people in the city and the number of cars on the road, there is no single solution. The answer may lie in planning public transportation services and integrating timetables to ensure that the public system of transportation operates seamlessly across a metropolitan region perhaps in increasing the multimodal coordination of the public transportation system with pedestrians and cyclists. Before this can be made possible, a push has to be made to promote the use of cycling. There are factors that deter the use of one mode of transportation versus another. Some drivers in San Francisco may prefer the relative comfort of their automobiles for commuting to and from work or school. Others may opt for using the Muni—San Francisco’s public bus line—as a way to avoid the high cost of parking their cars in a garage or lot. Likewise, a would-be cyclist may be turned off of riding their bike to work if the general opinion amongst his or her friends is that the roads are not safe for biking on. In order to increase ridership rates and drive more people to adopt sustainable modes of transportation it is helpful to understand the deterrents and how these can be mitigated if not eliminated completely.
The objective of this paper is to understand some of the causes of bicycle accidents in the San Francisco. Through understanding the interactions between a cyclist and the environment around them and by isolating some of the significant causes of accidents on the road, it may be possible to make suggestions to make cycling a more attractive form of transportation. An increase in bicycle ridership will provide direct benefits by reducing the number of cars on the road as well as increasing the efficiency with which the existing public transportation system operates.
The following section describes prior research into the subject of safety modeling, transportation planning, and bicycle-specific research. This section is followed by a description of the methods used herein to analyze crash data and draw conclusions about bicycle-related crashes in San Francisco. Next is a description of the data collected, and the variables used in the statistical modeling followed by a summary of the results. A brief list of conclusion and recommendations finishes out the study.
2. Literature Review
Much effort has been dedicated to determining the factors that influence safety within a road network. On a macro perspective, road networks that are configured to a gridiron produced a higher crash severity than those that are comprised mostly of loops and warped parallels [1]. While intersections are recognized as the most hazardous locations on roads because of their high conflict possibilities [2], this occurrence is no surprise due to the many intersecting locations within a gridiron arrangement. In many metropolitan urban areas, the highly connective and accessible gridiron pattern has been continually used. However, the dense nature of these areas consequently creates additional challenges for the diverse modes of travel. Of these modes, bicyclists are at high risk since half of bicycle-motor vehicle collisions take place at intersections [3] and are statistically 12 times more likely to be killed than an automobile driver [4]. But despite the probable danger, an increase in the number of bicyclists yields a lower rate of crashes involving bicyclists [5].
Encouraging the use of bicycles as a travel mode can assist in shaping policy to endorse the implementation of facilities. However, understanding the importance of bicyclists’ behavior is crucial to the shift away from carcentric design priorities. Factors such as bicyclist demographics, household demographics, seasons, residential locations, bicycle amenities, bicyclist perception of facilities, and bicycle-use characteristics affect the frequency of bicycling use [6]. For many non-bicyclists, the initial decision to begin bicycling is challenged by several factors. Some of these factors relate to time sensitivity and gender differences. Also, the introduction of vehicular traffic contributes a negative perception of safety on bicycling [7]. For motorists, the combination of fastspeed and slow-speed travel modes within a shared road creates time and stress-related frustration that may act as a forerunner for aggressive driving [8]. To quantify this bicyclist perception, Landis et al. developed a method of measuring bicycle level of service at intersections, and shared-use paths adjacent to roadways. The study data consisted of participants’ perceptions of how well the roadways met their needs as they rode selected roadway segments [9-13]. Furthermore, the study revealed that factors such as car volumes, car speed, width of the outside car lane, and pavement condition all complicate bicyclists’ level of comfort [10-13].
The simultaneous presence of road users is not the sole deterring factor of bicycling. Travel distance [14] and trip type [15] similarly contribute to travel mode choice. Unlike motorists, who are likely to travel along major arterial roads, bicyclists spend majority of trips along local roads and bike facilities routes [16]. Along with shortest-distance, the selection of bike routes relies on the presence of possible route attributes. Such attributes include the minimal presence of turns, upslopes, adjacent commercial land use, stop signs, traffic signals, and adjacent employment density [17].
Additional insight on the influence factors present in gender differences can provide great value in increasing ridership, namely among women. Research conducted by Eomond et al. indicated that individual factors do play important roles in gender-specific cases [18]. Studies have also concluded that women are more likely than men to be occasional bicyclists, while men are more likely than women to be regular bicyclists [19]. In contrast, consistent with Xing et al. [20], gender-neutral factors such as “I like biking” are apparent. These studies yield a valuable understanding that may warrant the demand for gender sensitive consideration in the planning/design of bicycle facilities. Furthermore, it may promote the need to redefine experienced-based bicyclist user groups [16,21].
Another influence factor likely to affect bicycling behavior is the occurrence of present weather conditions. Cools et al. hypothesized the type of weather determined the likelihood of a change in travel behavior, and changes in travel behavior because of weather conditions depended on trip purpose [22]. Findings from this study confirmed conditions are highly dependent on trip purpose. Aultman-Hall et al. produced similar findings in regards to pedestrian volumes impacted by seasonal weather [23].
In combination with the increasing number of bicycle ridership and the notion of rising gas prices [24] in many major US cities has warranted a comprehensive understanding of bicycle traffic and the development of models which focus solely on bicycle safety. Ironically, the first-ever documented motor vehicle crash occurred in 1896 with a bicycle in New York City [25]. This perceived incompatibility led many researchers to develop models to quantify bicycle level of service. In 1995, Botma proposed methods for determining LOS within bicycle facilities [26] that would later be adopted by the Highway Capacity Manual [27]. Aside from bicycle LOS (which depended solely on bicycle speed), the bicycle safety index rating (BSIR) accounted for bicyclists’ operation and geometric roadway characteristics [28]. The compatibility of bicyclists’ stress levels was later incorporated into models formulated by Sorton and Walsh [29]. In 1998, Harkey et al. developed the bicycle compatibility index (BCI). The BCI converted bicyclist comfort levels into LOS designations for roadways and midblock locations [30]. Landis et al. later supplemented Botma’s BLOS for locations specific to intersections [12] and roadway segments [10]. Concurrently, Carter et al. developed a macrolevel bicycle intersection safety index (Bike ISI) while Petritsch et al. developed a BLOS for entire arterial roadway segments [13,31].
Because a large number of minor bicycle crashes (as many as 85%) don’t involve motor vehicles, many of these crashes are not reported publically into data [32]. This sizable majority of crashes justify the need of an objective bicycle route safety-rating model based on injury severity. Allen-Munley et al. developed a logistic model for rating routes under the premise that safe routes produce less-severe crashes than do unsafe routes. Their findings examined numerous operation and physical factors (traffic volume, lane width, population density, highway classification, and the presence of vertical grades, one-way streets, and truck routes) to predict the severity of a possible injury in a specified location meeting a 90% confidence level [26]. To complement past BLOS methodologies that include both physical and mental stressors within the road environment, the addition of crash severity requires the output of two different statistical models. Zolnik and Cromley developed a BLOS rating system utilizing a Poisson multilevel method. The results from the data analysis suggested routes within the road network that minimized distances and maximized safety. Moreover, the efficacies of specific routes were quantified based upon the cost benefit of time and safety to the bicyclist [33].
Aside from modeling features within a road networks on a macro level, much attention has been allocated in modeling bicycle safety and behavior within facilities. Understanding the importance of road user compatibility, numerous studies modeled the safety outcomes based upon the spatial configuration within the travelway corridor. Duthie et al. conducted studies to examine the behavioral impact of design elements within a facility to adjacent motorists. The investigation yielded data, which were used to build two multivariate regression models, and allowed site comparison. The study concluded notable observations that bike lanes created a safer and more predictable riding environment as opposed to wide outside lanes. Furthermore, the addition of a space buffer between parked cars and bike lanes ensuring a viable preventable method of bicycle-car door collisions [34]. Similarly, Furth et al. quantified the benefit of safety when parking lane widths were minimized to allow an increase in bicycle lane operation space [22]. The added bicycle lane width and the overall presence of a bike lane allowed motorist to be more aware of potential bicyclists on the segment of roadway. Houten and Seiderman observed this occurrence by measuring vehicle positioning during numerous pavement markings configurations and statistically modeled the data [35]. When combined with research conducted by Marshall et al., results indicate the utilization of on-street parking greatly reduced traveling motor vehicles speeds. These slower speeds provide pedestrians, bicyclists, and drivers with more time to react. This differential in reaction time produces a reduction of severity in the event of a crash [36]. Comparable to models directed to shared-use roadways, models quantifying the safety performance of bicycle side paths have also been examined. Petritsch et al. led research that provided important guides for bicycle facility-type selection, side path design and how these design factors affected crash rates. The four determining design factors that had significant influence on safety were side path width, side path-roadway separation, roadway speed, and number of lanes on adjacent roadway [37].
With the abundant consideration allotted towards bicycle safety modeling, a coordinated effort has been established in measuring the success of facilities drifting away from car-centric paradigm. Currently in the United States, the use of automobiles has been exceedingly embedded as a structural prerequisite for the organization of everyday life [38]. Despite the connection between automobile ownership and personal income exists, this relationship is gradually weakened over the last decade. And as a corollary, car ownership has grown increasingly rapid in areas with very poor public transit availability [39]. In comparison to other public transportation countries such as Germany, Buehler suggest their success to spawn from their 1) longer history and more-efficient use of government subsidies; 2) higher levels and better quality of public transportation supply; 3) better regional coordination and integration of public transportation services, timetables, financing, and tickets; 4) more multimodal coordination with walking and cycling; and 5) more favorable land use and automobile-restrictive policies that make car use less attractive and encourage public transportation ridership [40].
The immediate shift towards sustainable modes of travel may be too ambitious a goal to be achieved in a short amount of time. However, the more-efficient use of current modes may serve as a progressive stepping-stone to lesser car-dependent commutes. On the UC Berkeley campus in Berkeley, California, studies were conducted to assess the potential market of ridesharing where the majority of the study participants were unaware of ridesharing programs. The study found that one-fifth of commuters who drive alone would be interested in participating in the program if ride matches were found. Furthermore, introducing dynamic rideshare programs in conjunction to limited parking and costly fees would generate much interest attributed to the economic incentives [41].
Analogous to vast urban metropolises, the effect of a modal shift within small rural towns would yield significant fiscal and environmental benefits. Farrell et al. examined the benefits of using soft modes of transportation (walking, bicycling, carpooling) in a small Ireland town. Using the COPERT IV model to estimate CO2 reductions, their findings revealed that in towns where financial resources are scarce to construct transport alternatives, the low-cost transport options generated promising advantages [42]. In contrast, cities in North Carolina have invested $6.7 million dollars on bicycle facilities over the past decade. Despite the seemly large amount in spending, the decision to invest in constructing these facilities produced a noteworthy value. Meletiou et al. performed a case study to quantify the economic influence of these facilities. The impact of bicycling visitors generated a conservative $60 million annually along with 1407 jobs created or supported per year [43]. Although bicycling and transit are competing modes of travel, the implementation of bicycle facilities would serve as an effective complement to existing bus rapid transit (BRT) facilities. Since majority of bicyclists travel shorter distances, the option of BRT becomes highly attractive. However, it is unlikely that the implementation of BRT systems will induce a mass shift from bicycling to public transit [44]. Similarly, an investigation on bicycle-rail transit connectivity in Shanghai, China has been analyzed. Empirical results from the study suggest that improvements for rail transit riders lie primarily on the collection and distribution phases [45]. Transit-oriented developments (TOD) mitigate issues regarding collection and distribution of riders. To improve mode connectivity, the El Monte, California, bus station (EMBS) has been proposed. By planning the application of pedestrian bridges, automated people movers (APM), and connections to business parks and Metrolink rail stations, the EMBS will serve as a major transit hub. By emphasizing the importance of mode connectivity (especially with bicyclists and pedestrians), the proposed project could enhance transit use, local developments and real estate values [46].
Prior to the implementation of decisions concerning policy and investments, the need to understand expected and present ridership is key. In the past, demand estimates utilized data from population and land use. In recent years, many different approaches have been executed in estimating travel demand of whole networks [47-49] and the factors influencing usage [50]. Nordback and Janson also conducted systematic research to study the accuracy of permanent inductive loops for automated bicycle counts. When properly installed, calibrated, and maintained, these systems can provide fairly accurate tools for forecasting future demand and maintaining dayto-day capacity operation [51]. Because bicycle traffic theory staggers far behind to its highway traffic equivalent there is comparatively less attention in literature in terms of bicycle facility operation [27]. Present methods for bicycle facility designs are based upon difficultto-collect data and potentially uncertain assumptions about bicyclist behavior. To observe individual bicyclists and level of service under atypical events such as passing, Gould and Karner have modeled this behavior in simulations by using real bicycle data and the implementing a multilane, inhomogeneous cellular automaton simulation model [52].
The importance of bicycle facilities has been apparent in the bicycle capital of the United States: Davis, California. Over the past fifty years, transportation in Davis was oriented towards the bicycle since its first bicycle lanes in the 1960s [53]. As a model of success, Davis paved the way for other cities such as Boulder, Colorado, and Portland, Oregon to build cities for bicycle. Additionally, McCahill and Garrick provide methods for assessing the prioritization of constructing and maintaining bicycle facilities. Valuing connectivity and completeness of a network, the space syntax analysis model assessing the quality of a segment of roadway and the overall network. Results in the analysis can provide precious observations that would 1) recognize the distribution of bicycle volumes within the operational network; 2) offer tools in understanding effective bicycle network design to accommodate bicycle travel more effectively; 3) provide data in origin-destination studies to predict future demand [54].
Similar to cars and transit, the planning elements of bicycle facilities are imperative in the promotion of its growing usage. Models such as these allow the exclusive incorporation of bicycles into the conventional travel demand model where they would attract very little attention otherwise. These distinctive ventures will help proclaim the importance of bicycles and incorporate their usage to transform the mainstream car-centric transportation planning culture.
3. Method Description
The model employed is a multinomial logit (MNL) regression model for accident severity. In such a model, severity of the accident is a dependent variable where yi can equal 0, 1, and 2 for property damage, injury, and fatality respectively. Distances from intersection (DisFm), the party at fault (P1), the lighting conditions (daylight, dawn, dark with streetlight, and others) and condition of the road surfaces (dry, slippery, or wet) are covariates. The model can be written as follows:
 (1)
(1)
In the above severity equation,  is an estimable parameter and x pertains to explanatory variables.
  is the error term and is assumed to be generalized extreme value distributed (GEV).
  is also known as the severity function. This severity function is equal to the injury-severity category proportion.
 (2)
(2)
 refers to a reference level for the Outcome variable, corresponding to a property damage only (PDO) accident. The outcome level i refers to any other severity level.
The probability of an outcome relative to the reference level can then be calculated using the following equation:
 (3)
(3)
4. Data Description
Five years of data was collected in the Bay Area from the years 2005 through 2009. In total, 14,113 accidents were logged by bay area law enforcement agencies and made available by The Bay Citizen, a non-profit, non-partisan, member-supported news organization. Data included accident numbers from Alameda, Contra Costa, Marin, Napa, San Francisco, San Mateo, Santa Clara, Solano, and Sonoma counties. For the sake of this study, only the crashes logged for the city of San Francisco were used (2230 accidents) to reduce the effects of over dispersion. Each crash included information about the intersection, the distance from said intersection, the two parties involved, the severity of the ensuing accident, the case number, lighting conditions, and road surface conditions among others. Of these variables, a portion was selected for the study and is described in the table below. DisFm 1) is the distance from the intersection associated with the accident. P1 2) is the first party associated with the accident or the party at fault. P1 has values ranging from automobile, pedestrian, parked car, no fault, or other. LightingCondition 3) describes the current lighting condition at the time of the accident. This variable has values ranging from daylight to nighttime without a functioning streetlight. RoadSurface 4) describes the current condition of the pavement. These variables are listed in Table 1.
5. Results
Although covered in greater detail in a previous section, the model is summarized below and in Tables 2 and 3:
1) Data cataloguing bicycle-related accidents in the Bay area was collected and sorted through. Ultimately, only data for the city of San Francisco was analyzed.
2) From 2005 through 2009, 2230 bicycle-related accidents were reported by law enforcement agencies. In addition to the time, location, and parties involved, the distance from an intersection, road surface information, accident severity, and lighting conditions were also recorded.
3) A multinomial logit model was chosen to relate the severity of the accident to other covariates.
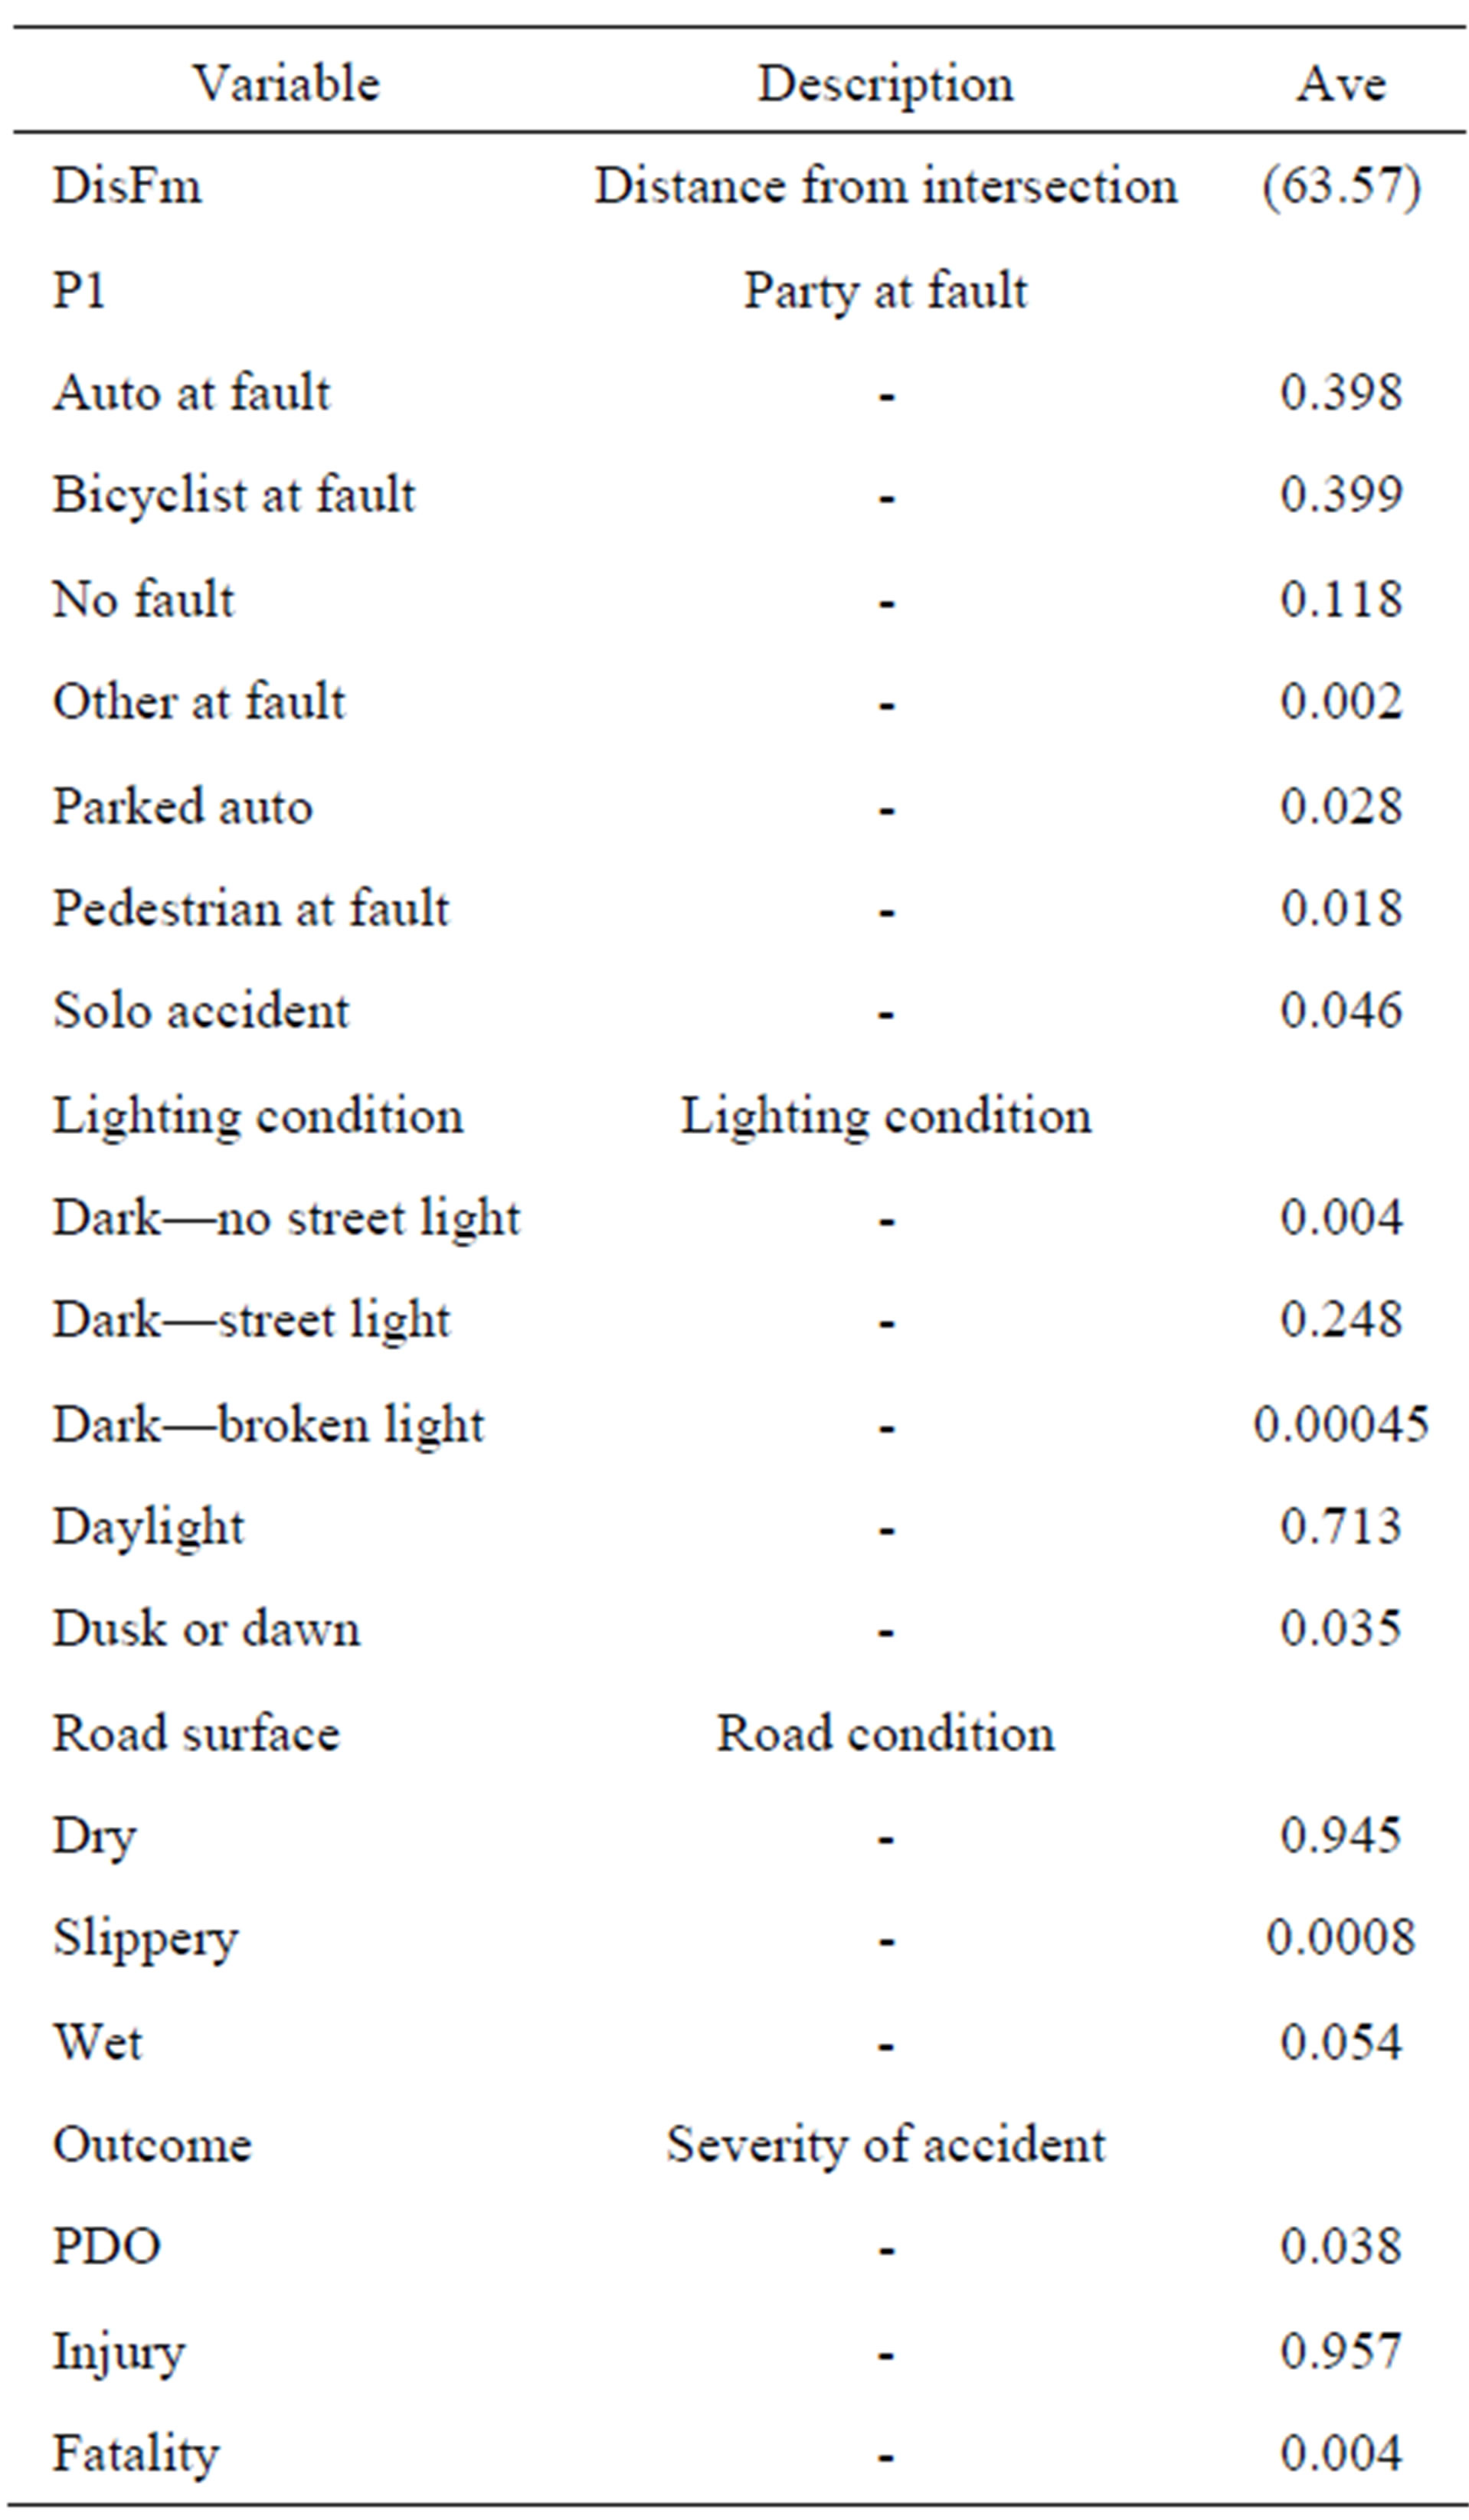
Table 1. Explanatory variables used in model.
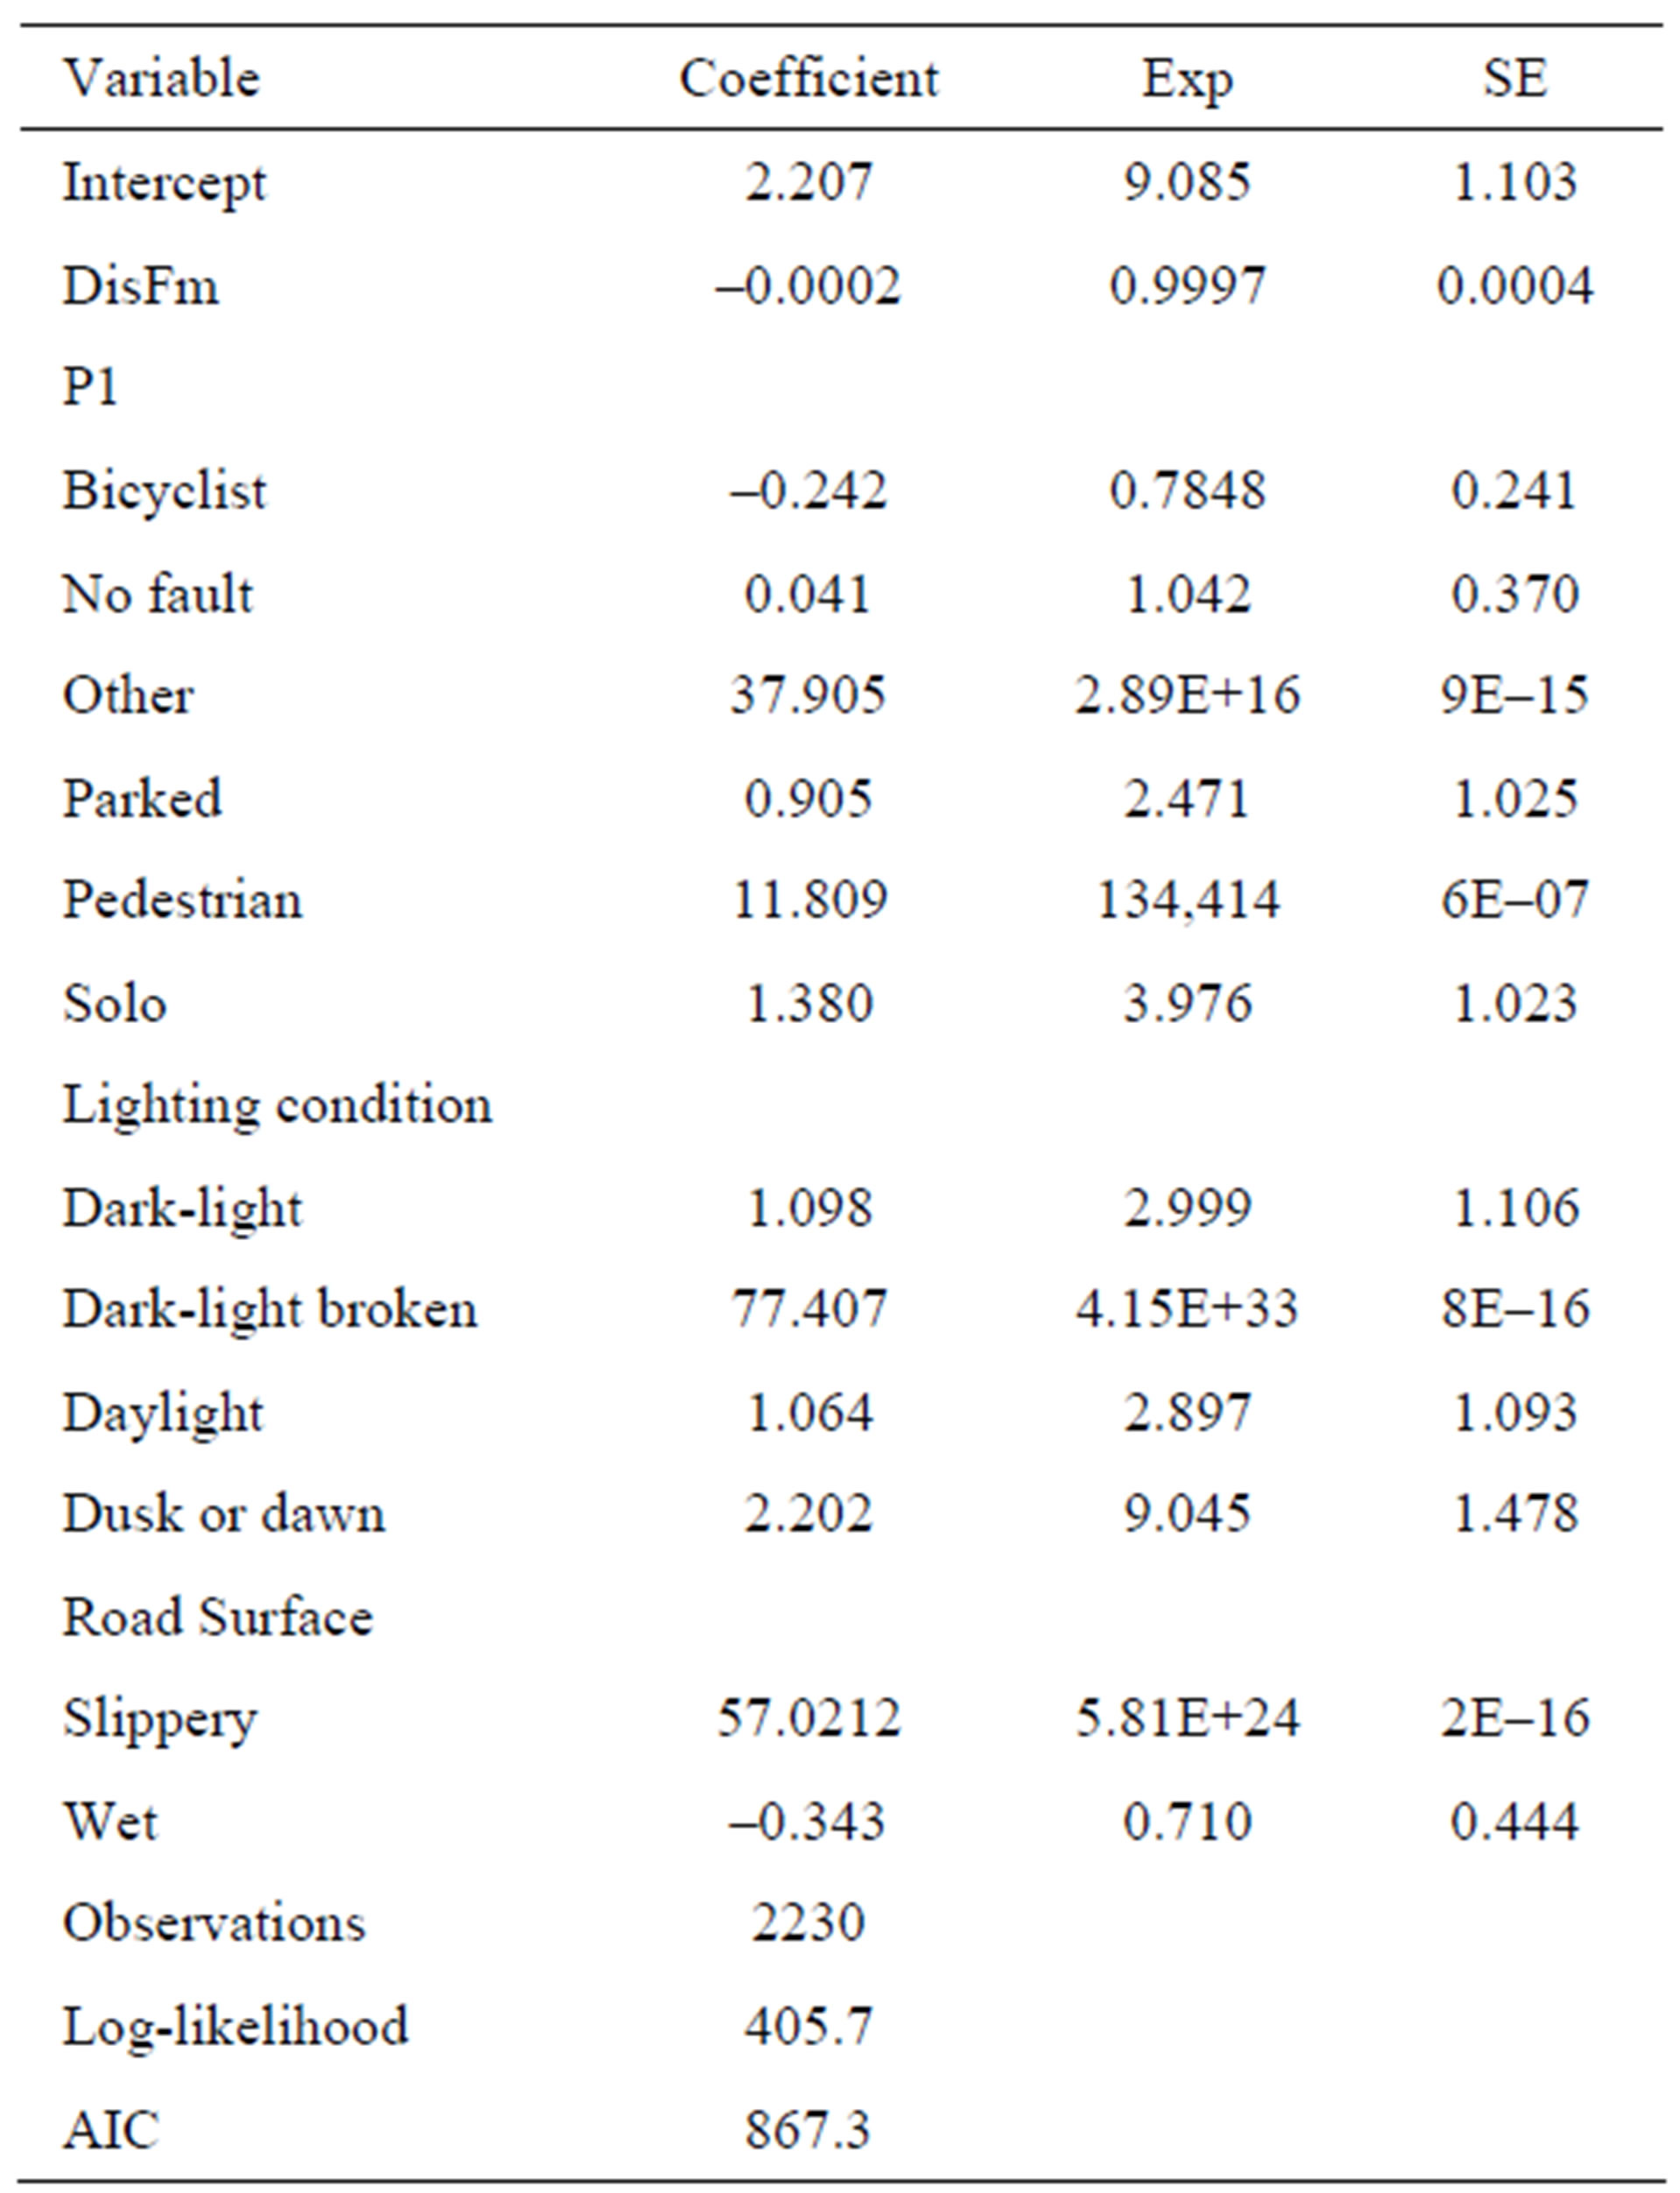
Table 2. Coefficients for the injury model (Injuries).
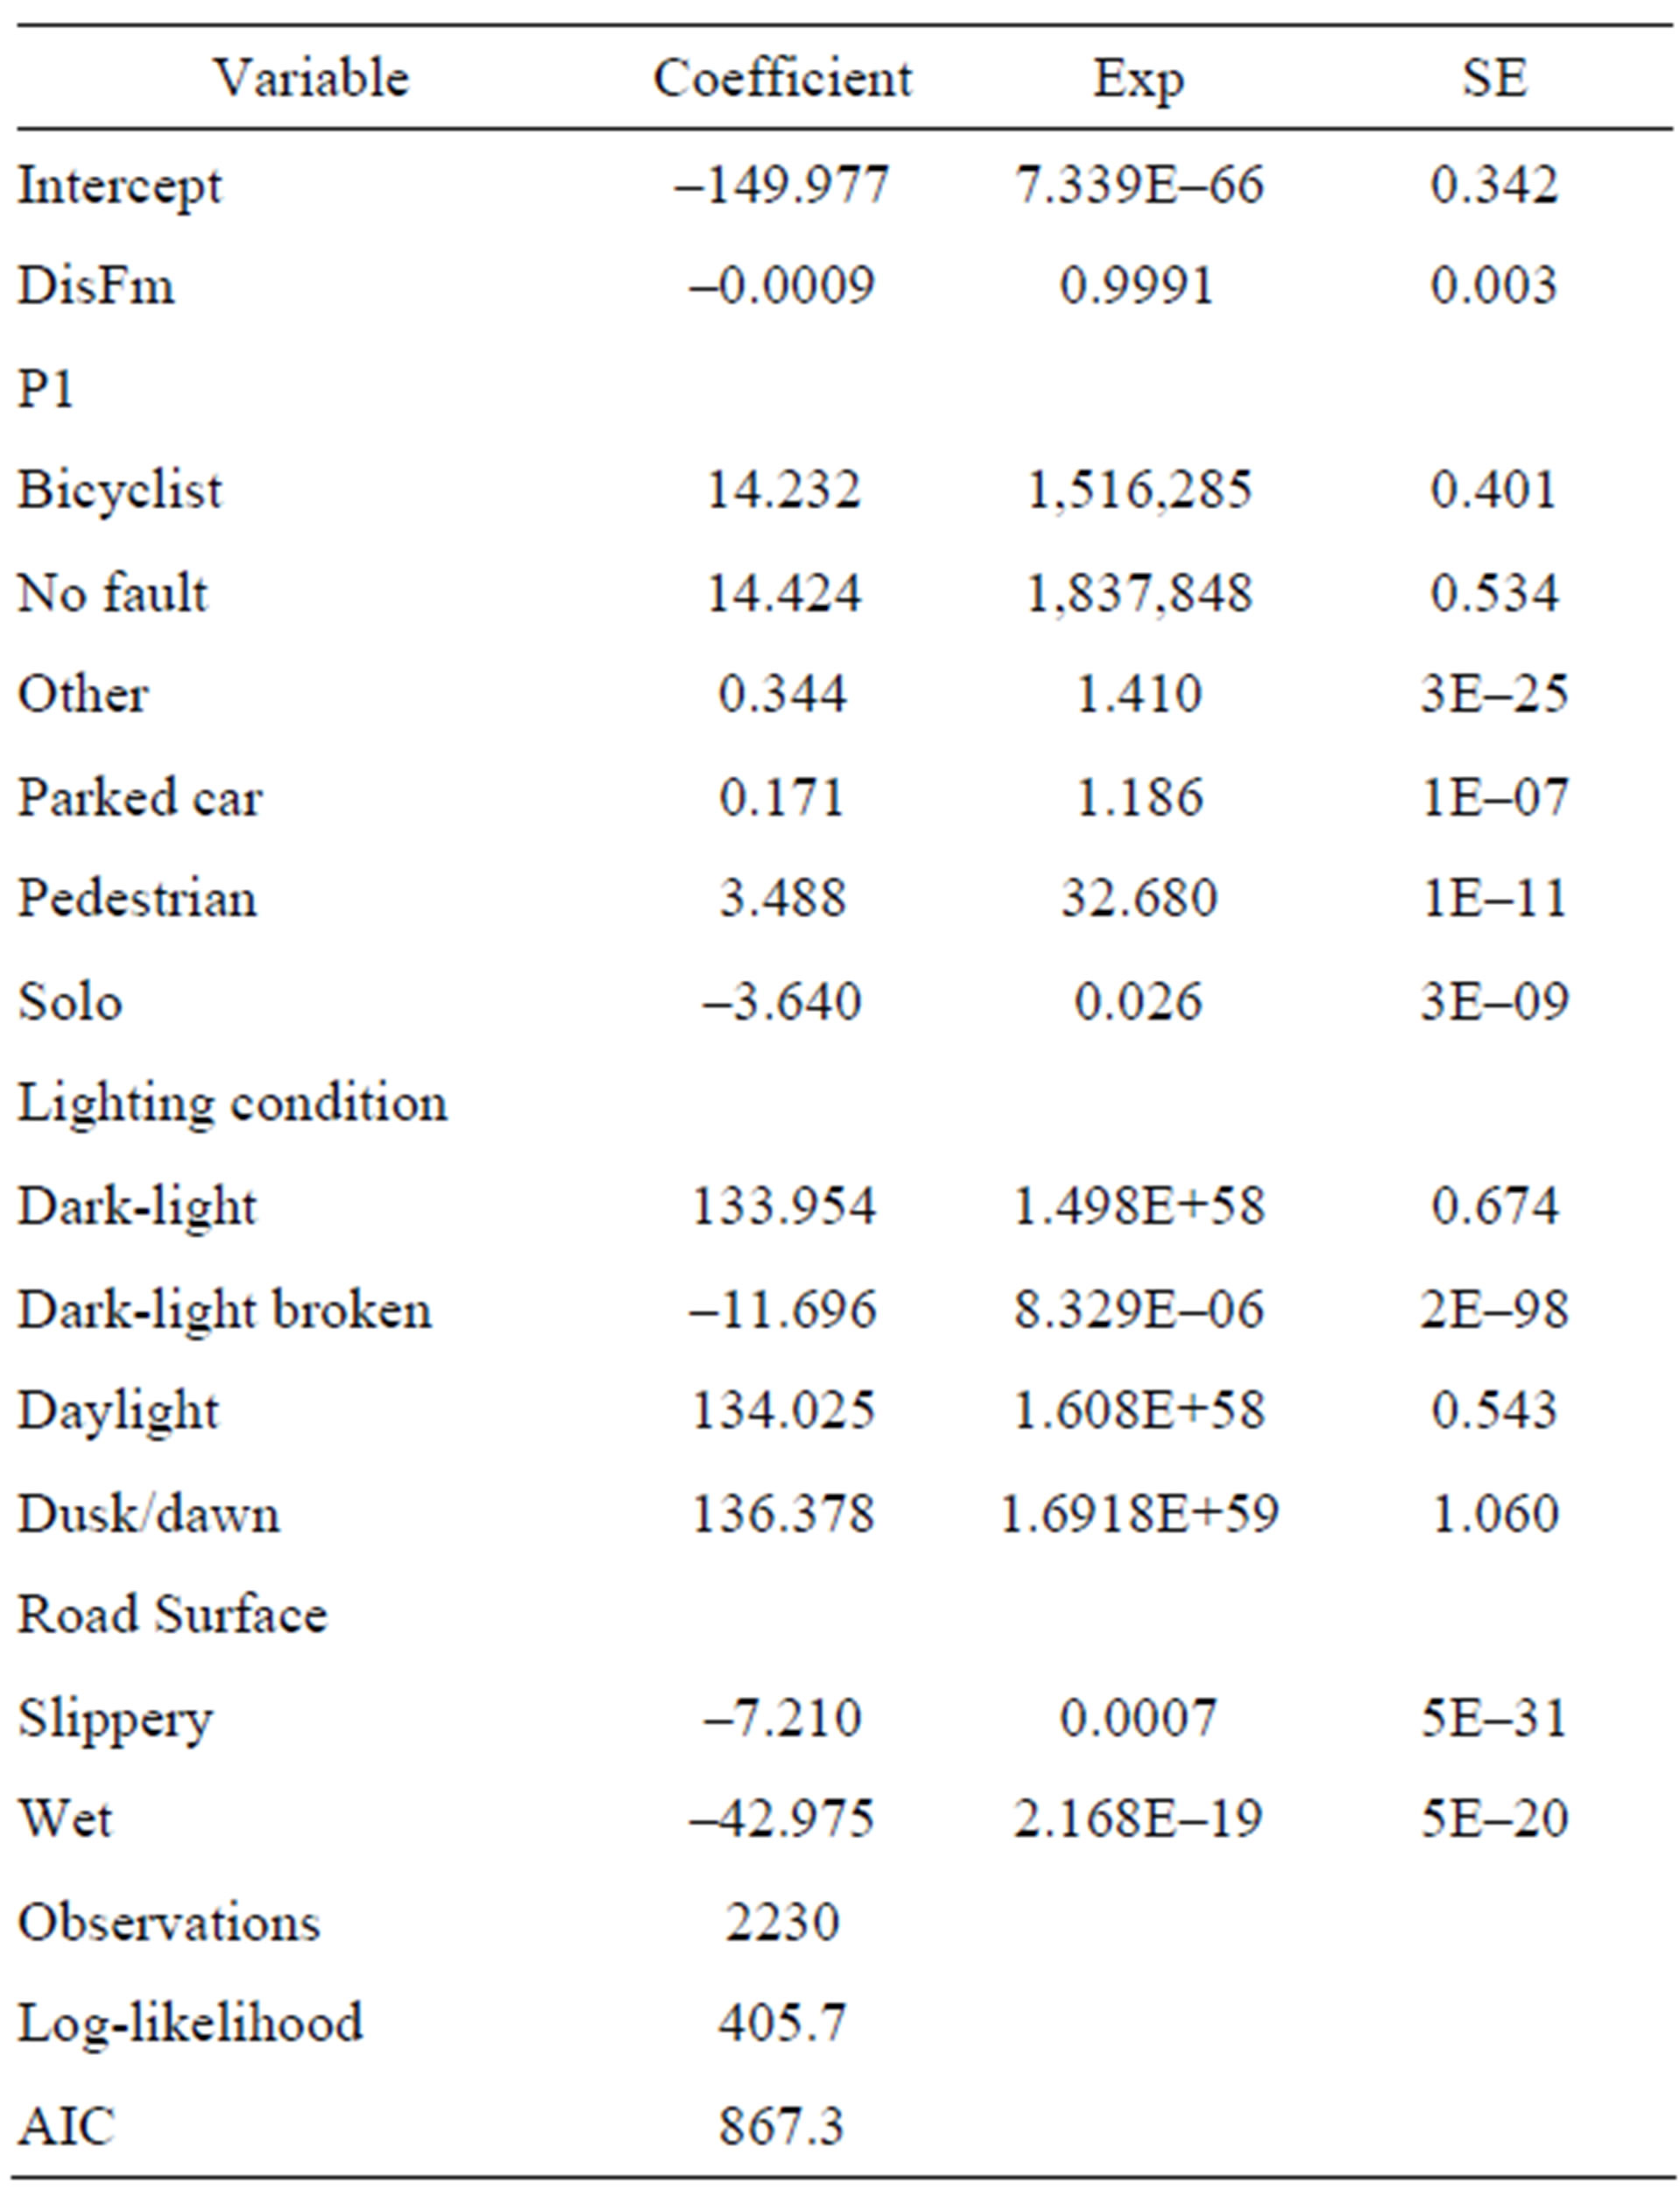
Table 3. Coefficients for the fatality model (Fatalities).
6. Conclusions
Through analyzing crash data from the city of San Francisco, it was possible to make some conclusions regarding bicycle-related accidents in San Francisco and the factors that contribute to these accidents and their ensuing level of severity. Findings and observations are listed below:
6.1. Distance from an Intersection
In general, the distance from an intersection was not found to be a significant factor in predicting the severity of a bicycle-related accident. This is an interesting finding because previous research studies have found that bicycle-related accidents are most likely to happen at intersections. It was expected that accidents that occurred closest to an intersection (DisFm = 0 feet) would be more likely to end in injury or fatality.
6.2. Party at Fault
Upon looking at the model that predicted the occurrence of an injury, it was found that the relative risk for injury in a bicycle-related accident was 27.5% higher when the accident occurred due to the fault of the driver. That is to say, accidents that take place because of some driver error are more likely to end up in injury for either or both of the parties involved.
The relative risk for injury in a bicycle-related accident where the pedestrian was at fault was much higher than when the bicyclist was at fault. This can be explained by looking at a simple scenario where a pedestrian unknowingly walks into a street and into the way of a cyclist. With no way to avoid the accident, the cyclist has no choice but to hit the pedestrian going upwards of 15 to 20 miles per hour. It is therefore expected that an injury in one or more of the parties involved is very likely to happen, however minor.
A cyclist involved in a solo accident, such as one where a pothole or crack in the road causes the accident, is roughly five times more likely to suffer an injury relative to an accident where the cyclist is clearly at fault. This suggests that upkeep of the city’s infrastructure is important in reducing accidents as well as the severity level of the accidents that do occur.
A cyclist runs a higher risk of death when he or she causes an accident compared to an accident that is an automobile driver’s fault. Likewise, an accident caused by a pedestrian is more likely to end in a fatality for one or more of the parties involved, though this relative risk is lower. On the other hand, solo accidents, which are likely to end in injury, are very unlikely to end in a fatality for the cyclist involved.
6.3. Lighting Conditions
When the accident took place in an area where it was dark outside but the streetlight was not functioning, the relative probability of the accident ending in an injury was much higher. This is another area that is easy to improve on. By maintaining streetlights the city of San Francisco can reduce the risk of accidents resulting in injuries.
The risk of an accident resulting in an injury at night with the street light functioning was almost the same as the risk of an accident resulting in an injury during the daytime. This result suggests that perhaps commuting at night is not as dangerous as commuting during the daytime. It is possible that the dangers posed by the higher volume of cars on the street during the day contributes equally to the risk of an injury as does the reduced visibility and its associated risks at night.
6.4. Road Surface
A wet road surface did not have a significant result on the risk of an accident resulting in an injury. This may have to do with the fact that cyclists are not often found riding their bikes outside during inclement weather. However, a slippery road surface contributed to a higher relative risk of injury in a bike-related accident, compared to a dry road surface.
The risk of fatality was not significantly affected by the condition of the road surface.
7. Recommendations
While one can look at all the numbers and make inferences on what causes an accident and what contributes to its severity, the most important thing to consider is that a good amount of these accidents can be prevented. Better bicycle education and training can keep a cyclist from making mistakes that may put him or her in conflict with a pedestrian, parked car, or moving vehicle. Likewise, if an automobile driver has respect for the cyclist they are sharing the road with the occurrence of these accidents resulting in an injury can be reduced. Additionally, continued attention to the inclusion of bike lanes that separate cyclists from drivers and pedestrians will have a positive effect on the frequency and severity of bicyclerelated collisions. Finally, the city of San Francisco must place an emphasis on the condition of their street-lights and the vacuuming and sweeping of their streets to avoid a situation that contributes to the risk of an injury in a bicycle-related crash.
Since this study made use of data provided by The Bay Citizen, it was limited to the factors that were catalogued therein. Therefore, while the accident data contained lots of useful information such as the police case number, the exact intersection where the accident took place, and the other parties involved, these are not variables that meshed well with an accident severity model. It is reasonable to assume that with a more complete source of information such as one that includes information like the presence of a bike lane, and the log of the average annual daily traffic, future studies can shed more light into the interaction between cyclists and automobile drivers and make meaningful conclusions about bicycle-related accidents not just in San Francisco but in any other municipality.
In addition, it would be unwise to ignore the effects of underreporting on this collected data. Research has been devoted to the effect of underreporting on such things as hot spot identification. It is reasonable to assume that the level of underreporting in bicycle-related accidents would be as high, if not higher, than the levels assumed in a comparable automobile accident. The mere fact that accident insurance is mandatory for California drivers and no such mandate exists for cyclists creates a huge incentive for both driver and cyclist to keep low-severity accidents off the books. Because the statistical model is only as good as the data that goes into it, it will be important to address these effects—as well as other forms of data corruption—in future bicycle safety studies.
REFERENCES
- S. M. Rifaat, R. Tay and A. De Barros, “Effect of Street Pattern on Road Safety,” Transportation Research Record 2147, TRB, National Research Council, Washington DC, 2010, pp. 58-65.
- U. Barua, A. K. Azad and R. Tay, “Fatality Risk of Intersection Crashes on Rural Undivided Highways in Alberta, Canada,” Transportation Research Record 2148, TRB, National Research Council, Washington DC, 2010, pp. 107-115.
- W. W. Hunter, W. E. Pein and J. C. Stutts, “BicycleMotor Vehicle Crash Types: The Early 1990s,” Transportation Research Record 1502, TRB, National Research Council, Washington DC, 1995, pp. 65-74.
- R. Brustman, “An Analysis of Available Bicycle and Pedestrian Accident Data: A Report to the New York Bicycling Coalition,” Albany, 1999.
- P. L. Jacobsen, “Safety in Numbers: More Walkers and Bicyclists, Safer Walking and Bicycling,” Injury Prevention, Vol. 9, No. 3, 2003, pp. 205-209. doi:10.1136/ip.9.3.205
- I. N. Sener, N. Eluru and C. R. Bhat, “Who Are Bicyclists? Why and How Much Are They Bicycling?” Transportation Research Record 2134, TRB, National Research Council, Washington DC, 2009, pp. 63-72.
- G. Akar and K. J. Clifton, “Influence of Individual Perceptions and Bicycle Infrastructure on Decision to Bike,” Transportation Research Record 2140, TRB, National Research Council, Washington DC, 2009, pp. 165-172.
- I. Audirac, “Sharing Fast-Speed and Slow-Speed Roads with Bicyclists and Pedestrians,” Transportation Research Record 2067, TRB, National Research Council, Washington DC, 2008, pp. 65-74.
- B. W. Landis, V. R. Vattikuti, R. M. Ottenberg, D. S. McLeod and M. Guttenplan, “Modeling the Roadside Walking Environment: Pedestrian Level of Service,” Transportation Research Record 1773, TRB, National Research Council, Washington DC, 2001, pp. 82-88.
- B. W. Landis, V. R. Vattikuti and M. T. Brannick, “RealTime Human Perceptions: Toward a Bicyclist Level of Service,” Transportation Research Record 1578, TRB, National Research Council, Washington DC, 1997, pp. 119-126.
- B. W. Landis, V. R. Vattikuti, R. M. Ottenberg, T. A. Petritsch, M. Guttenplan and L. B. Crider, “Intersection Level of Service for the Bicycle through Movement,” Transportation Research Record 1828, TRB, National Research Council, Washington DC, 2003, pp. 101-106.
- T. A. Petritsch, S. Ozkul, P. McLeod, B. Landis and D. McLeod, “Quantifying Bicyclists’ Perceptions of SharedUse Paths Adjacent to the Roadway,” Transportation Research Record 2198, TRB, National Research Council, Washington DC, 2010, pp. 124-132.
- D. L. Carter, W. W. Hunter, C. V. Zegeer, J. R. Stewart and H. Huang, “Bicyclist Intersection Safety Index,” Transportation Research Record 2031, TRB, National Research Council, Washington DC, 2007, pp. 18-24.
- T. Kuhnimhof, B. Chlond and P. Huang, “Multimodal Travel Choices of Bicyclists,” Transportation Research Record 2190, TRB, National Research Council, Washington DC, 2010, pp. 19-27.
- I. Meloni, A. Portoghese, M. Bez and E. Spissu, “Effects of Physical Activity on Propensity for Sustainable Trips,” Transportation Research Record 2134, TRB, National Research Council, Washington DC, 2009, pp. 43-50.
- P. G. Furth, D. M. Dulaski, M. Buessing and P. Tavakolian, “Parking Lane Width and Bicycle Operating Space,” Transportation Research Record 2190, TRB, National Research Council, Washington DC, 2010, pp. 45-50.
- J. Broach, J. Gliebe and J. Dill, “Calibrated Labeling Method for Generating Bicyclist Route Choice Sets Incorporating Unbiased Attribute Variation,” Transportation Research Record 2197, TRB, National Research Council, Washington DC, 2010, pp. 89-97.
- C. R. Emond, W. Tang and S. L. Handy, “Explaining Gender Difference in Bicycling Behavior,” Transportation Research Record 2125, TRB, National Research Council, Washington DC, 2009, pp. 16-25.
- H. Twaddle, F. Hall and B. Bracic, “Latent Bicycle Commuting Demand and Effects of Gender on Commuter Cycling and Accident Rates,” Transportation Research Record 2190, TRB, National Research Council, Washington DC, 2010, pp. 28-36.
- Y. Xing, S. L. Handy and T. J. Buehler, “Factors Associated with Bicycle Ownership and Use: A Study of 6 Small US Cities,” 87th Annual Meeting of the Transportation Research Board, Washington DC, 2008.
- D. L. Harkey, D. W. Reinfurt and M. Knuiman, “Development of the Bicycle Compatibility Index: A Level of Service Concept,” Federal Highway Administration, US Department of Transportation, 1998.
- M. Cools, E. Moons, L. Creemers and G. Wets, “Changes in Travel Behavior in Response to Weather Conditions,” Transportation Research Record 2157, TRB, National Research Council, Washington DC, 2010, pp. 22-28.
- L. Aultman-Hall, D. Lane and R. R. Lambert, “Assessing Impact of Weather and Season on Pedestrian Traffic Volumes,” Transportation Research Record 2140, TRB, National Research Council, Washington DC, 2009, pp. 35- 43.
- L. K. Richards, “Gas Prices Up Bicycle Sales,” Times Record News: Wichita Falls Online, 2008. www.timesrecordnews.com/news/2008/apr/23/gas-pricesbicycle-sales/
- C. Allen-Munley, J. Daniel and S. Dhar, “Logistic Model for Rating Urban Bicycle Route Safety,” Transportation Research Record 1878, TRB, National Research Council, Washington DC, 2004, pp. 107-115.
- H. Botma, “Method to Determine Level of Service for Bicycle Paths and Pedestrian-Bicycle Paths,” Transportation Research Record 1502, TRB, National Research Council, Washington DC, 1995, pp. 38-44.
- “Highway Capacity Manual,” TRB, National Research Council, Washington DC, 2000.
- J. Davis, “Bicycle Safety Evaluation,” Auburn University, City of Chattanooga, and Chattanooga-Hamilton County Regional Planning Commission, Chattanooga, June 1987.
- A. Sorton and T. Walsh, “Bicycle Stress Level as a Tool to Evaluate Urban and Suburban Bicycle Compatibility,” Transportation Research Record 1438, TRB, National Research Council, Washington DC, 1994, pp. 17-24.
- D. L. Harkey, D. W. Reinfurt, M. Knuiman, J. R. Stewart and A. Sorton, “Development of the Bicycle Compatibility Index: A Level of Service Concept,” Report FHWARD-98-072, US Department of Transportation, McLean, 1998.
- T. A. Petritsch, B. W. Landis, H. F. Huang, P. S. McLeod, D. Lamb, W. Farah and M. Guttenplan, “Bicycle Level of Service for Arterials,” Transportation Research Record 2031, TRB, National Research Council, Washington DC, 2007, pp. 34-42.
- J. C. Stutts, J. E. Williamson, T. Whitely and F. C. Sheldon, “Bicycle Accidents and Injuries: A Pilot Study Comparing Hospitaland Police-Reported Data,” Accident Analysis and Prevention, Vol. 22, No. 1, 1990, pp. 67-78. doi:10.1016/0001-4575(90)90008-9
- E. J. Zolnik and E. K. Cromley, “Poisson Multilevel Methodology of Bicycle Levels of Service for Road Networks,” Transportation Research Record 2031, TRB, National Research Council, Washington DC, 2007, pp. 1- 8.
- J. Duthie, J. F. Brady, A. F. Mills and R. B. Machemehl, “Effects of On-Street Bicycle Facility Configuration on Bicyclist and Motorist Behavior,” Transportation Research Record 2190, TRB, National Research Council, Washington DC, 2010, pp. 37-44.
- R. V. Houten and C. Seiderman, “How Pavement Markings Influence Bicycle and Motor Vehicle Positioning,” Transportation Research Record 1939, TRB, National Research Council, Washington DC, 2005, pp. 3-14.
- W. E. Marshall, N. W. Garrick and G. Hansen, “Reassessing On-Street Parking,” Transportation Research Record 2046, TRB, National Research Council, Washington DC, 2008, pp. 42-52.
- T. A. Petritsch, B. W. Landis, H. F. Huang and S. Challa, “Sidepath Safety Model: Bicycle Sidepath Design Factors Affecting Crash Rates,” Transportation Research Record 1982, TRB, National Research Council, Washington DC, 2006, pp. 194-201.
- K. Kuhm, “Moderne und Asphalt: Die Automobilisierung als Prozess Technologischer Integration und Sozialer Vernetzung,” Centaurus, Pfaffenweiler, 1997.
- K. Lucas, “Actual and Perceived Car Dependence: Likely Implications of Enforced Reductions in Car Use for Livelihoods, Lifestyles, and Well-Being,” Transportation Research Record 2118, TRB, National Research Council, Washington DC, 2009, pp. 8-15
- R. Buehler, “Promoting Public Transportation: Comparison of Passengers and Policies in Germany and the United States,” Transportation Research Record 2110, TRB, National Research Council, Washington DC, 2009, pp. 60- 68.
- E. Deakin, K. T. Frick and K. M. Shively, “Markets for Dynamic Ridesharing: Case of Berkeley, California,” Transportation Research Record 2187, TRB, National Research Council, Washington DC, 2010, pp. 131-137.
- S. Farrell, D. McNamara and B. Caulfield, “Estimating the Potential Success of Sustainable Transport Measures for a Small Town,” Transportation Research Record 2163, TRB, National Research Council, Washington DC, 2010, pp. 97-102.
- M. P. Meletiou, J. J. Lawrie, T. J. Cook, S. W. O’Brien and J. Guenther, “Economic Impact of Investments in Bicycle Facilities: Case Study of North Carolina’s Northern Outer Banks,” Transportation Research Record 1939, TRB, National Research Council, Washington DC, 2005, pp. 15-21.
- K. J. Krizek and E. W. Stonebraker, “Bicycling and Transit: A Marriage Unrealized,” In Transportation Research Record 2144, TRB, National Research Council, Washington DC, 2010, pp. 161-167.
- H. Pan, Q. Shen and S. Xue, “Intermodal Transfer between Bicycles and Rail Transit in Shanghai, China,” Transportation Research Record 2144, TRB, National Research Council, Washington DC, 2010, pp. 181-188.
- W. D. Cottrell, “Transforming a Bus Station into a Transit-Oriented Development: Improving Pedestrian, Bicycling, and Transit Connections,” Transportation Research Record 2006, TRB, National Research Council, Washington DC, 2007, pp. 114-121.
- A. J. Richardson, “Estimating Bicycle Usage on a National Cycle Network,” Transportation Research Record 1982, TRB, National Research Council, Washington DC, 2006, pp. 166-173.
- G. Barnes and K. Krizek, “Estimating Bicycling Demand,” Transportation Research Record 1939, TRB, National Research Council, Washington DC, 2005, pp. 45-51.
- M. An and M. Chen, “Estimating Nonmotorized Travel Demand,” Transportation Research Record 2002, TRB, National Research Council, Washington DC, 2007, pp. 18-25.
- J. Dill and K. Voros, “Factors Affecting Bicycling Demand: Initial Survey Findings from the Portland, Oregon, Region,” Transportation Research Record 2031, TRB, National Research Council, Washington DC, 2007, pp. 9- 17.
- K. Nordback and B. N. Janson, “Automated Bicycle Counts: Lessons from Boulder, Colorado,” Transportation Research Record 2190, TRB, National Research Council, Washington DC, 2010, pp. 11-18.
- G. Gould and A. Karner, “Modeling Bicycle Facility Operation: Cellular Automaton Approach,” Transportation Research Record 2140, TRB, National Research Council, Washington DC, 2009, pp. 157-164.
- T. Buehler and S. Handy, “Fifty Years of Bicycle Policy in Davis, California,” Transportation Research Record 2074, TRB, National Research Council, Washington DC, 2008, pp. 52-57.
- C. McCahill and N. W. Garrick, “The Applicability of Space Syntax to Bicycle Facility Planning,” Transportation Research Record 2074, TRB, National Research Council, Washington DC, 2008, pp. 46-51.