Open Journal of Marine Science
Vol.4 No.1(2014), Article ID:41787,10 pages DOI:10.4236/ojms.2014.41002
Genetic Variability and Population Structure of Ark Shell in Japan
1United Graduate School of Agricultural Sciences, Tottori University, Tottori, Japan
2Coastal Lagoon Research Center, Shimane University, Matsue, Japan
Email: aranishi@soc.shimane-u.ac.jp
Received October 21, 2013; revised November 26, 2013; accepted December 18, 2013
ABSTRACT
Ark shell Scapharca kagoshimensis is one of the commercially important bivalve resources in East Asia. In Japan, the mass production method for its natural seedlings was developed in the 1880s, and they had been transplanted to an array of the major fishing areas. It has been therefore concerned with its genetic disturbance among not only current but also former fishing areas in Japan. This study was undertaken to ascertain its genetic diversity and population structure in East Asia by means of nucleotide sequence analysis of a 555-bp portion of the mitochondrial DNA COI gene. Of 225 individuals collected from 8 populations and 1 population in Japan and Korea, respectively, a total of 59 haplotypes, including 14 common haplotypes, were found, and Japan and Korea shared 3 common haplotypes. In Japan, the haplotype diversity and nucleotide diversity ranged from 0.65 to 0.93 and from 0.22% to 0.59%, respectively, reflecting relatively high levels of genetic diversity. The values in Korea were determined to be 0.45% and 0.19%, respectively, indicating significantly lower genetic diversity compared with that in Japan. Mismatch distribution analysis and neutrality tests showed a recent history of multiple types of reproduction and signals of demographic change in each population. These results suggest that S. kagoshimensis has experienced rapid population growth or reduction in population size such as a bottleneck in a short period.
Keywords:Ark Shell; Genetic Structure; Genetic Diversity; Mitochondrial DNA; COI Gene; Scapharca kagoshimensis
1. Introduction
Ark shell, Scapharca kagoshimensis, has a wide distribution in East Asia, where it inhabits the muddy sediments of shallow coastal waters [1]. In Japan, it has so far been one of the valuable fishery resources distributed throughout Tokyo Bay in eastern Japan to Ariake Sea in southwestern Japan. Its recent major fishing areas are Mizushima Sea in western Japan and Ariake Sea. In particular, Ariake Sea has recorded the highest production accounting for more than 90% of its annual domestic catch since the 1980s [2]. In the 1880s, the collection method for its natural seedlings was developed in Nakaumi Lagoon in western Japan [3]. For the purpose of an increase in food production after the World War II, its natural seedlings suffered to frequent transplantation from Nakaumi Lagoon to other fishing areas since the 1940s [3]. It has been therefore concerned with its genetic disturbance among not only current but also former fishing areas in Japan. However, its genetic diversity and population structure in Japan are still not well understood.
It is well-known that transplantation sometimes occurs because of a serious effect on the genetic diversity and population structure of marine species [4]. Molecular tools have greatly enhanced our understanding of the genetic diversity and population structure of marine species, as well as helped in elucidating their evolutionary history [5,6]. Mitochondrial DNA (mtDNA) has been extensively used for both population genetic and systematic genetic studies on various taxonomic levels [7]. Among various marine bivalves, the mtDNA cytochrome c oxidase subunit I (COI) gene has been verified as a sensitive molecular marker for population genetic studies on Corbicula japonica [8,9] and Ruditapes philippinarum [10] and systematic genetic studies on Scapharca species in Japan [11], Korea [12] and China [13]. In order to elucidate an effect of the past frequent transplantation of S. kagoshimensis in Japan, this study was undertaken to ascertain its genetic diversity and population structure in Japan and Korea through inference from the mtDNA COI gene.
2. Materials and Methods
2.1. Sample Collection
A total of 225 specimens were collected from 8 sites and 1 site in Japan and Korea, respectively, between March 2008 and June 2011 (Figure 1, Table 1). Adductor muscle or foot tissue was obtained from each specimen and immediately stored at −20˚C until DNA extraction.
2.2. DNA Extraction
High-quality total genomic DNA was prepared from small scraps of frozen adductor muscle or foot according to the modified urea-SDS-proteinase K method [14-16]. Samples were incubated in the extraction buffer (10 mM Tris-HCl, pH 7.5, 20 mM EDTA, pH 8.0, 1 % SDS, and 4 M urea) containing 25 µg proteinase K at 55˚C, and 5 M NaCl was then added and mixed. DNA was isolated with phenol-chloroform-isoamyl alcohol and subsequently with chloroform-isoamyl alcohol followed by precipitation with ethanol. DNA pellets were washed with ethanol, dried, and resuspended in 10T0.1E (10 mM Tris-HCl, pH 7.5, 0.1 mM EDTA, pH 8.0).
2.3. PCR Amplification
PCR amplification of the mtDNA COI gene was performed in GoTaq Green PCR Master Mix (Promega) containing 2 mM MgCl2, 0.5 µM of each primer, and template DNA in a Techgene thermal cycler (Techne). PCR primers for Scapharca species were 5’-GGTGT GTGTT TAAGA TTTCA CA-3’ and 5’-TAAAC TTCAG GGTGA CCAAA AAATC A-3’ [11]. PCR protocol consisted of an initial denaturation at 95˚C for 2 min, followed by 40 cycles of 10 sec at 95˚C, 20 sec at 50˚C, and 40 sec at 72˚C, and a final extension at 72˚C for 5 min. The PCR products were analyzed using a DNA- 1000 Reagent Kit (Shimadzu) containing a SYBR Gold Nucleic Acid Gel Stain (Invitrogen) in a MCE-202 MultiNA microchip electrophoresis system (Shimadzu).
2.4. Sequence Analysis
Nucleotide sequencing of double strands of PCR product was accomplished using a BigDye Terminator ver. 3.1 Cycle Sequencing Kit (Applied Biosystems) in an automated 3730 × l DNA Analyzer (Applied Biosystems).
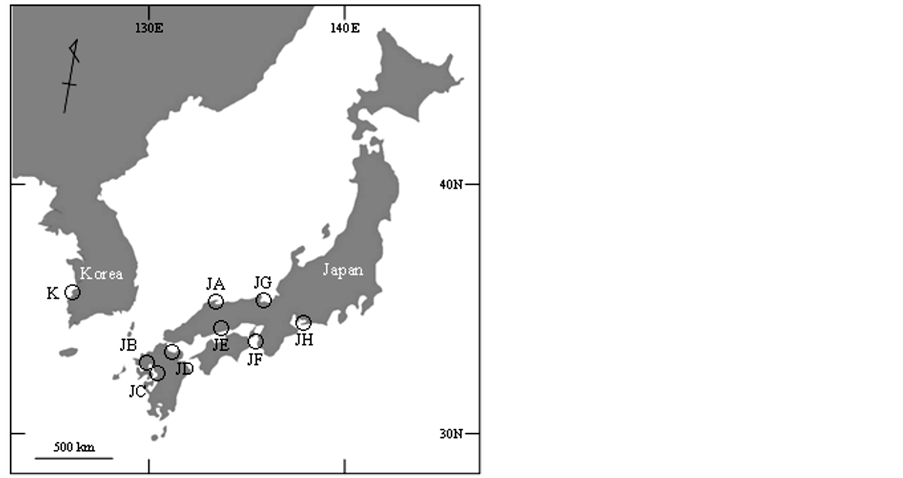
Figure 1. Locations of sample collection of Scapharca kagoshimensis in Japan and Korea. Abbreviations of populations refer to Table1
The determined sequences were edited and aligned with CLUSTAL W [17] using MEGA ver. 5.5 [18] followed by submission to GenBank under AB854359-AB854417.
Haplotype diversity h and nucleotide diversity π were estimated using Arlequin ver. 3.5 [19]. Pairwise ΦST values among sampling localities were calculated using Arlequin ver. 3.5, following which their significance was evaluated by performing a randomization test with 1000 replications and Bonferroni corrections [20]. Neighborjoining (NJ) tree with bootstrap analysis was constructed on the basis of the Kimura 2-parameter model [21] with 1000 replications using NEIGHBOR in PHYLIP ver. 3.68 [22]. Haplotype network based on statistical parsimony was resolved using TCS ver. 1.21 [23]. A distance matrix for all pairwise haplotype comparisons was constructed, and the maximum number of mutational differences justified by the parsimony limit of 0.95 was estimated. Mismatch distribution analysis of nucleotide sequences was performed for goodness-of-fit to simulated values of sudden population expansion by parametric bootstrapping with 1000 replicates using Arlequin ver. 3.5. Tajima’s D value [24] and Fu’s FS value [25] for neutrality test were estimated from sequence variations using Arlequin ver. 3.5.
3. Results
After editing nucleotide sequences of PCR product encoding the mtDNA COI gene, 555 bp were aligned from 225 individuals of S. kagoshimensis. There were 43 variable sites and no insertion or deletion (Table 2), and the number of nucleotide substitutions ranged from 7 to 17

Table 1 . Descriptive statistics of Scapharca kagoshimensis in Japan and Korea based on the mtDNA COI sequence data.
for each population. A total of 14 common haplotypes from H01 to H14 were identified from 59 haplotypes, but only 3 haplotypes, H01, H02 and H14, were shared between Japan and Korea (Table 3). The minimum and maximum numbers of haplotypes were obtained to be 6 haplotypes in Korea (site K) and 15 haplotypes in Nakaumi Lagoon (site JA), respectively (Table 1).
Table 1 summarizes average ± standard deviation of genetic diversity indices, h and π. Of 8 populations in Japan, the h and π values ranged from 0.65 ± 0.09 to 0.93 ± 0.02 and from 0.22 ± 0.16% to 0.59 ± 0.36%, respectively, reflecting relatively high level of genetic diversity. In contrast, the respective values in Korea were determined to be 0.45 ± 0.14 and 0.19 ± 0.15% and thus indicated significantly lower genetic diversity compared with that in Japan. The pairwise ΦST values among 9 populations in Japan and Korea ranged between 0.045 - 0.416 (Table 4). Excepting between Suo Sea (site JD) and Wakasa Bay (site JG) and Suo Sea and Mikawa Bay (site JH), the ΦST values were evaluated to be significant, indicating reduced gene flow even between geographically closed sites, such as North Ariake Sea (site JB) and South Ariake Sea (site JC). Otherwise, 5 distinguished clusters for Nakaumi Lagoon, North and South Ariake Sea, Osaka Bay (site JF), Wakasa Bay and the other populations appeared on the NJ tree (Figure 2).
The demographic history of S. kagoshimensis was investigated on the basis of mismatch distribution analysis and neutrality test. The mismatch distribution analysis for Nakaumi Lagoon and North and South Ariake Sea showed unimodal profile, which closely matched the simulation model (Figure 3). In contrast, the mismatch distribution analysis for Mizushima Sea (site JE) and Korea showed L-shaped profile, and that for the other populations showed clearly multimodal profile (Figure 3).
Both SSD and Hri values in the goodness-of-fit test were not significant in all of 9 populations, inferring no severe deviation from the estimated demographic model (Table 5). The Tajima’s D values showed positive and negative for North and South Ariake Sea and the other populations, respectively, but the Fu’s FS values showed negative for all populations (Table 5).
4. Discussion
This study thoroughly compared the genetic diversity of S. kagoshimensis among 8 populations in Japan and 1 population in Korea, all of which were either former or current fishing areas. As S. kagoshimensis had records on frequent transplantation of its natural seedlings or adults among fishing areas in Japan [3], this study could elucidate an effect of its past transplantation. This study also provided us with an opportunity to explain the academically important factors including phylogeographic expansion and demographic history of S. kagoshimensis.
Its natural seedlings had been repeatedly collected in Nakaumi Lagoon and then transplanted to North Ariake Sea and Mizushima Sea several times, since their collection method was developed in Nakaumi Lagoon in the 1880s [3]. However, its natural seedlings collected in Mizushima Sea had been re-transplanted to Nakaumi Lagoon in the late the 1950s, because natural seedling production in Nakaumi Lagoon decreased due to deterioration of water quality. Furthermore, when catches temporarily increased in Osaka Bay, its adults had been actively released from Osaka Bay to Nakaumi Lagoon, Ariake Sea, and Mizushima Sea in the early 1960s. Although many records available on transplantation and release, the frequencies and numbers of haplotypes were different at each population (Table 3), indicating the maintenance of the independent genetic structures in 9 populations analyzed in this study. In addition, the pairwise ΦST values showed that the genetic differences among 8 populations in Japan were relatively high level (Table 4). Otherwise, the NJ tree constructed using the pairwise ΦST value formed 4 independent clusters with Nakaumi Lagoon, North and South Ariake Sea, Osaka
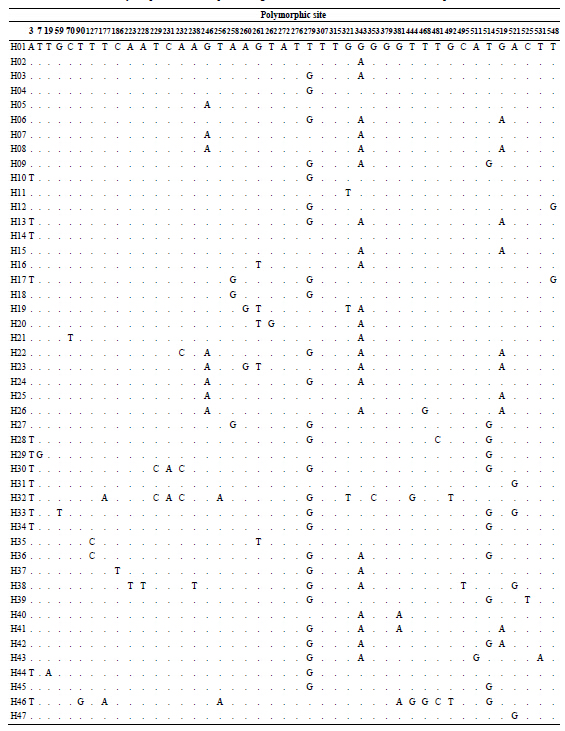
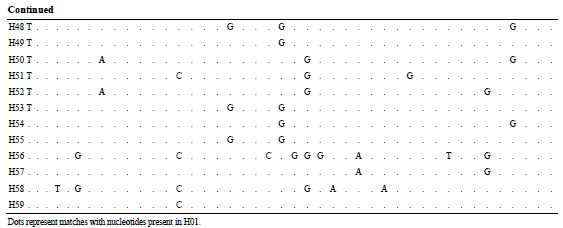
Table 2 . Polymorphic sites of Scapharca kagoshimensis based on the mtDNA COI sequence data.
Figure 2. Neighbor-joining tree based on pairwise ΦST values of Scapharca kagoshimensis in Japan and Korea. Abbreviations of populations refer to Table1
Bay and Wakasa Bay along with a single combined cluster with Suo Sea, Mizushima Sea, Mikawa Bay and Korea (Figure 2). Although its natural seedlings or adults had been repeatedly transplanted among Nakaumi Lagoon, North Ariake Sea, Mizushima Sea and Osaka Bay, their population structures were demonstrably independent. All of these results definitely indicate little effect of past transplantation to the current genetic diversity. Notably, no official records of transplantation and release were available among Suo Sea, Wakasa Bay, Mikawa Bay and Korea, all of which were involved in the single cluster.
Haplotype networks of Nakaumi Lagoon, North and South Ariake Sea and Mizushima Sea showed bush-like tree with some loop branches (Figure 4). In addition, the mismatch distribution analysis for these 4 populations commonly showed unimodal profile (Figure 3). They supposedly had a recent history of continuous reproduction, but Nakaumi Lagoon, North and South Ariake Sea were more stable in the population structures than Mizushima Sea. Mizushima Sea might suffer to rapid population growth, because of nearly L-shaped mismatch distribution model. In contrast, haplotype networks of Suo Sea, Osaka Bay, Wakasa Bay, Mikawa Bay and Korea showed bush-like tree with many putative mutational steps between haplotypes (Figure 4). In addition, the mismatch distribution analysis for these 5 populations showed multimodal profile (Figure 3). They supposedly had a recent history of variable reproduction caused by population expansion after bottleneck in population size. This was supported not only by relatively low level of the h and π values of Suo Sea and Osaka Bay (Table 1) but also by deep branching among haplotypes in haplotype networks of Wakasa Bay and Mikawa Bay (Figure 4). Based on strong L-shaped mismatch distribution model (Figure 3), Korea supposedly had a unique recent history of population expansion.
Neutrality tests of the Tajima’s D and the Fu’s FS values were originally developed to test neutral hypothesis but widely used to detect changes in population size [26]. Significant negative and positive values of the Tajima’s D test suggest expansion in population size and population bottleneck, respectively. The Fu’s FS test was also sensitive to population demographic expansion, with a significant negative value suggest demographic expansion. North and South Ariake Sea supposedly had no obvious signal of demographic change but bottleneck might be expected, because the Tajima’s D values were not significant but were positive (Table 5). Otherwise, all of 9 populations including North and South Ariake ea supposedly had signal of demographic change, because of the negative Fu’s FS values. S. kagoshimensis
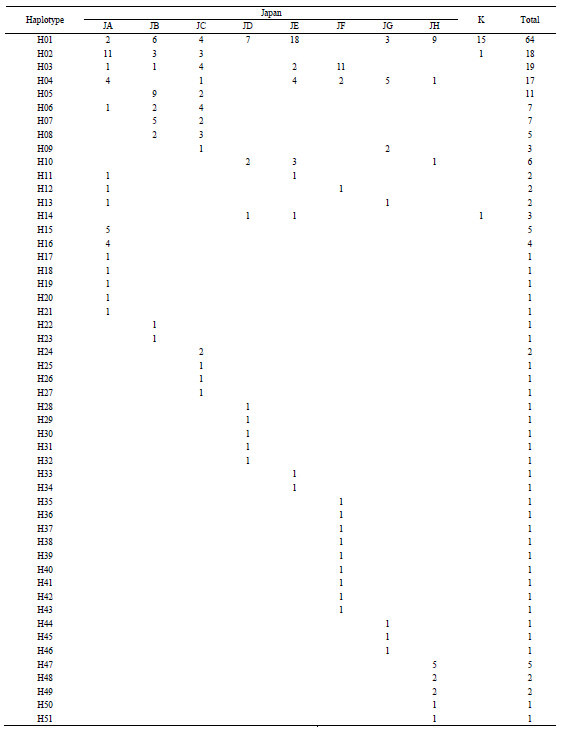
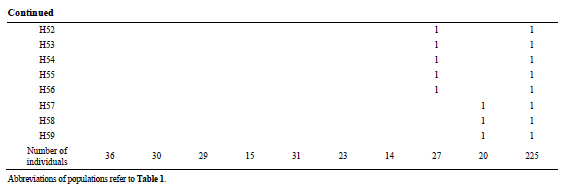
Table 3 . Haplotype frequencies of Scapharca kagoshimensis in Japan and Korea based on the mtDNA COI sequence data.
Table 4. Pairwise ΦST among Scapharca kagoshimensis in Japan and Korea based on the mtDNA COI sequence data.
Abbreviations of populations refer to Table1 *p < 0.05, **p < 0.0033 following Bonferroni correction (k = 36).
Table 5. Statistical tests for neutrality and the estimate of demographic parameters for Scapharca kagoshimensis in Japan and Korea based on the mtDNA COI sequence data.
Abbreviations of populations refer to Table1 *p < 0.05, **p< 0.02.
S had undergone repeated mass mortality in some fishing areas of Japan [3], and both the negative Tajima’s D and Fu’s FS values for most populations and no significant SSD and Hri values of the goodness-of-fit test supported this demographic history (Table 5). It is concluded that each population has experienced rapid population growth or reduction of population size such as bottleneck in a short period.
5. Conclusions
This study thoroughly compared the genetic diversity and genetic structure of S. kagoshimensis among 8 populations in Japan and 1 population in Korea, all of which were either former or current fishing areas by means of nucleotide sequence analysis of a 555-bp portion of the mitochondrial DNA COI gene. The result was that Japan was relatively high levels of genetic diversity, while Ko-
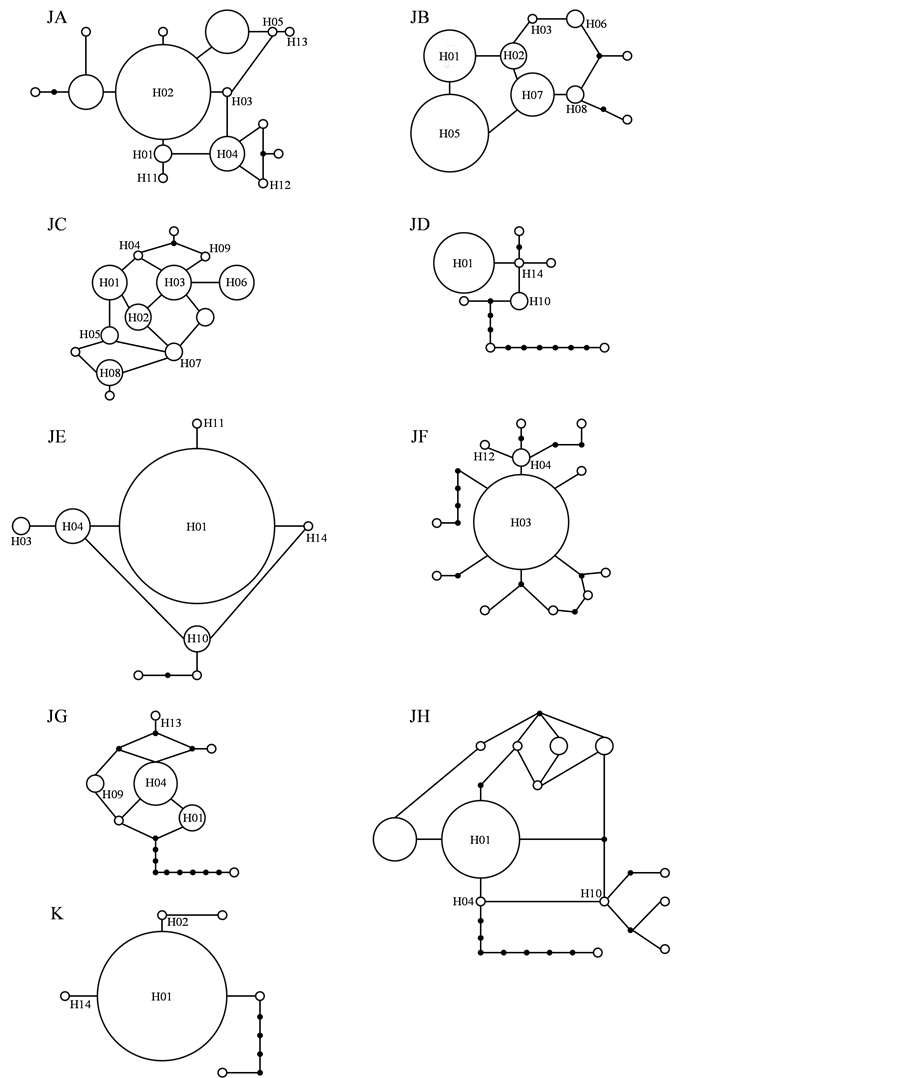
Figure 3. Haplotype networks of Scapharca kagoshimensis in Japan and Korea. Circle size is proportional to the frequency of each haplotype, and 14 common haplotypes are represented by H01-H14. Circle, dot, and line are haplotypes, hypothetical missing intermediates, and one mutational step, respectively. Abbreviations of populations refer to Table1
rea was lower genetic diversity compared with that in Japan. Although S. kagoshimensis had many records on frequent transplantation and release of its natural seedlings or adults among fishing areas in Japan, the frequencies and numbers of haplotypes were different at each population. Additionally, S. kagoshimensis in Japan showed a recent history of multiple types of reproduction and signals of demographic change in each population. These results were inferred that S. kagoshimensis has experienced rapid population growth or reduction in population size such as a bottleneck in a short period. All of these results definitely indicate little effect of past transplantation to the current genetic diversity, and the maintenance of the independent genetic structures of S.
Figure 4. Mismatch distributions of Scapharca kagoshimensis in Japan and Korea. Bars and lines are observed and simulated values, respectively. Abbreviations of populations refer to Table1
kagoshimensis in Japan is analyzed in this study.
Acknowledgements
This research was supported in part by Grant-in-Aid for JSPS Fellows Grant Number 24-2801 to Tomomi Tanaka as JSPS Research Fellow DC2 and by grants from the Agriculture, Forestry and Fisheries Council of Japan.
REFERENCES
- T. Okutani, “Class BIVALVIA/Subclass PTERIOMORPHIA/Orde ARCOIDA,” In: T. Okutani, Ed., Marine Mollusks in Japan, Tokai University Press, Kanagawa, 2001, pp. 845-855.
- Ministry of Agriculture, Forestry and Fisheries, “Annual Statistics of Fishery and Aquaculture Production,” Association of Agriculture & Forestry Statistics, Tokyo, 2009.
- D. Kusakabe, “Studies on the Culture of the Artificial Seeds of the Ark Shell Anadara subcrenata (Lischke),” Journal of the Faculty of Fisheries and Animal Husbandry Hiroshima University, Vol. 2, No. 2, 1959, pp. 183- 239.
- T. Mukai, “Hybridization and Introgression in the Speciation Process of Fishes,” Japanese Journal of Ichthyology, Vol. 48, No. 1, 2001, pp. 1-18.
- C. Wang, C. Li and S. Li, “Mitochondrial DNA-Inferred Population Structure and Demographic History of the Mitten Crab (Eriocheir sensu stricto) Found along the Coast of Mainland China,” Molecular Ecology, Vol. 17, No. 15, 2008, pp. 3515-3527.
- S. von der Heyden, E. Gildenhuys, G. Bernardi and R. C. K. Bowie, “Fine-Scale Biogeography: Tidal Elevation Strongly Affects Population Genetic Structure and Demographic History in Intertidal Fishes,” Frontiers of Biology, Vol. 5, No. 1, 2013, pp. 29-38.
- J. C. Avise, “Phytogeography: The History and Formation of Species,” Harvard University Press, Massachusetts, 2000.
- Y. Iidzuka, T. Mito, K. Noda, T. Iwasaki, T. Tanaka, T. Yokoo and F. Aranishi, “Genetic Diversity of YamatoShijimi Clam Corbicula japonica in Lake Shinji, Japan,” Research Report of the Research and Education Center for Inlandwater Environment Shinshu University, No. 6, 2010, pp. 115-124.
- M. Iida, M. Kanno and A. Kijima, “Genetic Population Structure of Corbicula japonica around East Asia Estimated by mtDNA COI Sequence Analysis,” Nippon Suisan Gakkaishi, Vol. 78, No. 5, 2012, pp. 934-944. http://dx.doi.org/10.2331/suisan.78.934
- Y. Mao, T. Gao, T. Yanagimoto and Y. Xiao, “Molecular Phylogeography of Ruditapes philippinarum in the Northwestern Pacific Ocean Based on COI Gene,” Journal of Experimental Marine Biology and Ecology, Vol. 407, No. 2, 2011, pp. 171-181. http://dx.doi.org/10.1016/j.jembe.2011.06.002
- T. Tanaka and F. Aranishi, “Mitochondrial DNA Markers for PCR-Based Phylogenetic Analysis of Ark Shells,” Open Journal of Marine Science, Vol. 3, No. 4, 2013, pp. 182-189. http://dx.doi.org/10.4236/ojms.2013.34021
- S. Y. Lee and S. H. Kim, “Genetic Variation and Discrimination of Korean Arkshell Scapharca Species (Bivalvia, Arcoida) Based on Mitochondrial COI Gene Sequences and PCR-RFLP,” Korean Journal of Genetics, Vol. 25, No. 4, 2003, pp. 309-315.
- E. S. Cho, C. G. Jung, S. G. Sohn, C. W. Kim and S. J. Han, “Population Genetic Structure of the Ark Shell Scapharca broughtonii Schrenck from Korea, China, and Russia Based on COI Gene Sequences,” Marine Biotechnology, Vol. 9, No. 2, 2005, pp. 203-216. http://dx.doi.org/10.1007/s10126-006-6057-x
- F. Aranishi and T. Okimoto, “Genetic Relationship between Cultured Populations of Pacific Oyster Revealed by RAPD Analysis,” Journal of Applied Genetics, Vol. 45, No. 4, 2004, pp. 435-443.
- F. Aranishi and T. Okimoto, “Sequence Polymorphism in a Novel Noncoding Region of Pacific Oyster Mitochondrial DNA,” Journal of Applied Genetics, Vol. 46, No. 2, 2005, pp. 201-206.
- F. Aranishi, “A Novel Mitochondrial Intergenic Spacer Reflecting Population Structure of Pacific Oyster,” Journal of Applied Genetics, Vol. 47, No. 2, 2006, pp. 119- 123. http://dx.doi.org/10.1007/BF03194610
- J. D. Thompson, D. G. Higgins and T. J. Gibson, “CLUSTAL W: Improving the Sensitivity of Progressive Multiple Sequence Alignment through Sequence Weighting, Position-Specific Gap Penalties and Weight Matrix Choice,” Nucleic Acids Research, Vol. 22, No. 22, 1994, pp. 4673-4680. http://dx.doi.org/10.1093/nar/22.22.4673
- K. Tamura, D. Peterson, N. Peterson, G. Stecher, M. Nei and S. Kumar, “MEGA5: Molecular Evolutionary Genetics Analysis Using Maximum Likelihood, Evolutionary Distance, and Maximum Parsimony Methods,” Molecular Biology and Evolution, Vol. 28, No. 10, 2011, pp. 2731- 2739. http://dx.doi.org/10.1093/molbev/msr121
- L. Excoffier and H. E. L. Lischer, “Arlequin Suite ver 3.5: A New Series of Programs to Perform Population Genetics Analyses under Linux and Windows,” Molecular Ecology Resources, Vol. 10, No. 3, 2010, pp. 564-567. http://dx.doi.org/10.1111/j.1755-0998.2010.02847.x
- W. R. Rice, “Analyzing Tables of Statistical Tests,” Evolution, Vol. 43, No. 1, 1989, pp. 223-225. http://dx.doi.org/10.2307/2409177
- M. Kimura, “A Simple Method for Estimating Evolutionary Rates of Base Substitutions through Comparative Studies of Nucleotide Sequences,” Journal of Molecular Evolution, Vol. 16, No. 2, 1980, pp. 111-120. http://dx.doi.org/10.1007/BF01731581
- J. Felsenstein, “PHYLIP (Phylogeny Inference Package) Version 3.6. (Distributed by Felsenstein J.),” University of Washington, Seattle, 2005.
- M. Clement, D. Posada and K. Crandall, “TCS: A Computer Program to Estimate Gene Genealogies,” Molecular Ecology, Vol. 9, No. 10, 2000, pp. 1657-1660. http://dx.doi.org/10.1046/j.1365-294x.2000.01020.x
- F. Tajima, “Statistical Method for Testing the Neutral Mutation Hypothesis by DNA Polymorphism,” Genetics, Vol. 123, No. 3, 1989, pp. 585-595.
- Y. X. Fu, “Statistical Tests of Neutrality against Population Growth, Hitchhiking and Background Selection,” Genetics, Vol. 147, No. 2, 1997, pp. 915-925.
- S. Mousset, N. Derome and M. Veuille, “A Neutrality Test Based on the Mismatch Distribution,” Molecular Biology and Evolution, Vol. 21, No. 4, 2004, pp. 724-731. http://dx.doi.org/10.1093/molbev/msh066