Open Journal of Marine Science
Vol.3 No.3(2013), Article ID:34578,8 pages DOI:10.4236/ojms.2013.33015
Distribution of Diuron in Coastal Seawater and Sediments from West Sea Area of Zhoushan Island
1Marine Science and Technology College of Zhejiang Ocean University, National Engineering Research Center of Marine Facilities Aquaculture, Zhoushan, China
2Zhejiang Marine Development Research Institute, Zhoushan, China
3North China Sea Marine Technical Support Center of State Oceanic Administration, Qingdao, China
Email: xhz1967@zjou.edu.cn
Copyright © 2013 Huanzhi Xu et al. This is an open access article distributed under the Creative Commons Attribution License, which permits unrestricted use, distribution, and reproduction in any medium, provided the original work is properly cited.
Received May 13, 2013; revised June 15, 2013; accepted June 24, 2013
Keywords: Diuron; Seawater; Sediment; Zhoushan Island
ABSTRACT
The pollution level of diuron in seawater and sediments in the west coastal sea area of Zhoushan Island from 2011 to 2013 was investigated. Results revealed that the concentration of diuron in seawater varies from less than (3.0 to 52.1) ng·L−1, with an average level of less than 11.1 ng·L−1. The annual average content was less than 7.9 ng·L−1, 13.9 ng·L−1, and 12.3 ng·L−1 in 2011, 2012, and 2013, respectively. The concentrations of diuron in marine sediments also varied from less than (0.3 to 3.9) ng·g−1 (dry weight), with an average concentration of less than 1.13 ng·g−1 (dry weight). The annual average concentration was less than 0.851 ng·g−1, 1.328 ng·g−1, and 1.202 ng·g−1 in 2011, 2012, and 2013, respectively. The accumulation of diuron in seawater and sediments may pose a potential risk to the marine ecosystem of the investigated sea area.
1. Introduction
Diuron (3-(3,4-dichlorophenyl)-1,1-dimethylurea) is a broad spectrum herbicide that inhibits photosynthesis [1]. Introduced by Bayer in 1954 [2], diuron is widely utilized for weed, grass, and brush control in farmlands and lawns and on highway shoulders [1,3]. However, an increasing amount of evidence suggests that the use of diuron poses an immense risk to the ecological environment. The Australian Pesticides and Veterinary Medicines Authority (APVMA) indicates that diuron is highly toxic to algae and aquatic plants, and its residues could remain in soil and water for a long time. The APVMA suggested that the use of diuron be suspended except in anti-fouling paint, algae control, and as a buffer to continue the use of cotton defoliant [4-6]. The US Environmental Protection Agency has also categorized diuron as a “likely human carcinogen” [7]. The prevention and reduction of the environmental risks posed by diuron as well as the protection of human health should be prioritized by conducting research on the degradation and distribution features of diuron in the environment.
The main sources of diuron in seawater and sediments are land input, ship anti-fouling paint, and atmospheric precipitation. The seawater investigated in this study comes from a relatively closed body of water located between Ningbo City and main Zhoushan Island near the Zhoushan Port north of Hangzhou Bay and south of ZhouYong waterway. The eastern and northeastern coasts contain Zhoushan’s intensive industrial area wherein many urban stream outlets dispose a considerable amount of industrial and domestic waste water into the water. Various activities in the area produce pollutants such as diuron; these pollutants damage the environment and pose a potential risk to the marine ecosystem.
Data on the amount of diuron in seawater and sediments from 2011 to 2013 were utilized in this study to discuss the distribution and water-sediment partitioning of diuron. The distribution characteristics of diuron, which provided a theoretical basis for the control of pollution by diuron, were investigated. Restoration of the environment and reasonable development and utilization of Zhoushan coastal resources in the future were also discussed.
2. Materials and Methods
2.1. Chemicals
HPLC-grade (grade for High Performance Liquid Chromatography) methanol, ethyl acetate, n-hexane, and acetone were purchased from Oceanpak Alexative Chemical Co., Ltd. (Sweden). Standard diuron (100 g·ml−1 acetone solution) was purchased from Agro-Environmental Protection Institute (Ministry of Agriculture, P. R. China). Dicuran N and N-dimethyl-d6 (98% purity), which were utilized as the internal standard, were obtained from Cambridge Isotope Laboratories (USA). Anhydrous sodium sulfate (AR grade) was obtained from Sinopharm Chemical Reagent Co., Ltd. (China).
2.2. Sample
Sampling Seawater and corresponding sediment samples were collected from the sea area from March 2011 to March 2013. The samples were collected along the main Zhoushan Island off the west coast and Zhujiajian Island in the west coast at a longitude of 121˚58′ to 122˚22′ and latitude of 29˚54′ to 30˚09′ (Figure 1). Water samples were collected 0.5 m below the surface with a Niskin bottle sampler. Sediment samples were collected with a Van Veen grab sampler [8,9].
2.3. Sample Preparation
Isolation of diuron from seawater samples was performed through solid-phase extraction (SPE) following a method developed by Gatidou et al. [10]. The SPE cartridges (Isolute C18, 1 g) were activated with 10 mL each of methanol and ultrapure water. After filtering the water samples (2000 mL) through a glass fiber membrane filter with a pore diameter of 0.45 mm and mixing the samples with the internal standard, extraction was performed at a flow rate of 10 mL·min−1. The cartridges were then washed with 4 × 2.5 mL of ultrapure water, dried for 3 min, and eluted with 3 × 2 mL of methanol. The eluents were allowed to evaporate until dry under a gentle stream of nitrogen (35˚C) and were redissolved in 500 μL of ethyl acetate.
The sediment samples for the determination of diuron were extracted with a Soxhlet extractor through SPE. The sediment samples were frozen at −30˚C in a freezer, freeze-dried, and then crushed with a sieve (80 mesh). The fine, dried sediments (50.00 g) mixed with the internal standard and 10 g of anhydrous sodium sulfate were loaded in a round paper tube pre-treated with n-hexane and then placed in a Soxhlet extractor with 400 ml of n-hexane/acetone (V:V = 1:5) solvent. The solutions were cooled at room temperature after refluxing at 60˚C for 8 h. The solutions were allowed to evaporate until dry under a gentle stream of nitrogen (35˚C) and
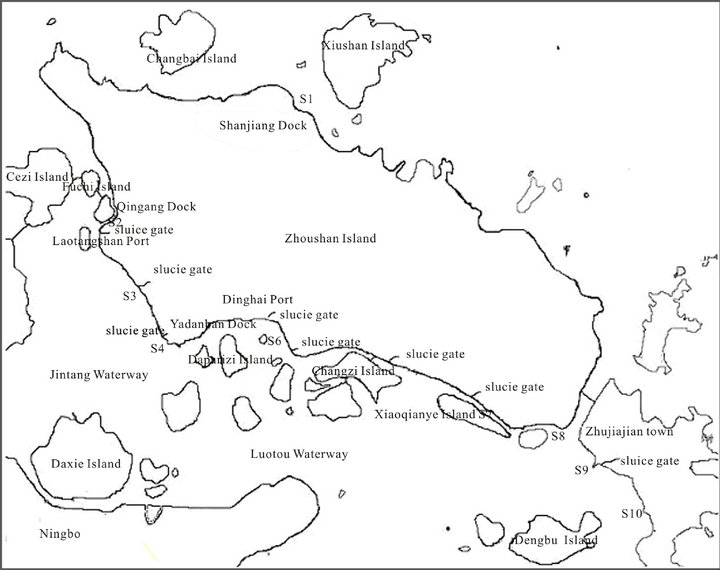
Figure 1. Sampling locations.
redissolved in 10 mL of ethyl acetate [11]. The SPE cartridges (Isolute C18, 1 g) were activated with 5 mL of ethyl acetate. The cartridges were eluted with 10 mL of ethyl acetate after the sample solutions were extracted. The eluents were allowed to evaporate until dry under a gentle stream of nitrogen (35˚C) and reconstituted with 2 mL of methanol for high-performance liquid chromatography (HPLC) analysis [10].
2.4. Liquid Chromatographic Conditions
HPLC was performed with a UV detector at a wavelength of 254 nm and with 50% methanol and 50% water as mobile phase at a flow rate of 1 mL·min−1, injection volume of 20 μL, and 5.80 min of retention time for diuron analysis [10].
2.5. Statistical Analysis
Statistical data analysis was performed with data processing system (DPS) (version 7.05). Analysis of variance (ANOVA) was conducted to determine possible differences among the analytical concentrations and sampling sites. Duncan’s test was also utilized for multiple comparisons with a = 0.05 level of significance.
3. Results
3.1. Diuron in Seawater
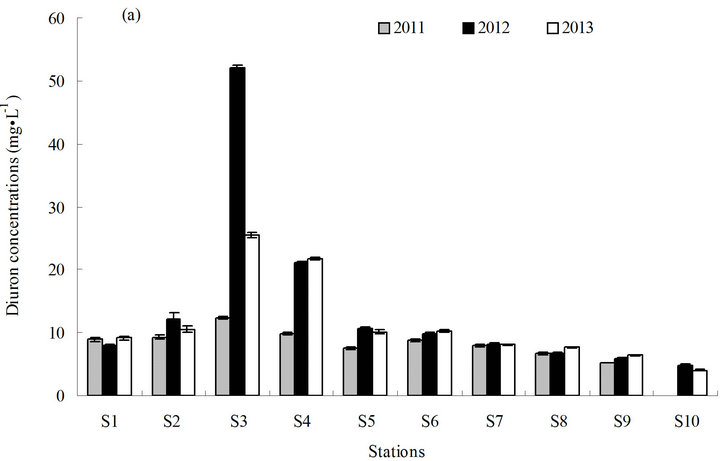
The concentration of diuron in seawater ranged from less than (3.0 to 52.1) ng·L−1 (average <11.1 ng·L−1) from 2011 to 2013 (Figure 2). The annual concentration of diuron in seawater varied from less than (3.0 to 12.3) ng·L−1 (average <7.9 ng·L−1) in 2011, (4.8 to 52.1) ng·L−1 (average 13.9 ng·L−1) in 2012, and (4.0 to 25.5) ng·L−1 (average 12.3 ng·L−1) in 2013. The highest concentration of diuron was measured in station S3 (52.1 ng·L−1) (Figure 2(a)).
Diuron content in seawater exhibited a tendency to homogenize and decreased slightly from the north to the south, with the highest concentration in the middle, because of the relatively closed investigated sea area. This finding may be ascribed to terrigenous input and current flow from Hangzhou Bay. The intermediate fluctuations may be ascribed to terrigenous input from Zhoushan Island and port throughput and anchorage berthing capacity near the station. Station S3, which has the highest diuron concentration, is located south of the continuous expansion of Laotangshan Port; station S3 is also near the terrestrial river sluice and the anchorage for large cargo ships. The average concentration of diuron in station S3 was significantly higher than that in the other stations (p ≤ 0.05). Station S4, located south of S3 and near another river sluice, had the second highest average concentration of diuron. The content of diuron in the
 (a)
(a)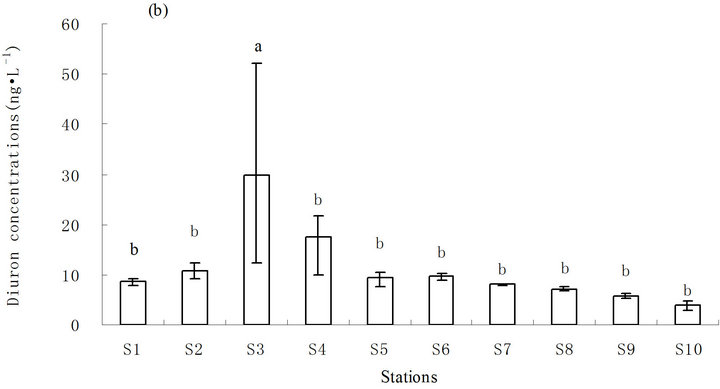 (b)
(b)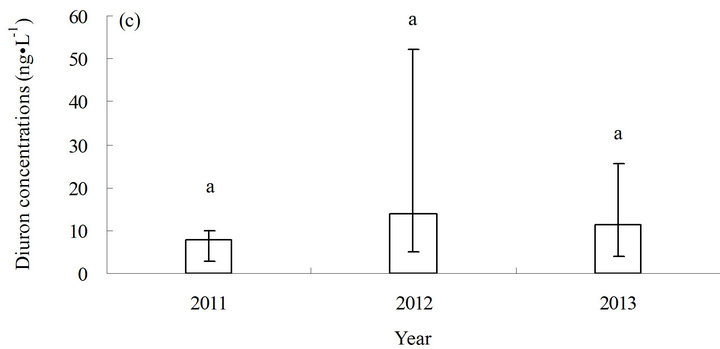 (c)
(c)
Figure 2. Distribution of diuron in seawater from 2011 to 2013. (a) Distribution of diuron in the different stations; (b) annual average content of diuron in the different stations in three years; and (c) annual average content of diuron in the sampling area in three years. a and b in (b) and (c) represent the statistical difference between sampling stations and sampling time with p ≤ 0.05, respectively. a and b represent the levels of significant difference; a is significantly greater than b. The levels not connected by the same letter are significantly different.
other stations was relatively normal and exhibited no significant difference (Figure 2(b)).
The maximum concentration of diuron in the study area (52.1 ng·L−1) is close to that in southern California marina in the US in 2008 (68 ng·L−1) [12] and in the coastal water of southern UK in 2000 (78 ng·L−1) [13] (Table 1). However, the diuron concentrations observed in Shoreham Harbour and Brighton Marina in the UK (up to 366 ng·L−1) [14] and in the port of Osaka in Japan are higher (up to 350 ng·L−1) [15] than the diuron concentrations recorded in this study (Table 1). With regard to the risks posed by diuron to the marine environment, China still has no seawater quality standards or environmental exposure limits for diuron in seawater. New Zealand’s Environmental Protection Authority (EPA) established environmental exposure limits (EELs) for hazardous substances, including diuron, in seawater (1.8 mg·L−1) [17]. The Ecological Fate and Effects Division of the US EPA Office of Pesticide Programs (OPP) reviewed numerous diuron toxicity studies on several aquatic and terrestrial species conducted by the US EPA, US Department of Agriculture, and US Fish and Wildlife Service laboratories in 2008. The 2008 OPP Pesticide Ecotoxicity Database indicates that EC50 growth inhibition in marine algae species for diuron in 72 h is (10 to 50) mg·L−1 [18]. Although diuron concentrations in the sampling area are lower than the standard concentration, diuron would accumulate significantly in the sampling area because of the high half-life of diuron in seawater (43 d to 2180 d) [19]. The results of the three-year investigation revealed a gradual increase in diuron levels in seawater (Figure 2(c)), indicating that a potential environmental risk exists in the investigated sea area[atian1] .
3.2. Diuron in Sediments
The concentration of diuron in sediments ranged from less than (0.3 to 3.9) ng·g−1 in dry weight (average <1.13 ng·g−1) from 2011 to 2013 (Figure 3). The annual concentration of diuron in sediments obtained from the different stations varied from less than (0.3 to 1.43) ng·g−1 (average <7.9 ng·g−1) in 2011, (4.8 to 52.1) ng·g−1 (average 13.9 ng·g−1) in 2012, and (4.0 to 25.5) ng·g−1 (average 12.3 ng·g−1) in 2013.
The distribution characteristics of diuron in sediments were generally similar to those in seawater. The basic change in chemotaxis of diuron in sediments was also consistent with that in seawater. The concentration of diuron in sediments varied slightly from high to low and from north to south. The highest concentration of diuron in sediments was observed in the middle (station S3), which was significantly higher than the other stations (p ≤ 0.05) (Figure 3(b)). No significant increase was observed in the annual average level of diuron in sediments in three years, although the average level of diuron did exhibit a year-on-year upward trend (Figure 3(c)).
The concentration of diuron in sediments in this study is comparable to those reported by other researchers (Table 2). The highest concentration of diuron in sediments in this study (3.9 ng·g−1) is similar to that in southern California marina in the US in 2008 (4.2 ng·g−1) [12] and in the coastal water of southern UK in 2000 (6.2 ng·g−1) [13]. However, diuron concentration in this study is only slightly lower than diuron concentrations measured in southern California marina in the US in 2008 (4.2 ng·g−1) and in southern UK in 2000 (6.2 ng·g−1) but much lower than diuron concentrations measured in Shoreham Harbour and Brighton Marina in the UK in 2004 (up to 66.4 ng·g−1) [14] , Maizuru Bay in Japan in 2007 (up to 128 ng·g−1) [16], and port of Osaka in Japan (up to 1350 ng·g−1) [15] (Table 2). No environmental exposure limits for diuron in sediments have been set. Sediments serve as a diuron repository for seawater because diuron has a high partitioning ratio between sediments and seawater (log Koc 2.28 to 5.20) [20,21]. Seawater–sediment interface interaction occurs in a dynamic balance, especially in estuary water bodies mixed up and down violently. The slow accumulation of diuron in sediments in the investigated sea area still presents a potential environmenttal risk.[atian2]
3.3. Correlation Analysis of Diuron and Petroleum Hydrocarbons/Suspended Solids
The diuron concentrations were plotted against petroleum hydrocarbon/suspended solid concentrations based
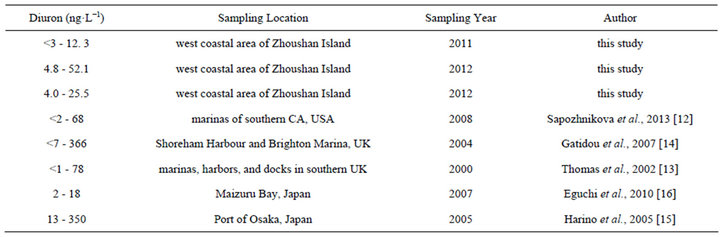
Table 1. Comparison of diuron concentrations in seawater obtained from different sites.
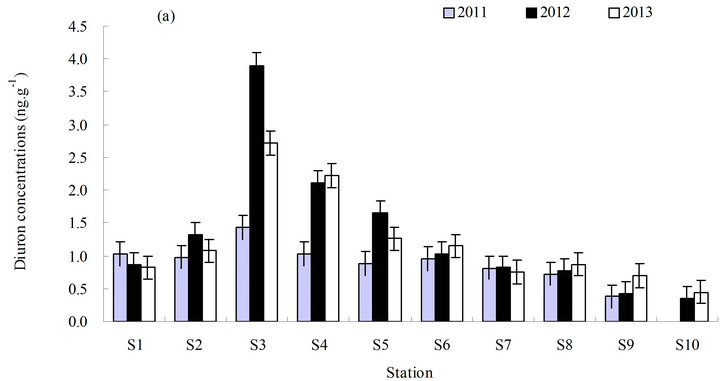
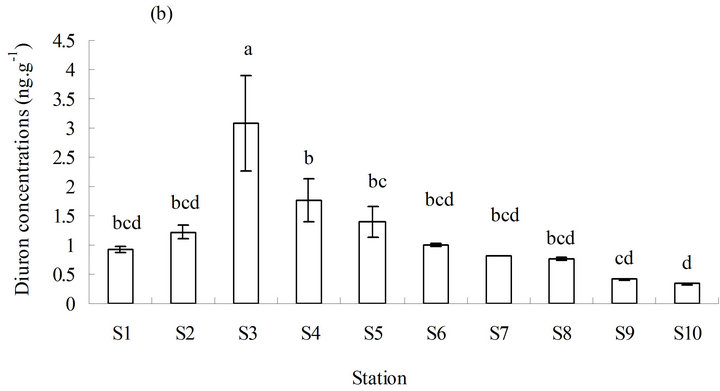
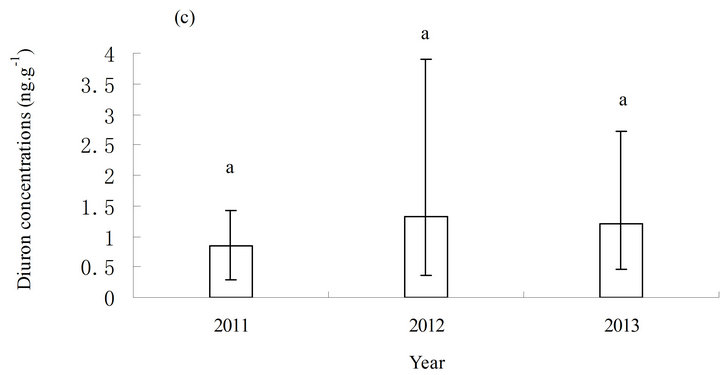
Figure 3 . Distribution of diuron in marine sediments from 2011 to 2013. (a) Distribution of diuron in the different stations; (b) annual average content of diuron in the different stations in three years; and (c) annual average content of diuron in the sampling area in three years. a, b, c, and d in (b) and (c) represent the statistical difference between sampling stations and sampling time with p ≤ 0.05. a, b, c, and d represent the levels of significant difference, where a is significantly greater than b, c is significantly greater than b, and d is significantly greater than c. The levels not connected by the same letter are significantly different.
on data obtained from this study. A linear relationship (Figure 4) was adopted to determine the relationship between diuron and petroleum hydrocarbons in seawater or diuron in sediments and suspended solids in seawater.
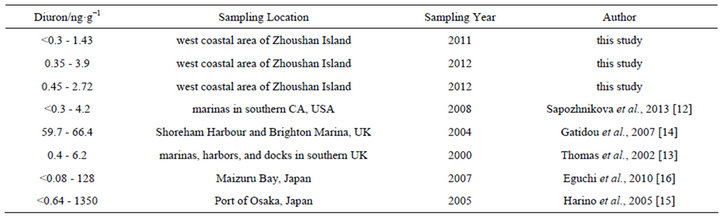
Table 2. Comparison of diuron concentrations (dry weight) in marine sediments obtained from different sites.
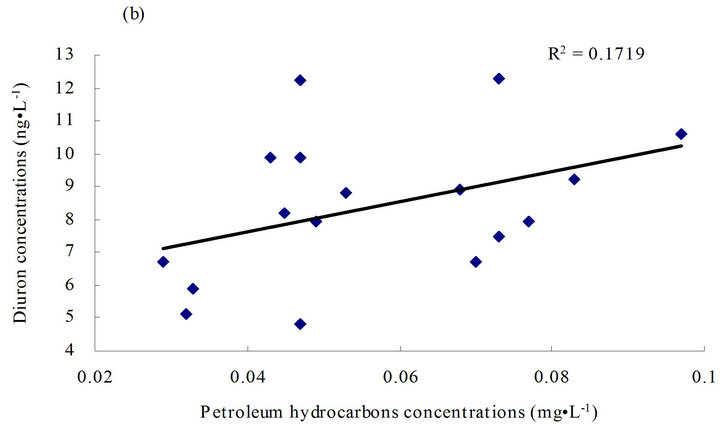
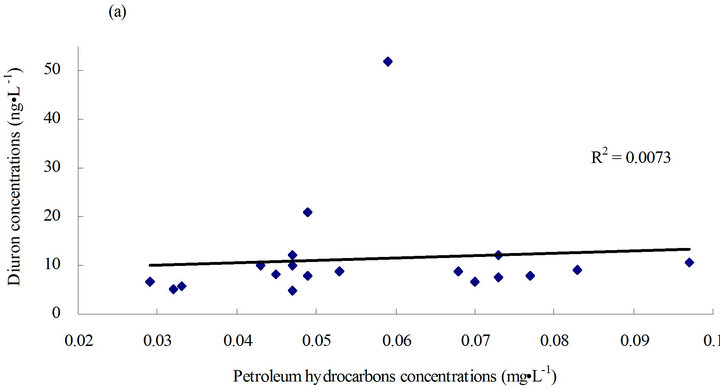

Figure 4. Linear relationship between diuron and petroleum hydrocarbons/suspended solids. (a) Linear relationship between diuron and petroleum hydrocarbons in seawater; (b) linear relationship between diuron and petroleum hydrocarbons in seawater except for diuron concentration points higher than 20 ng·g-1; and (c) linear relationship between diuron in sediments and suspended solids in seawater.
Diuron in sediments and suspended solids in seawater had a highly positive correlation (r2 = 0.51) (Figure 4(c)), indicating a “recent” contamination in the sediments. Diuron and petroleum hydrocarbons in seawater had a slightly positive correlation (r2 = 0.0073) (Figure 4(a)). Except for a few high-value points in the diuron levels, diuron level was found to be highly correlated with petroleum hydrocarbon content (r2 = 0.1719) (Figure 4(b)). This finding indicates that in most cases, diuron and petroleum hydrocarbon may be homologous to some extent or exhibit suitable miscibility in water-oil partitioning.
3.4. Sediment-Water Partitioning
An important process in the interaction between sediment and seawater interface is control of the distribution, fate, toxicity, and bioavailability of diuron [14,20]. This interface interaction usually leads to the enrichment of sediment diuron [22], which can be represented by the sediment-water partitioning coefficient or distribution coefficient Kd (mL·g−1) [14] as shown in the following:
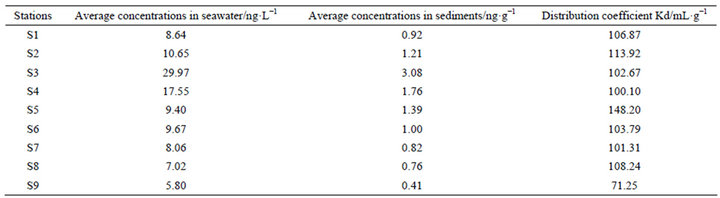
Table 3. Sediment–water partitioning coefficient of diuron in the different sites.
where Cs is the concentration of the compound in the sediment (ng·g−1), and Cw is the concentration of the compound in water (ng·L−1). Table 3 shows that the Kd values for diuron range between (71.25 and 148.20) mL·g−1, which are equivalent to 2.80 to 3.10 in log (Koc) (Koc is the normalized partition coefficient) and are similar to the value indicated in the literature (2.28 to 5.20) [20,21].[atian3]
4. Conclusion
Samples collected from the west coastal sea area of Zhoushan Island from 2011 to 2013 revealed the presence of diuron both in seawater and marine sediments. The maximum measured concentration of diuron in this study reached up to 52.1 ng·L−1 in seawater and 3.9 ng·g−1 in sediments. The annual average contents of diuron in seawater and sediments in the three-year period presented a slow-growing trend, indicating that diuron poses a potential risk to the ecosystems in the investigated area.
5. Acknowledgements
This work was supported by International Science & Technology Cooperation Program of China (Program NO. 2011DFA41900) and the General Project Established autonomously by Key Scientific and Technological Innovation Team of Zhejiang Province (Project NO. 2010R 50025-3).
REFERENCES
- Oregon State University and Intertox, Inc., “Diuron. Roadside Vegetation Management. Herbicide Fact Sheet,” Washington State Department of Transportation’s (WSDOT) Integrated Vegetation Management Program, 2006. http://www.wsdot.wa.gov/NR/rdonlyres/A8A7E00F-B0FC-440B-AF2A-7FC201DFB549/0/diuron.pdf
- “T. Wikipedia, the Free Encyclopedia,” 2013. http://en.wikipedia.org/wiki/DCMU
- S. Balakrishnan, K. Takeda and H. Sakugaw, “Occurrence of Diuron and Irgarol in Seawater, Sediments and Planktons of Seto Inland Sea, Japan,” Geochemical Journal, Vol. 46, 2012, pp. 169-177.
- Australian Pesticides and Veterinary Medicines Authority (APVMA), 2012. http://www.apvma.gov.au/products/review/completed/diuron.php
- Australian Pesticides and Veterinary Medicines Authority (APVMA), “Diuron Final Review Report,” 2012. http://www.apvma.gov.au/products/review/docs/final_diuron_report.pdf
- Australian Pesticides and Veterinary Medicines Authority (APVMA), “Diuron Review,” 2012. http://www.apvma.gov.au/products/review/docs/diuron_vol1.pdf
- B. Ferrucio, C. A. Franchi, N. F. Boldrin, M. L. de Oliveira and J. L. de Camargo, “Evaluation of Diuron (3- [3,4-dichlorophenyl]-1,1-dimethyl urea) in a Two-Stage Mouse Skin Carcinogenesis Assay,” Toxicologic Pathology, Vol. 38, No. 5, 2010, pp. 756-764. http://www.ncbi.nlm.nih.gov/pubmed/20574074
- K. Schiff, “Sediment Chemistry on the Mainland Shelf of the Southern California Bight,” Marine Pollution Bulletin, Vol. 40, No. 3, 2000, pp. 267-276. doi:10.1016/S0025-326X(99)00216-7
- State Bureau of Quality and Technical Supervision of China, “Part 3: Sample Collection, Storage and Transportation,” National Standard of China for the Specification for Marine Monitoring GB17378.3-2007, Standards Press of China, Beijing, 2007.
- G. Gatidou, A. Kotrikla, N. S. Thomaidis and T. D. Lekkas, “Determination of the Antifouling Booster Biocides Irgarol 1051 and Diuron and Their Metabolites in Seawater by High Performance Liquid Chromatography-Diode-Array Detector,” Analytica Chimica Acta, Vol. 528, No. 1, 2005, pp. 89-99. doi:10.1016/j.aca.2004.10.012
- State Bureau of Quality and Technical Supervision of China, “Part 5: Sediment Analysis,” National Standard of China for the Specification for Marine Monitoring GB 17378.5-2007, Standards Press of China, Beijing, 2007.
- Y. Sapozhnikova, E. Wirth, K. Schiff and M. Fulton, “Antifouling Biocides in Water and Sediments from California Marinas,” Marine Pollution Bulletin, 2013. doi:10.1016/j.marpolbul.2013.01.039
- K. V. Thomas, M. McHugh and M. Waldock, “Antifouling Paint Booster Biocides in UK Coastal Waters: Inputs, Occurrence and Environmental Fate,” Science of The total Environment, Vol. 293, No. 1-3, 2002, pp. 117-127. doi:10.1016/S0048-9697(01)01153-6
- G. Gatidou, N. S. Thomaidis and J. L .Zhou, “Fate of Irgarol 1051, Diuron and Their Main Metabolites in two UK Marine Systems after Restrictions in Antifouling Paints,” Environment International, Vol. 33, No. 1, 2007, pp. 70- 77. doi:10.1016/j.envint.2006.07.002
- H. Harino, Y. Mori, Y. Yamaguchi, K. Shibata and T. Senda, “Monitoring of Antifouling Booster Biocides in Water and Sediment from the Port of Osaka , Japan,” Archives of Environmental Contamination and Toxicology, Vol. 48, No. 3, 2005, pp. 303-310. doi:10.1007/s00244-004-0084-2
- S. Eguchi, H. Harino and Y. Yamamoto, “Assessment of Antifouling Biocides Contaminations in Maizuru Bay, Japan,” Archives of Environmental Contamination and Toxicology, Vol. 58, No. 3, 2010, pp. 684-93. doi:10.1007/s00244-009-9394-8
- New Zealand’s Environmental Protection Authority (EPA), “Substance Exposure Limit Register,” 2003. http://www.epa.govt.nz/search-databases/Pages/substance-exposure-limit-register.aspx#eel-tab-soil
- OPP Pesticide Ecotoxicity Database, 2008. http://www.ec.gc.ca/ese-ees/default.asp?lang=En&n=6BC4E5D3-1#a8
- A. Moncada, “DPR Report: Environmental Fate of Diuron,” DPR Pesticide Chemistry Database, Environmental Monitoring Branch, Department of Pesticide Regulation, 2003. http://www.cdpr.ca.gov/docs/empm/pubs/fatememo/diuron.pdf
- S. D. W Comber, G. Franklin, M. J. Gardner, C. D. Watts, A. B. A. Boxall and J. Howcroft, “Partitioning of Marine Antifoulants in the Marine Environment,” Science of the Total Environment, Vol. 286, No. 1-3, 2002, pp. 61-71. doi:10.1016/S0048-9697(01)00963-9
- H. Yamada, “Behaviour, Occurrence and Aquatic Toxicity of New Antifouling Biocides and Preliminary Assessment of Risk to Aquatic Ecosystems,” Bulletin of Fisheries Research Agency, Vol. 21, 2007, pp. 31-45.
- J. L. Zhou, “Occurrence and Persistence of Antifouling Biocide Irgarol 1051 and Its Main Metabolite in the Coastal Waters of Southern England,” Science of the Total Environment, Vol. 406, No. 1-2, 2008, pp. 239-246. doi:10.1016/j.scitotenv.2008.07.049
- [atian1]I tried to put Table 1 in this place (after the paragraph) but failed.
- [atian2]Table 2 should be put in this place (after the paragraph).
- [atian3]Table3 should be put here (after the paragraph)