Open Journal of Marine Science
Vol.2 No.4(2012), Article ID:23818,12 pages DOI:10.4236/ojms.2012.24015
Bioremediation in Mangrove Sediments Impacted by Oil Using Two Types of Fertilizers NPK and OSMOCOTE, Brazil
1Nucleus of Environmental Studies (NEA), Institute of Geosciences (IGEO), Federal University of Bahia, Salvador, Brazil
2Department of Geochemistry (DGQ), Institute of Geosciences, Federal University of Bahia, Salvador, Brazil
Email: danbio28@gmail.com
Received August 10, 2012; revised September 11, 2012; accepted September 20, 2012
Keywords: Biostimulation; Saturated Hydrocarbons; Mangrove; NPK; OSMOCOTE
ABSTRACT
Bioremediation is a technique applied to several environmental impacts, among which the ones generated by petroleum derivatives, through the introduction of microorganisms into the environment, or creating optimal conditions for them to develop. The present study aimed to evaluate the degradation of saturated hydrocarbons through the biostimulation technique in the mangrove sediment impacted by petroliferous activities, testing the potentiality of two fertilizers (NPK and OSMOCOTE) as accelerating agents of the biodegradation of petroleum components, under experimental conditions. In order to understand the bioremediation process it was used the quantification of nutrient contents, the percent of saturated, aromatic and NSO hydrocarbons, and the behavior of saturated compounds along the entire experiment, besides the monitoring of physical and chemical parameters. Chromatographic profiles characterized a major degradation of saturated hydrocarbons at the units with NPK, presenting a better efficiency of this fertilizer in the tested biostimulation process.
1. Introduction
Biological processes are world wildly gaining more and more importance in the treatment of environments especially those contaminated by organic compounds. These methods are favored for being ecologically correct, cleaner, of low costs and of easier appliance in great scale, besides not altering the balance of ecosystems [1]. Bioremediation is defined as the process through which organic residues are biologically degraded under controlled conditions to an innocuous state, or to levels under the concentration limits established by the authorities regulations and it is characterized by the acceleration of the petroleum natural degradation process, where the microorganisms utilize as a main carbon source the hydrocarbons in their metabolic processes [2-6]. Bioremediation is an emerging technology which involves the addition of materials (for example, nutrients or other growth factors) in contaminated environments in order to accelerate natural biodegradation processes [7].
Biostimulation of local microorganisms populations with the objective of increasing biodegradation rates is frequently applied in bioremediation projects [8]. In order to use the biostimulation process, it must be demonstrated that there is at the contaminated site a natural population of microorganisms capable of biodegrading the present contaminants and that environmental conditions are insufficient for obtaining high rates of microbial activity of this population [9]. During biostimulation there are limiting factors, such as nutrients and electron acceptors which stimulate the metabolism and the growth velocity of degraders which accelerate biodegradation rates under favorable environmental conditions. The addition of nutrients into contaminated environments allows a quicker and more efficient degradation of hydrocarbons by native microorganisms [10]. The biostimulation accelerates biodegradation rates of contaminated soils when factors are controlled, like pH, humidity percentages, TPH concentrations (one of the most difficult fractions for degradation), electrons acceptors and temperature [10].
Most of studies are based on the addition of nutrients under the form of fertilizers of inorganic compounds and simple inorganic compounds. NPK and have been largely used as stimulators. NPK is a water-soluble fertilizercomposed by monoammonium phosphate (NH4)3PO4, ammonium sulfate (NH4)2SO4, potassium chloride (KCl) and cotton bran. OSMOCOTE is also a soluble fertilizer and has the same composition, being different for being of slow release type, where inorganic nutrients remain covered by hydrophobic materials like paraffin or a vegetable.
This study was developed with the objective to evaluate the degradation of saturated hydrocarbons through the biostimulation technique in mangrove sediment, testing the potentiality of two fertilizers (NPK and OSMOCOTE) as accelerating agents of the biodegradation of petroleum components under experimental conditions.
2. Model Development
2.1. Sampling
The site for collection of mangrove substratum samples was in a contaminated area of a mangrove forest localized in the Todos os Santos Bay, municipality of São Francisco do Conde, Bahia, Brazil. Sediment collection was made on September 4, 2008. A number of 72 sediment samples were collected with the help of a 30 cm corer. Right after, samples were homogenized in a metal recipient with the purpose of avoiding analytical mistakes. After being homogenized, sediment was divided into three portions: 1st portion was kept as a natural composition of sediment (reference); 2nd portion was added with NPK fertilizer (0.5 g for each kg sediment); and a 3rd portion was added with OSMOCOTE fertilizer (0.5 g for each kg sediment).
2.2. Experiment Mounting Methodology
The experiment was mounted in glass cubes (aquariums) being 50 cm high, 30 cm wide and 40 cm long, each one containing: eight (08) glass tubes; wooden support for the tubes; a tap at the bottom part for draining the water and a pump for aeration. Glass tubes were covered with cotton bags. In total nine simulation units were mounted: units 1, 2 and 3 were reference samples (control); units 4, 5 and 6 were the samples which contained NPK (bioremediation 1); units 7, 8 and 9 were the samples which contained OSMOCOTE (bioremediation 2). In the reference units, it was evaluated the action of petroleum natural intemperism, and in bioremediation units 1 and 2, it was verified the acceleration of petroleum biodegradation as a result of the application of nutrients NPK and OSMOCOTE, respectively. Simulation units (glass cubes) were placed on the simulation bench, and on them oxygenation pumps were installed, being two pumps for each aquarium.
2.3. Simulation Methodologies
Water to simulate high tide at simulation units, with the purpose to reproduce what occurs in natural environment was pumped directly from São Paulo River estuary, Bahia State, and stored in a 1000 L tank and it was renewed everyday of simulation. A simulation day had the following steps: turning on the tap system with a small outlet in order to simulate high tide from the water stored tank; after reaching the aquarium limit (22 L), all oxygenation pumps were turned on and counted two hours of simulation; afterwards, physical and chemical parameters (salinity, OD, pH, EH and temperature) were measured; finally, aquariums were emptied, also with a small outlet for the simulation of low tide in the simulation units. Aquariums were not totally emptied with the objective to keep the sediment always in contact with water.
2.4. Sampling Methodology
Sediment sampling of simulation units was made with intervals of one, 30, 60 and 90 days and for this research the following parameters were determined: saturated hydrocarbons, ammonia ( ), nitrate (
 ) and phosphorus (P). Were also analyzed for microbiological and toxicological, and the results are part of a parallel to this work. Samples collected during the experiment period were taken out after two hours of simulation. Afterwards each sample was individually homogenized on a stainless steel recipient, so that for each aquarium triplicate there was a different recipient with the purpose to avoid mixture among reference aquariums, NPK and OSMOCOTE samples. Samples for the analysis of saturated hydrocarbons, ammonia (
 ), nitrate (
 ) and phosphorrus (P) were collected into glass recipients. All samples were placed into thermal boxes under low temperature.
2.5. Monitoring of Simulation Units
During the three months of simulation, units were daily monitored. Non-conservative physical and chemical parameters (pH, salinity, temperature, dissolved oxygen) were measured when the water reached the aquarium and after two simulation hours with the help of high precision equipments.
2.6. Analytical Procedures
1) Sample Processing of Sediments. After collection, sediments samples were lyophilized by a LIOTOP Lyophilizer L101 with the purpose to take all humidity out. Next, sample was smashed, disaggregated and sieved with a 2 mm tight sieve. 2) Determination of nutrients. Following analyses were made: total organic carbon, nitrate, ammonia and assimilable phosphorus. Determinations of total nitrogen, nitrate and ammonia were made according to Kjeldahl method by humid via [11]. Assimilable phosphorus was extracted according to Aspila et al. (1976) [12] method and determined by Grasshoff
(1983) [13]. 3) Determination of Total Petroleum Hydrocarbons (TPH). Saturated hydrocarbons were determined according to USEPA 8015B method. In order to make the extraction, 10 g of sediment were weighed on a Soxhlet system and the extraction proceeded with 150 mL of a mixture of solvents n-hexane and acetone (1:1 v/v) for four (4) hours. As follows, the extract volume was put to evaporate in chapel and afterwards weighed about 0.004 g of this final extract (without solvent) which was then mixed with alumina. The mixture was transferred to the clean up column where the saturated fractions (F1) were added with hexane (30 mL). After evaporation, recipients were weighed on an analytical balance and masses were noted. In order to quantify both lineal and branched nalkanes, it was firstly prepared a solution of 0.02 mg/mL concentration of α-androstane chromatographic pattern. For pattern preparation a mass of maximum about 0.0027 g α-androstane was weighed and was transferred to a 5 mL volumetric balloon with the help of n-hexane solvent. Saturated fractions were diluted into a 1 mL solution of internal pattern and after homogenization, an aliquote of 1 μL to be injected manually into gas chromatographer Hewlett Packard, model 6890 with flame ionization detector (FID) with synthetic air, H2 and N2 with flame gases, capillary column 0f melted silicate (HP-5, 30 m × 0.32 mm × 0.25 μm), gas flow (H2): 2.2 mL/min, injector temperature 280˚C, detector temperature 340˚C, with initial temperature of 40˚C and final temperature of 320˚C with 2.5˚C/min rate, running time of 130 minutes.
3. Results and Discussion
3.1. Evaluation of Physical and Chemical Parameters (pH, Temperature, OD, Salinity)
For the evaluation of physical and chemical parameters the following calculations were made: an average out of the triplicates (for each experiment), general average, pattern deviation and variation coefficient (Table 1).
Turkey Test was also applied to check if there were significant differences from the first day of experiment in relation to all the other collection days. For all results, measured parameters showed that samples were not significantly different, proving that during the whole experiment there were no great variations which would compromise the biostimulation process (Table 1).
3.2. Evaluation of Nutrients (Ammonia ( ), Nitrate (
 ) and Phosphorus (P)
Following nutrients were monitored during the experiment: contents of ions phosphorus, ammonia and nitrate, in sediment samples extracted from glass tubes of all simulation units, during the intervals of 1, 30, 60 and 90 days. Sample utilized as background is a product of ho
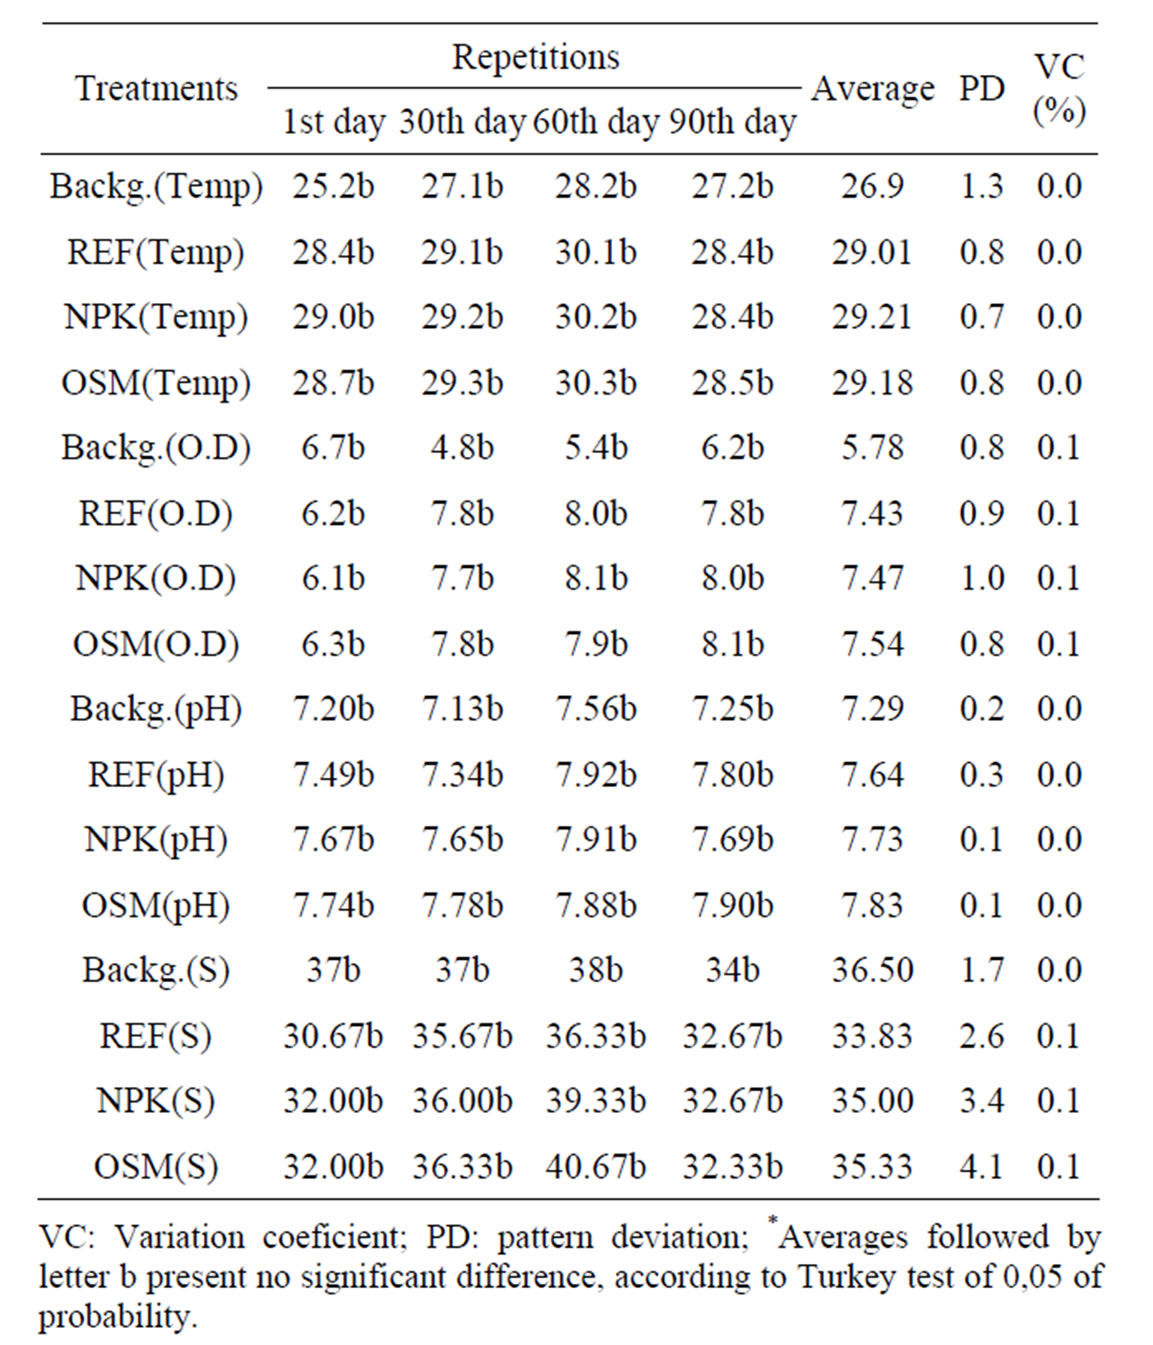
Table 1. Variation of physical and chemical parameters on the 1st, 30th, 60th and 90th days of experiment at reference simulation units (REF)*.
mogenization of all collected samples and represents a supposedly pattern sample of this contaminated substratum. Average phosphorus, ammonia and nitrate levels for background sample was 29.03 mg·kg–1, 2.03 mg N- kg–1 e 2.01 mg N-
 kg–1, respectively, very close to those values found in reference simulation units on the first day of experiment (Tables 1 and 2). Phosphorus average concentrations at reference units varied between 18.24 and 31.61 mg·kg–1 (Table 2).
Figure 1(a) shows that phosphorus contents at reference units behaved in a similar way during the whole experiment, having had a decrease on 90th day. Concentrations for ammonia values of reference simulation units varied between 3.38 and 22.08 mg N- kg–1 (Table 2). Figure 1(a) shows a variation of phosphorus, ammonia and nitrate from the 1st, 30th, 60th and 90th days of experiment at REFERENCE (REF) simulation units, where it can be observed that ammonia contents at reference units had an increase on the 30th day, decreasing on the 60th day and having a slight increase on the 90th day. The increase of nutrient contents favored the growth of microbial population responsible for oil biodegradation contained in the environment.
Contents for nitrate ions from reference units varied along the experiment between 3.66 and 23.48 mg N- kg–1 (Table 2). In Figure 1(a), it may be ob-
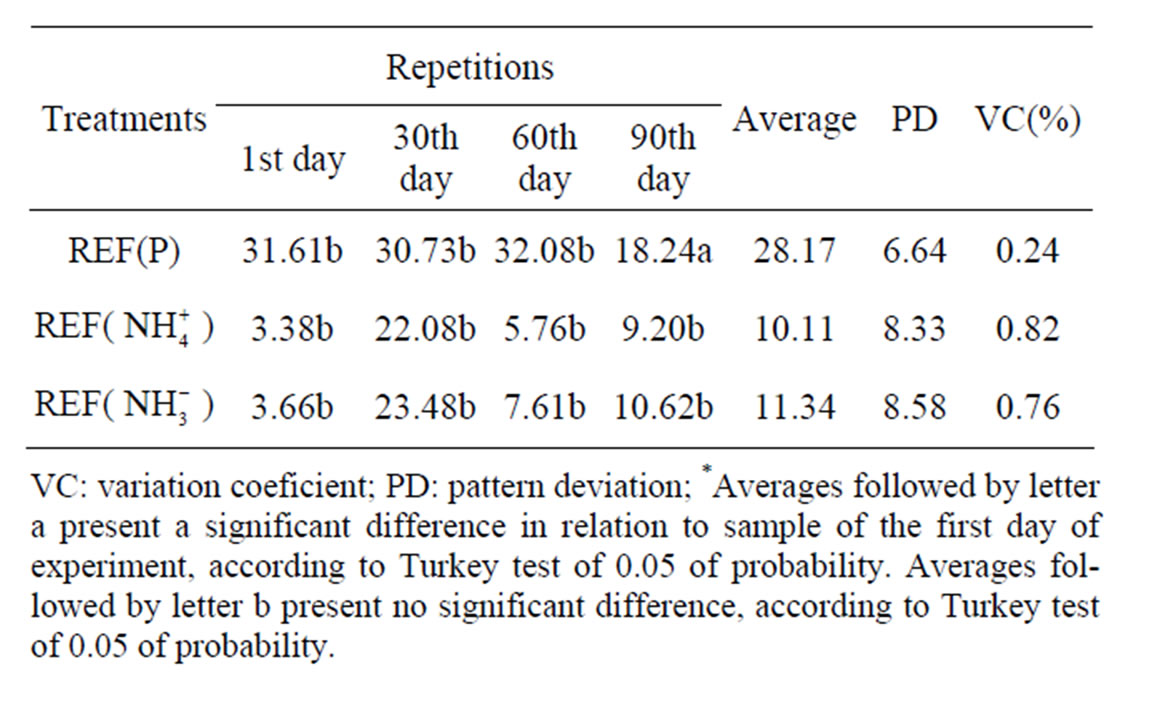
Table 2. Nutrient contents on the 1st, 30th, 60th and 90th days of experiment at reference simulation units (REF).
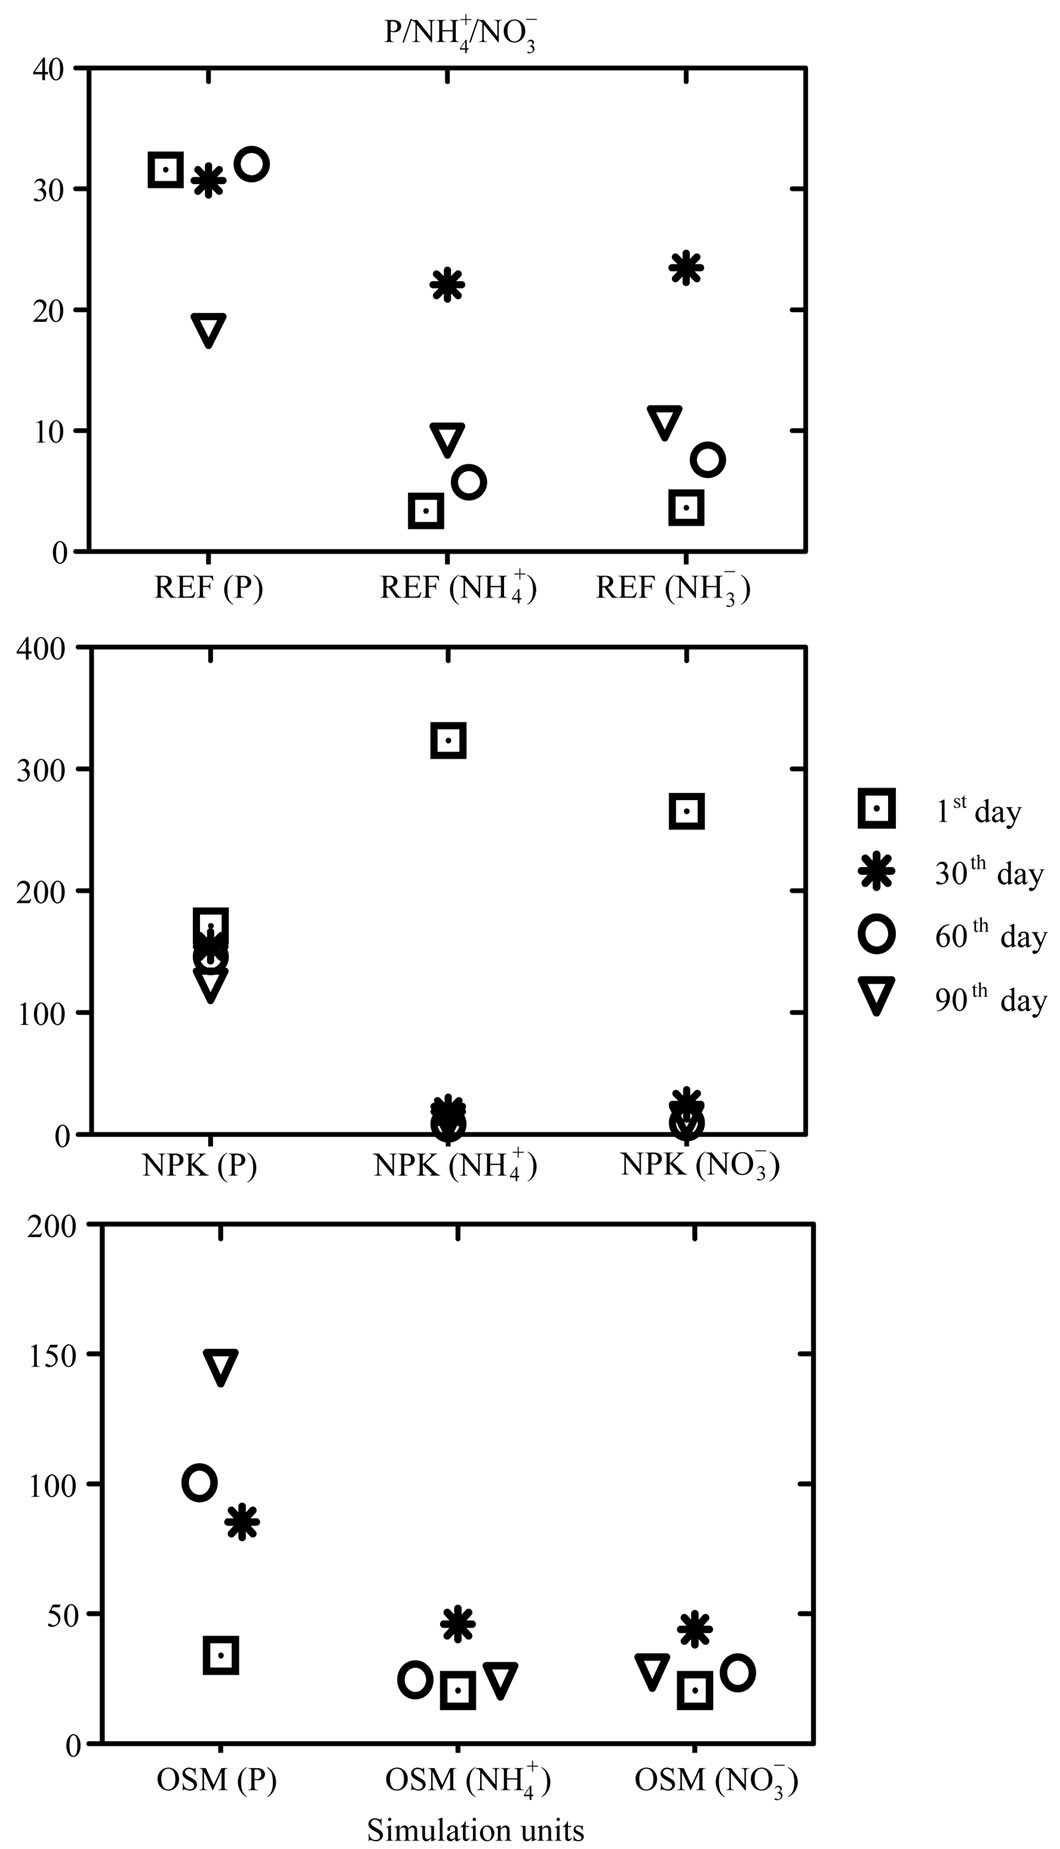
Figure 1. Graphic with variation of phosphorus, ammonia and nitrate contents on the 1st, 30th, 60th and 90th days of experiment at REFERENCE (REF) simulation units(a), simulation units com NPK (b) and simulation units com OSMOCOTE (OSM)(c).
served that nitrate contents from reference units had a be havior similar to the nutrient ammonia. Comparing nutrient contents found in background sample and samples from reference units, it may be observed that there is heterogeneity among the samples, for theoretically these samples should contain the same nutrient concentrations.
In Table 3 it may be observed nutrient contents from simulation units, where NPK has been added. Phosphorus concentrations varied from 122.01 to 171.41 mg·kg–1.
Phosphorus contents, during the whole experiment, were higher than the ones taken at the other similar units, presenting a drop on the 60th and 90th days of experiment. This fact may be justified for NPK is very soluble and by the time that tide was simulated it is possible that these nutrients have been utilized by microorganisms as energy source for their metabolism.
Low phosphorus contents have been found along the experiment, because microorganisms consume it rapidly at the beginning of biodegradation [10]. That was not observed in this present experiment. Phosphorus values kept high levels during the whole experiment, from which it may be inferred by the oil degradation stage, from where it was not possible to detect the low molecular weight hydrocarbons, which are the first ones to be degraded. Ammonia contents at units with NPK obtained higher values on the first days of experiment, decreasing drastically from the 30th day of experiment on (Figure 1(b)).
Concentrations varied between 8.80 and 323.51 mg N- kg–1 (Table 3). Ammonia consumption may be related to the incorporation into microbial biomass in the biodegradation process [10] (Vallejo et al., 2005). Nitrate contents at unit where NPK was added obtained the highest values on the first days of experiment, dropping from the 30th day of experiment on, varying between 9.73 and 265.55 mg N-
 kg–1 (Table 3). This drop may be related to nitrate solubilization, which is higher in this type of fertilizer and as a consequence it is more rapidly assimilated by the degrading microorganisms [10] (Vallejo et al., 2005).
Units with OSMOCOTE only presented higher values from the 30th day on, but when compared to aquariums with NPK, phosphorus contents are lower, and this fact may be justified by the type of liberation (slow), typical for this fertilizer. Phosphorus contents at these units varied between 34.03 and 144.61 mg·kg–1 (Table 4). At simulation units with OSMOCOTE, ammonia contents increased gradually until the 30th day of experiment, having a drop on the 60th day of experiment (Figure 1(c)). Nitrate low concentration in relation to ammonia concentrations suggests that it is the main nitrogen source in this experiment [10]. Nitrate contents at units with OSMOCOTE varied between 20.56 and 44.10 mg N- kg–1 (Table 4). Results found corroborate the idea of some authors that in open systems there may be deficiency in nutrient contents which may result in the biodegradation process inhibition [14-16]. Therefore there
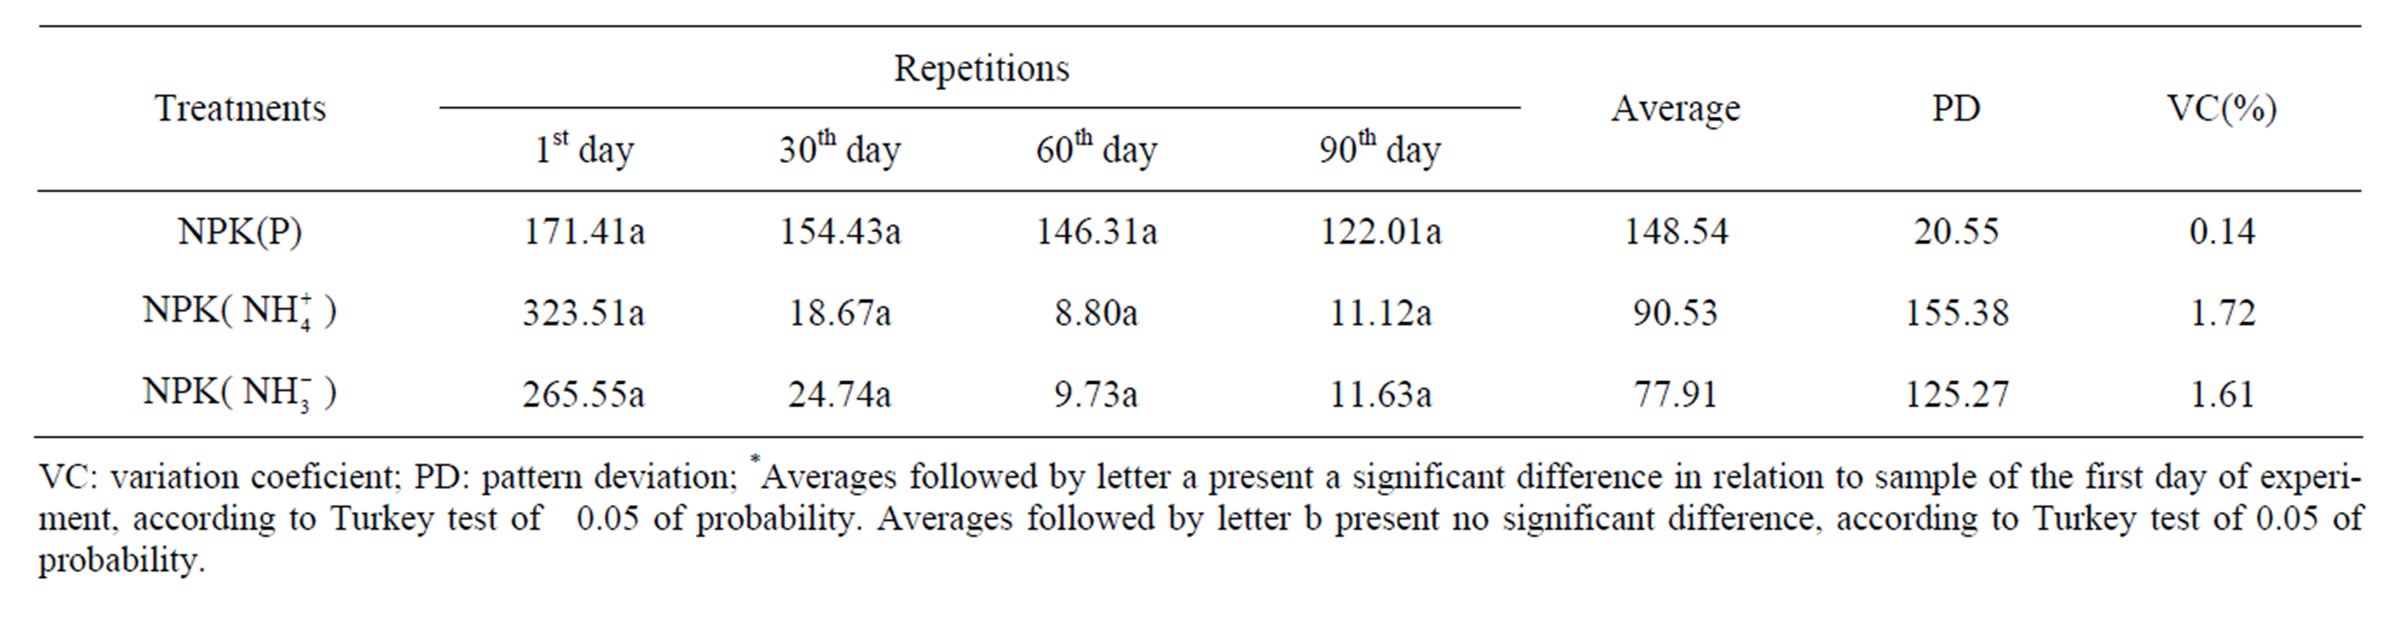
Table 3. Nutrient contents on the 1st, 30th, 60th and 90th days of experiment at NPK simulation units*.
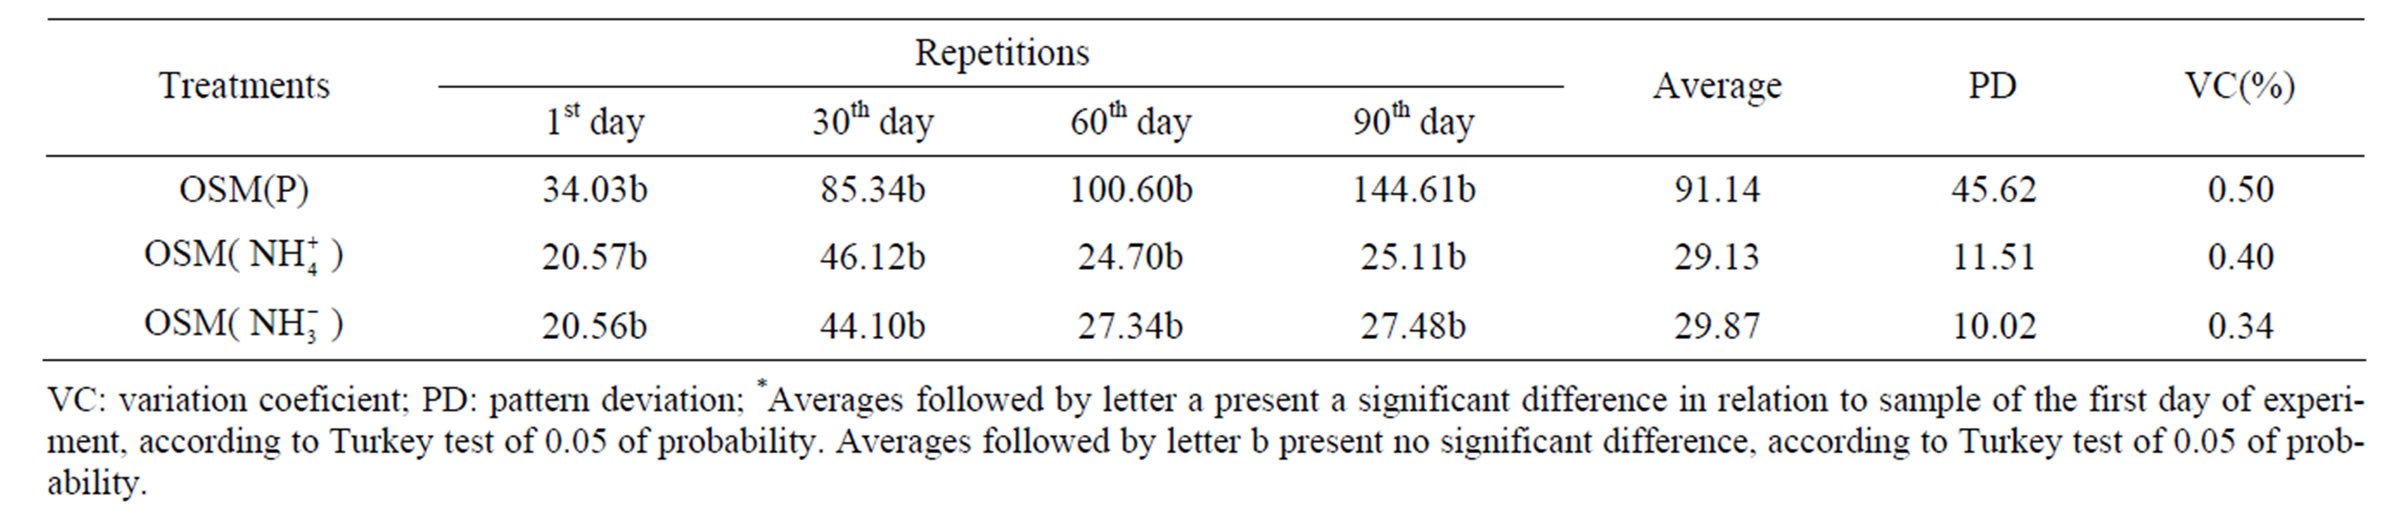
Table 4. Nutrient contents on the 1st, 30th, 60th and 90th days of experiment at OSMOCOTE (OSM) simulation units*.
is the necessity of the addition of nutrients, which might increase degradation speed.
Phosphorus was the only nutrient which kept along the whole experiment being liberated uniformly either at the units with NPK or at the units with OSMOCOTE. Nutrients in certain coastal environments are scarce and the absence mainly of bioavailable phosphorus may provoke a reduction of microbial population, thus turning difficult the oil degradation process [3,17].
That nitrogen and phosphorus concentrations severely limit degradation extension of hydrocarbons and that the addition of nitrogen and phosphorus may be used to stimulate hydrocarbon microbial degradation [18].
For this evaluation it was also applied the Turkey test. In reference units there was no significant difference among samples, except for the phosphorus contents of the 1st day in relation to the 90th day of experiment. This similarity along the experiment, in nutrient concentrations, may be justified for being natural samples, where nutrient quantities do not vary much among themselves, what generally occurs in mangrove natural environment. The test applied for units with NPK show significant differences among the samples of the 1st day in relation to the other days of experiment with 0.05 of probability. This may be justified by the addition of NPK fertilizer, which is soluble, having a significant increase of these nutrients, with a drop at the end of the experiment. The test applied in samples of the units with OSMOCOTE was not significantly different, what may be attributed to the type of fertilizer, which is of slow liberation, then the experiment time was possibly not significant for such an observation (Tables 2-4).
3.3. Liquid Chromatography Evaluation
Results for liquid chromatography of the background sample collected in the beginning of experiment presented a greater quantity of saturated hydrocarbons, followed by aromatic hydrocarbons and a smaller quantity of NSO compounds (Figure 2). The biodegraded oils present a decrease in saturated hydrocarbon values and consequently an increase of NSO compounds [19]. Oils of paraffin type, like the one found in the substratum of this mangrove present a greater quantity of saturated hydrocarbons [20].
Probably with the biodegradation process these variations revert, classifying the contaminant as biodegraded. Results of oil extract analyses extracted from reference simulation units, in its great majority show that there was a reduction in the relative concentration of the fraction of saturated hydrocarbons, followed by a relative reduction, less expressive, of the aromatic hydrocarbons, compensated by a relative increase in the fraction of polar compounds (NSO) (Figure 2).
The results found by the present work prove the order of the biodegradation scale proposed by some authors, like The saturated hydrocarbons are the most susceptible ones to microbial degradation, while the NSO are the most persistent ones [21]. Some averages presented an increase in the percentage of saturated hydrocarbons, which may be justified by the heterogeneity among samples, The explanation for these results can be given by the sampling method applied to the substrate of the wetland, that is, brought to homogenize the samples so they could be treated equally by the process of bioremediation.
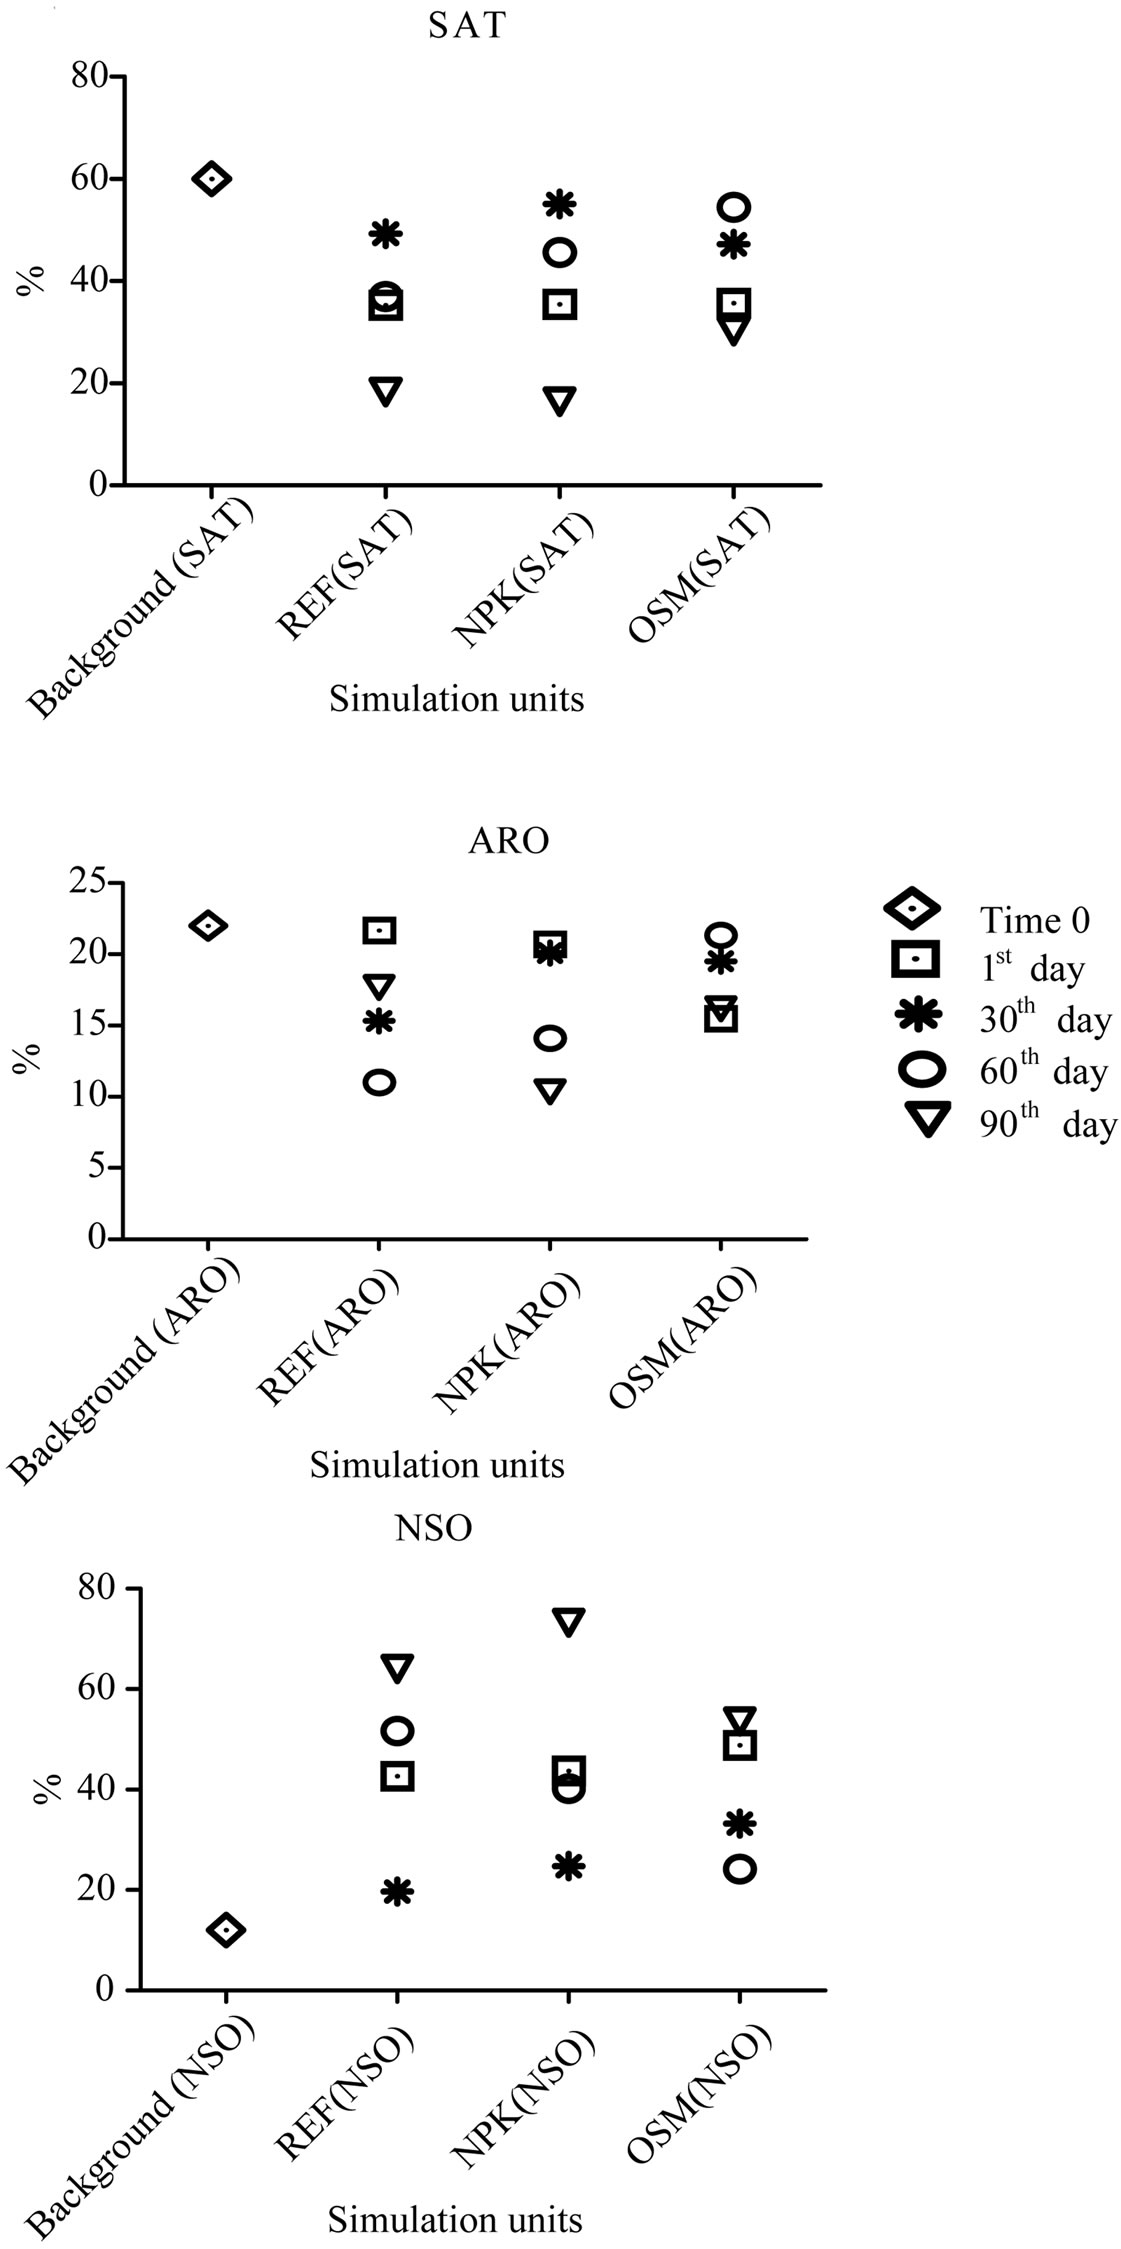
Figure 2. Graphic representing in percentages saturated (SAT), aromatical (ARO) and NSO hydrocarbon contents at simulation units along the experiment (1st, 30th, 60th and 90th days) of bioremediation in mangrove sediments of o São Paulo river estuary.
However, for some reason, the homogenization was not complete and the samples had different oil content and at the same time with different levels of biodegradation when they were placed in test tubes, which resulted in different results of liquid chromatography, with virtually no response the bioremediation process by biostimulation. This heterogeneity may be proved by the comparison of values found in background samples with the ones found in samples of the 1st day of experiment, which should theoretically present the same contents, since the objective of homogenization of the collected substratum was to obtain a pattern sample (Figure 2).
In simulation units, with NPK, liquid chromatography results showed, with very different values, similar to the reference tanks, with a reduction after 90 days, of saturated hydrocarbons. These results may also be also a sampling of products that do not fully homogenized samples, resulting in different values demonstrating the heterogeneity of the same (Figure 2). A preferencial reducetion of saturated hydrocarbons by the microbial community has already been predicted by many different authors through laboratorial simulations and analysis of oil spills on coastal environments [22-24]. Simulation units with NPK presented the most expressive reduction of saturated hydrocarbons by the end of the experiment, showing to be more efficient when compared to the reference units (Figure 2). The addition of nutrients through biostimulation process is necessary for the microorganisms to accelerate oil natural biodegradation process [25]. This acceleration is directly related to the population increase of microorganisms present in the contaminated environment, which utilize the hydrocarbons as energy source. Likewise, the reduction of aromatic hydrocarbon contents was greater at the units with NPK, when compared to the reference units.
Simulation unit samples, in which OSMOCOTE fertilizer was added to the substratum, showed the same degradation tendency of hydrocarbons, with an increase of NSO compounds (Figure 2). In comparison to the results already presented by the other simulation units, the unit which contains OSMOCOTE had similar tendency of the reference unit, showing its less efficiency in comparison to the NPK fertilizer. This may be attributed to the fact that OSMOCOTE, for being involved in a capsule, slowly liberates nutrients, having the need of some longer time for reaching the ideal levels to accelerate biodegradation. On the contrary of NPK, which, for being of soluble type, dilutes easily, reaching ideal levels to accelerate the process more rapidly. Thus, it is necessary the control of the contents of phosphorus, ammonia and nitrate within a shorter interval of time to know exactly at which intervals the units treated with NPK and OSMOCOTE reach the ideal levels necessary to accelerate the degradation process, and if it really reached this level. Although the utilization of fertilizers with slow liberation has been appointed by some authors [26,27] as a possibility to provide continuous source of nutrients for contaminated areas and having demonstrated some betterments in oil biodegradation, the biggest problem is the long time period necessary for reaching the concentration of nutrients, necessary for biodegradation to occur.
3.4. Gas Chromatograghy Evaluation
One of the most used parameters for the monitoring of the biodegradation saturated hydrocarbons is the distribution of n-alkanes. These compounds are normally represented by greater peaks registered on a chromatogram. However, when oil is in a biodegradation process, a reduction of these compounds (n-alkanes) occurs, altering the chromatographic profile. 1) Background. On the organic extract chromatogram of the substratum sample, considered as background, it may be observed the absence of low molecular weight n-alkanes, which may have been evaporated, possibly right after the spill. The other n-alkanes, of high molecular weight, besides the evaporation process, must have also been degraded by natural bioremediation (Figure 3).
Authors affirm that on the first days of a spill, evaporation is responsible for the retreat of 40% to 70% of volatile hydrocarbons, for average and light oils, which was also verified by Souza in an experiment with sea water [28-30]. It may be noticed by Figure 3 chromatogram, that some peaks are still showing a homologous series of the highest molecular weight n-alkanes, but with very low values of relative abundance, due to peak hights.
The absence of n-alkanes and the base line elevation (hump) are parameters which prove that the oil found in the substratum is already into a degradation stage. The predominant presence of UCM (complex mixture of oil components non-resolved by gas chromatography), in relation to n-alkanes, is associated to their complete reduction, due to the biodegradation process action [25]. 2) Reference Simulation Units. Reference samples 1, 2 and 3 identified on the first day of experiment (Figure 4(a)) presented fingerprints (chromatographic profile) similar to the substratum pattern sample. This same fingerprint repeats itself practically in all reference samples collected during the experiment. On all these chromatograms may be observed the absence of low molecular weight n-alkanes and isoprenoids, an elevation on the base line (UCM) with the presence of n-alkanes of highest molecular weight, just like the one found on background substratum chromatographic profile, although it presents higher peaks.
Nascimento, in an experiment, simulating oil spill in a Rio das Ostras mangrove, Rio de Janeiro, in sediment samples, verified that after 56 days it was not possible to identify the n-alcanes in the control simulation units anymore, where it was observed natural degradation [31]. This may confirm the absence of n-alkanes and isoprenoids on the first days of experiment, since for the test a substratum was utilized that was already contaminated for some time and that probably must have suffered the action of intemperic processes, mainly evaporation. As it may be observed on Figures 4(b)-(d) referring to the 30th, 60th and 90th days of experiment, samples present, besides the reduction of peaks, the absence of some high molecular weight n-alkanes identified on the first days of experiment. Results of reference units, in general,
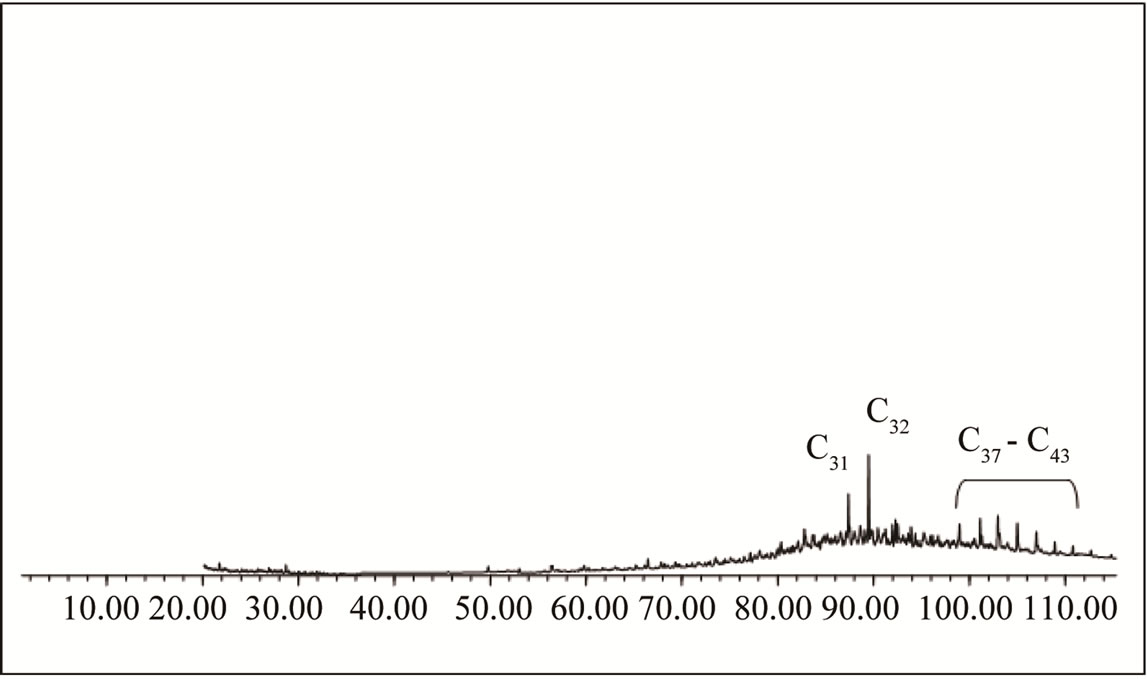
Figure 3. Chromatogram of saturated hydrocarbons of mangrove substratum background sample of the São Paulo river estuary.
suggest the occurrence of natural biodegradation. However, natural biodegradation is considered as a slow process. This way, bioremediation, which is the biodegradetion acceleration, may give a response more rapidly and necessary to the environment. Thus, in cases of great spills, the natural attenuation would not be adequate, since the necessary time to occur the oil biodegradation would be a lot longer, bringing great damages to the affected ecosystem. 3) NPK Simulation Units. Chromatographic profiles of the first day of experiment, for the NPK unit samples (Figure 5(a)), present small variations.
On chromatograms of the 30th, 60th and 90th days of experiment, for the samples of units with NPK (Figures 5(b)-(d)), it may be observed besides the peak reduction, the absence of high molecular weight n-alkanes. Studies made by Atlas and Bartha revealed that the individual addition of nitrate or phosphate caused little betterment to biodegradation stage, but when added altogether, like it has been made in this experiment, they increased petroleum biodegradation and mineralization of 70% and 42%, respectively [33].
These profiles are very much alike the ones found at reference units, with the absence of low molecular weight n-alkanes and the presence of high molecular weight n-alkanes, confirming that the oil extracted from the substratum is already into biodegradation process. Studies made by Souza, Rosa and Trigüis show that bioremediation with the utilization of NPK fertilizer showed to be efficient in the complete degradation of both normal and branched alkanes in sea water [30-32]. Some authors report that biodegradation rate is similar for both water and sediment. Nascimento observed that around the 7th day of experiment it was already possible to identify the presence of n-alkanes and isoprenóides [31].
Degradation decrease of hydrocarbons on the 90th day may be related to deficiency of nutrients since it has been already observed a reduction of nutrient concentrations on this day. Bergstein and Vestal concluded that the utili-
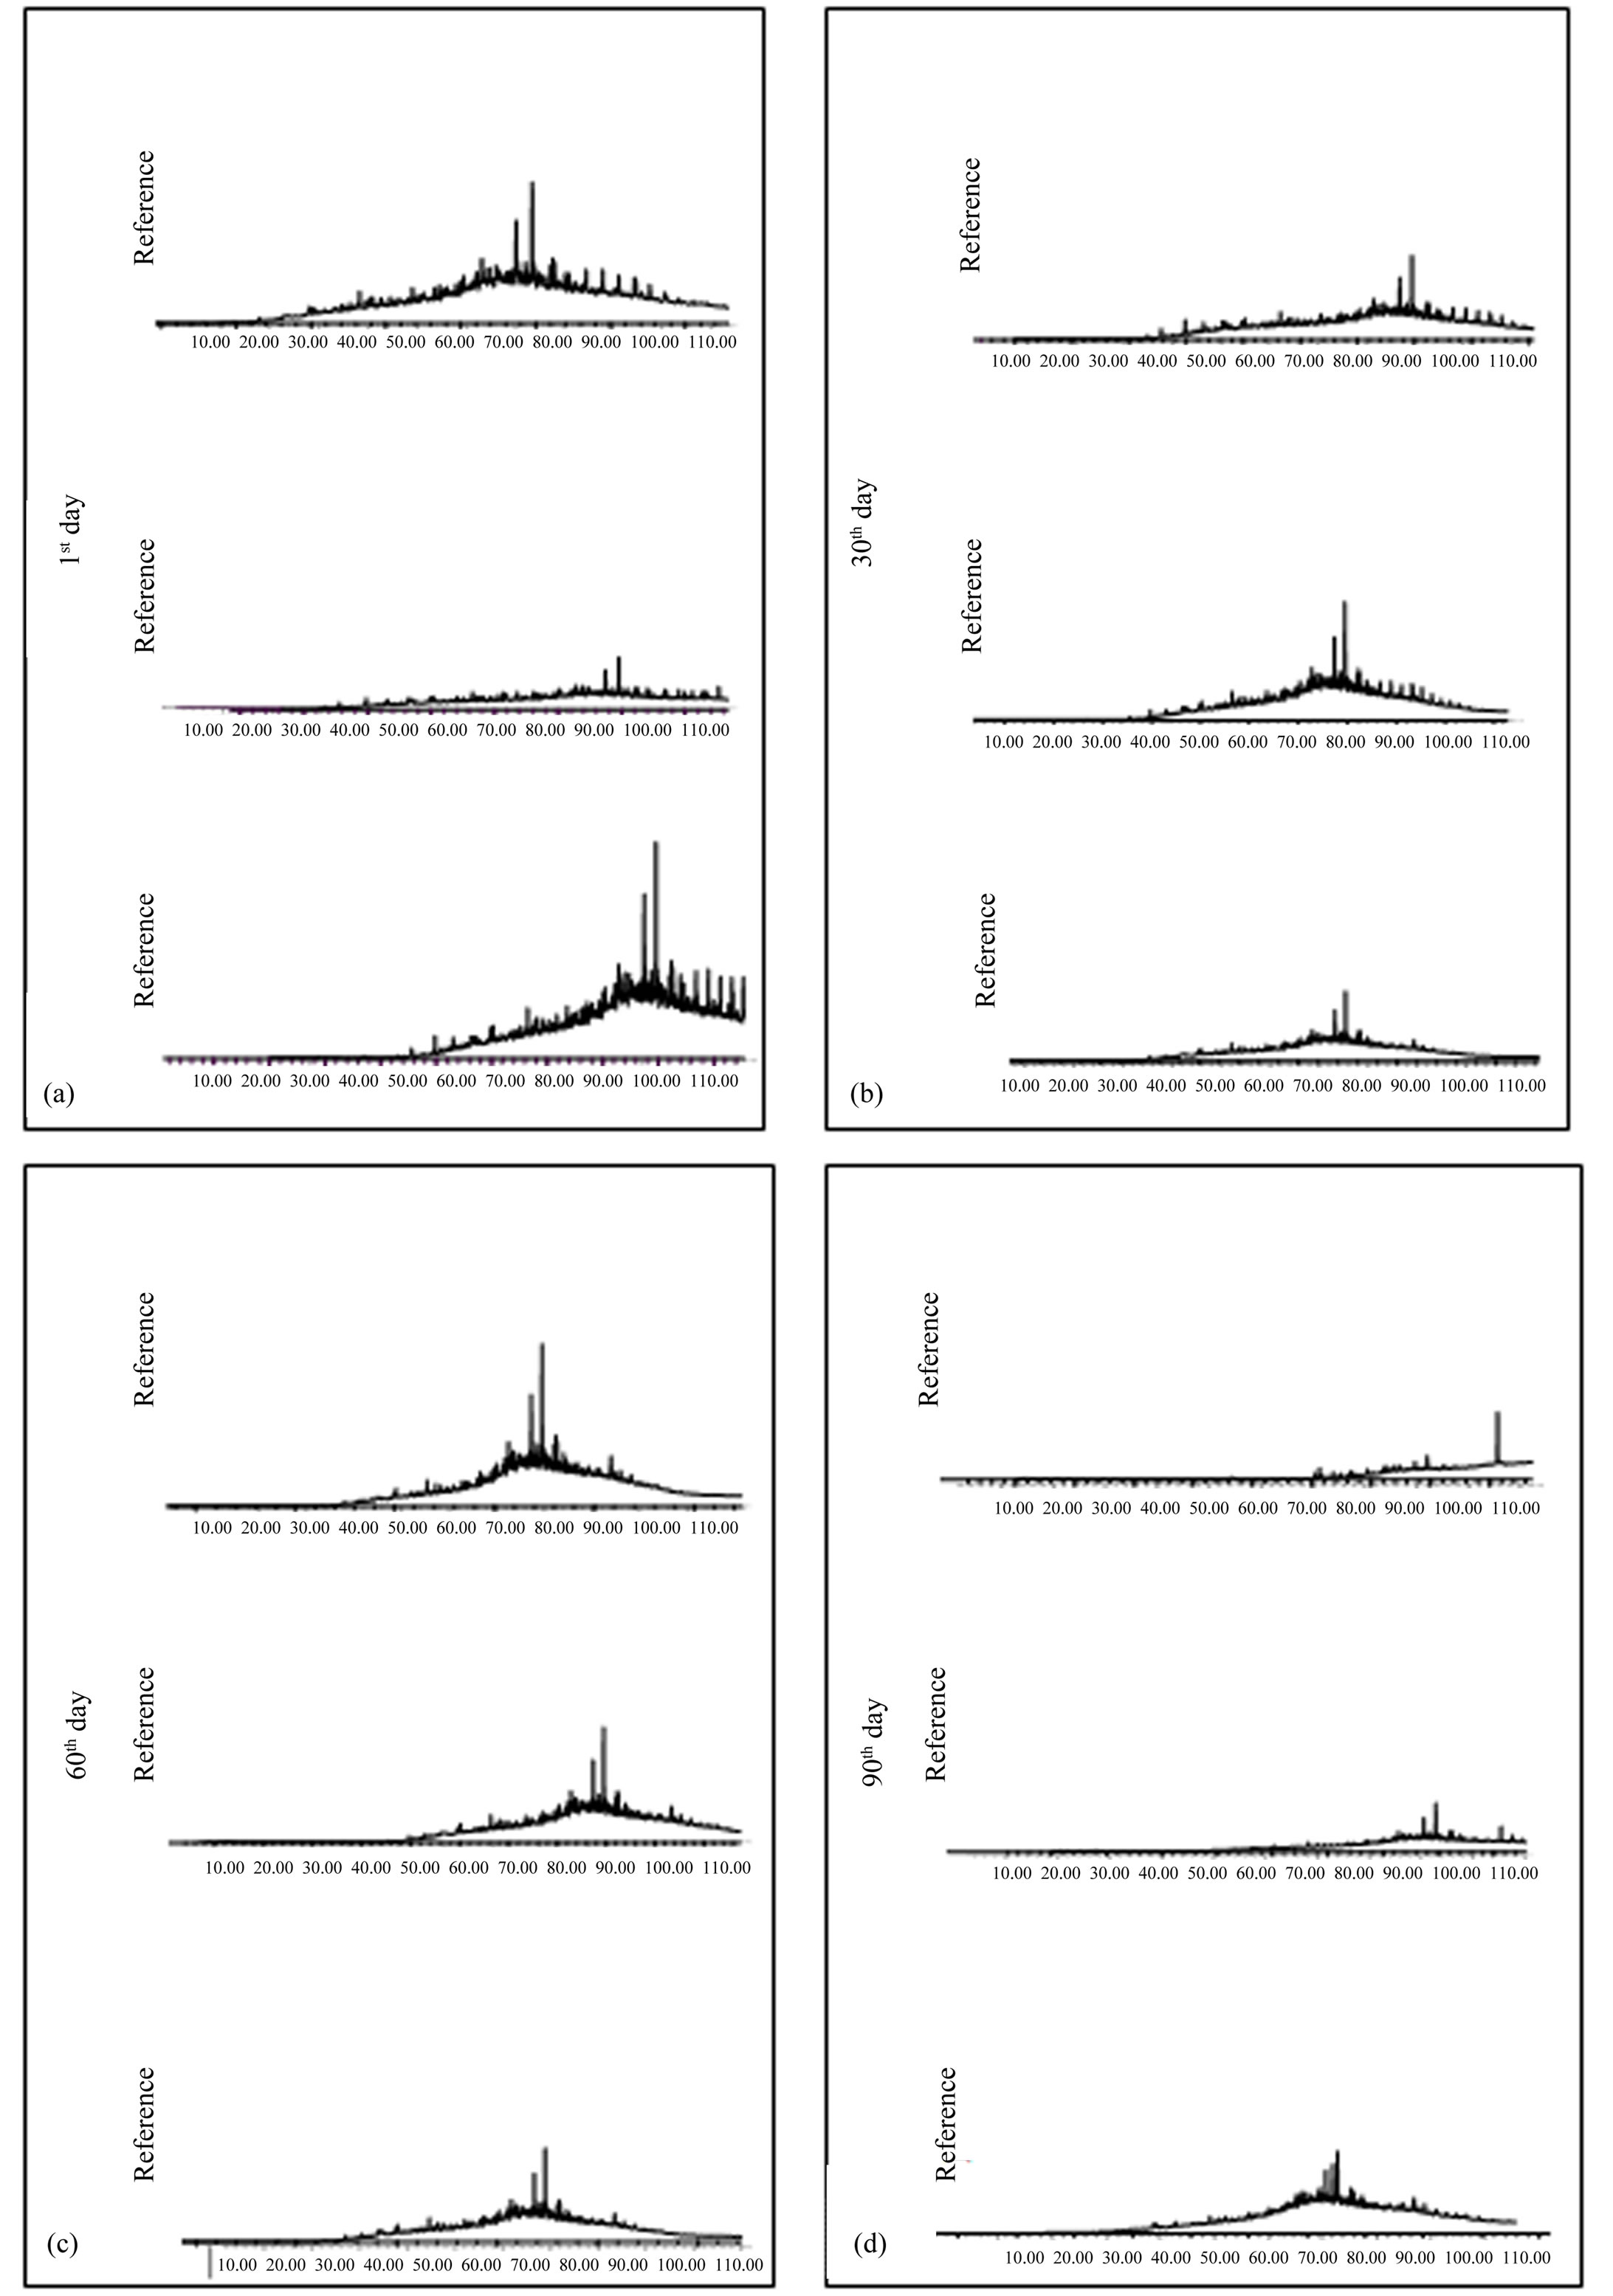
Figure 4. Saturated hydrocarbon chromatograms of samples extracted from reference units on the 1st, 30th, 60th and 90th day of bioremediation simulation experiment in mangrove sediments of São Paulo river estuary.
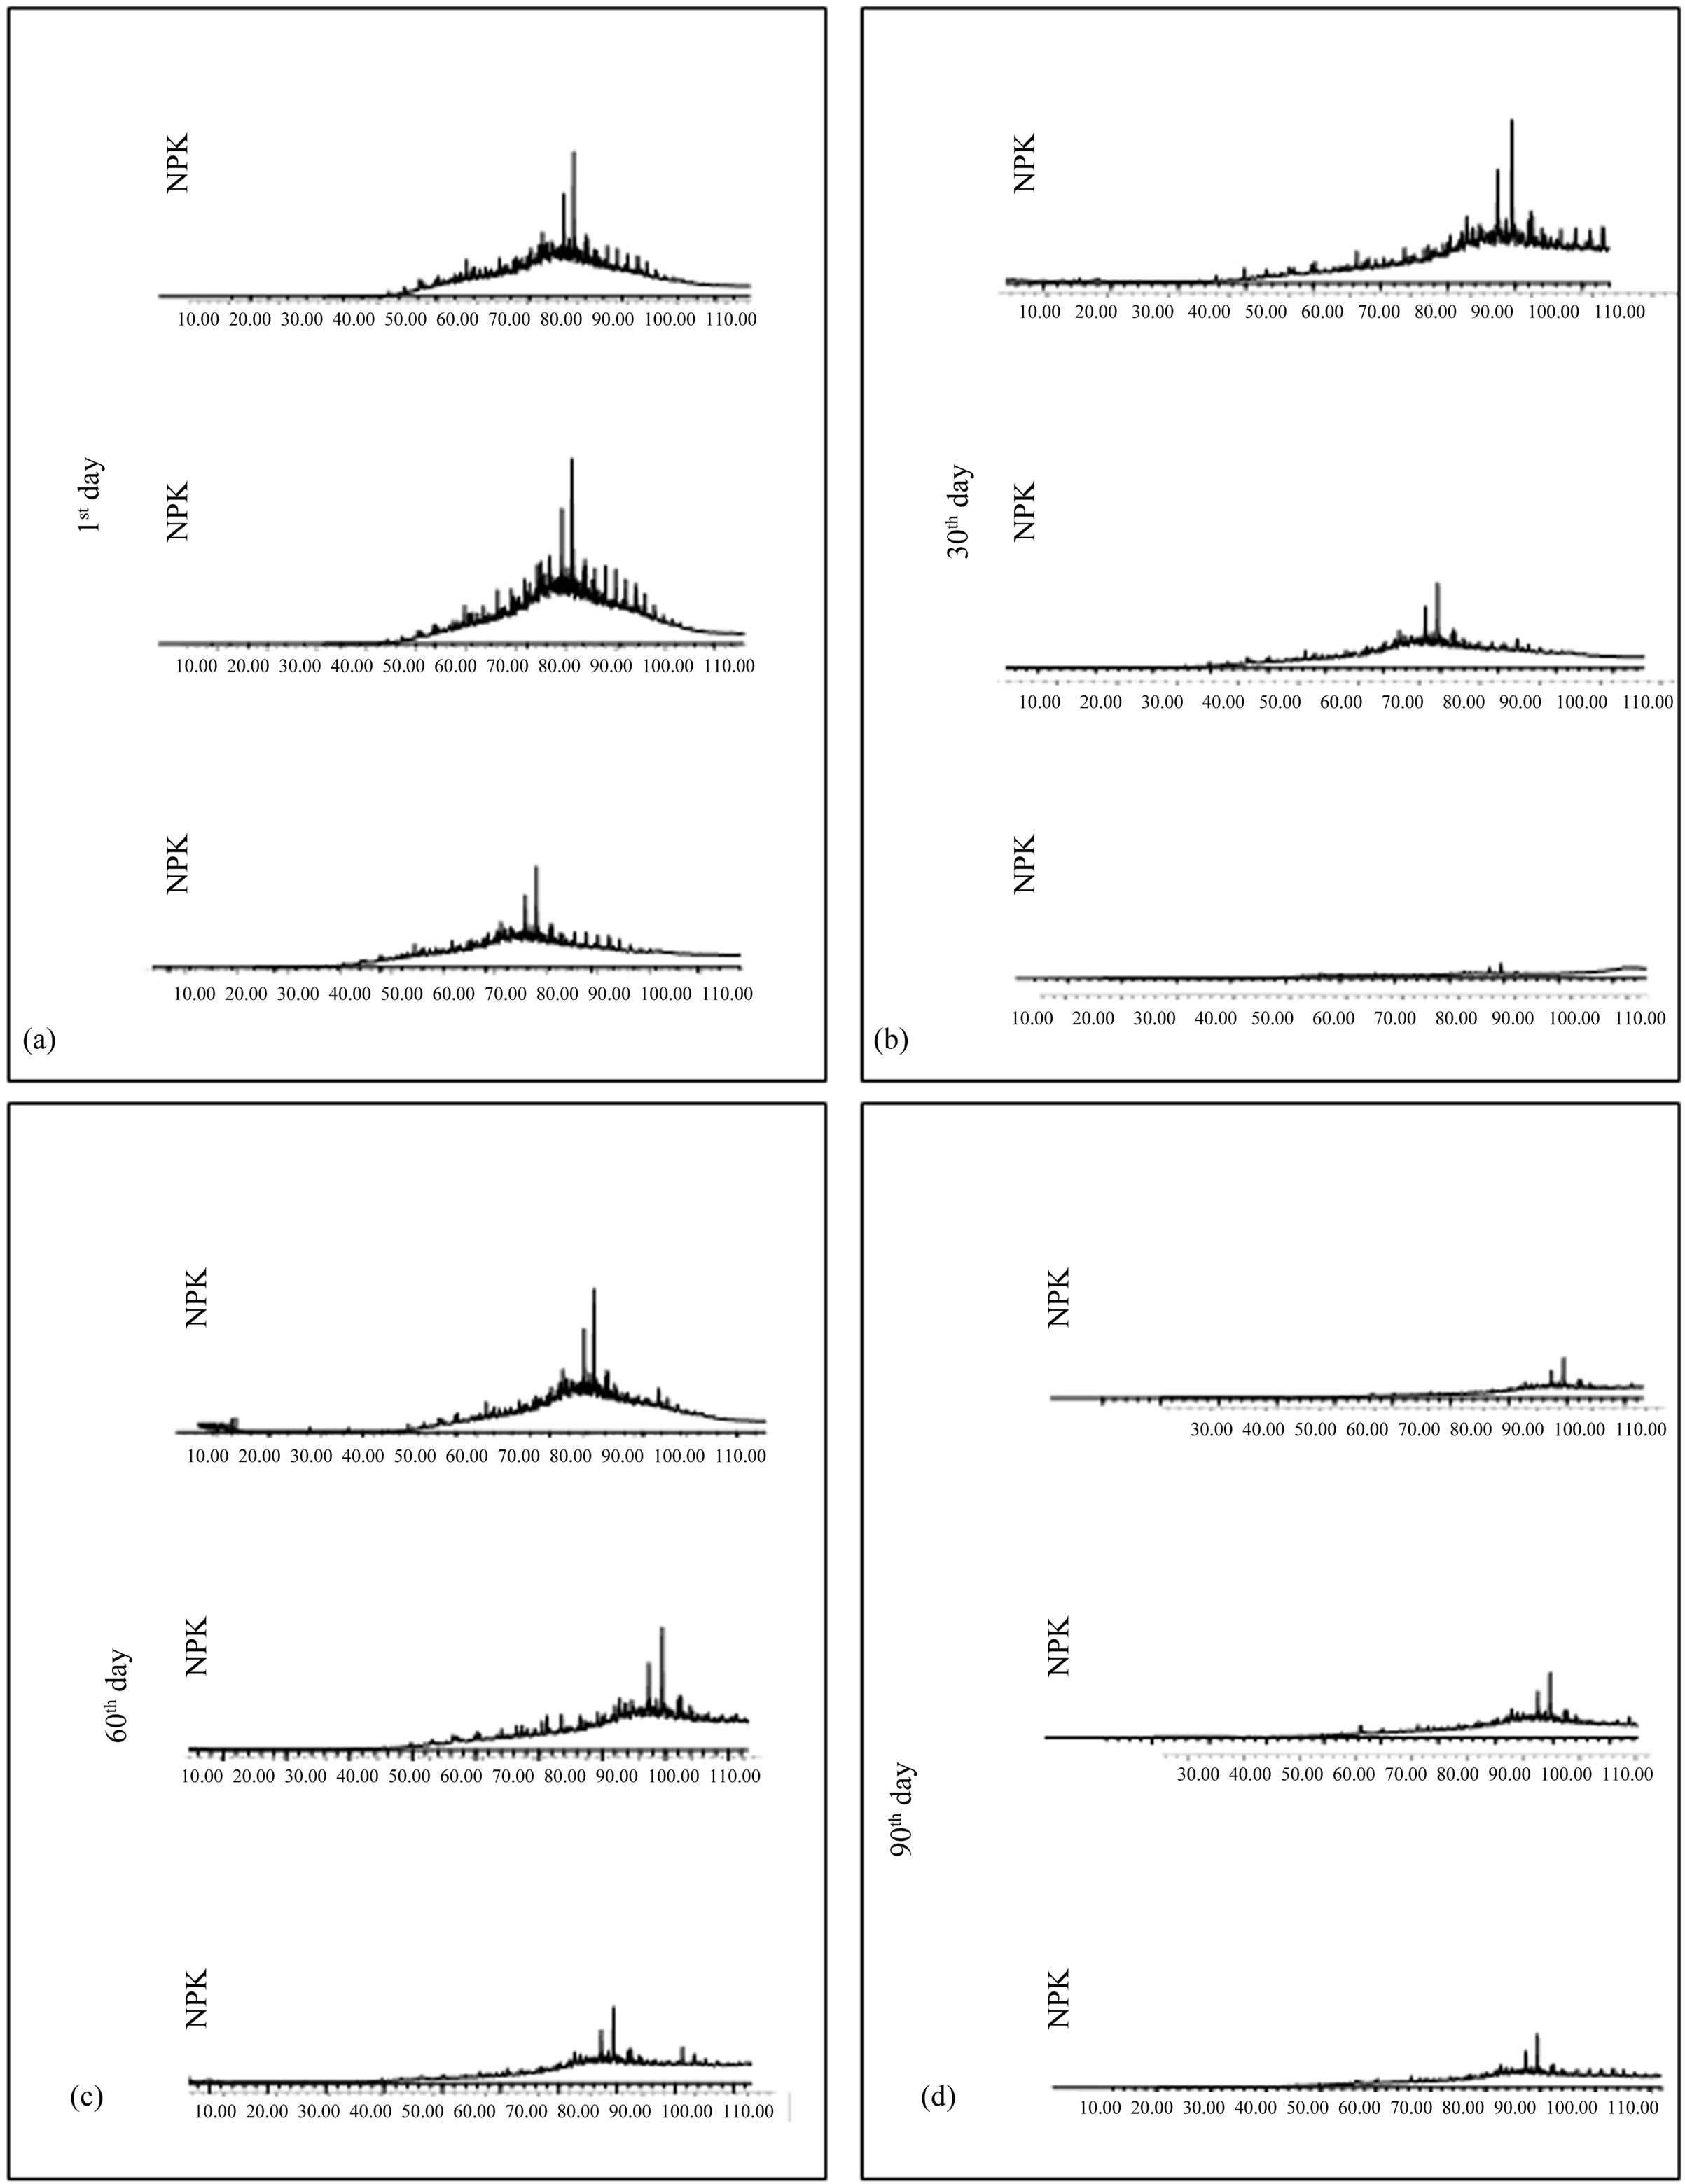
Figure 5. Saturated hydrocarbon chromatograms of samples extracted from units with NPK, on the 1st, 30th, 60th and 90th day of bioremediation simulation experiment in mangrove sediments of São Paulo river estuary.

Figure 6. Saturated hydrocarbon chromatograms of samples extracted from units with OSMOCOTE on the 1st, 30th, 60th and 90th day of bioremediation simulation experiment in mangrove sediments of São Paulo river estuary.
zation of soluble fertilizers constitutes a useful tool to increase crude biodegradation and that without the addition of nitrogen and phosphorus the biodegradation of hydrocarbons is limited [34].
4) OSMOCOTE simulation Units. The simulation units in which OSMOCOTE was added presented a variation on the chromatographic profile a little different from the ones observed on reference material and on units with NPK, since the first day of experiment (Figure 6(a)). It may be observed that the oil extracted is in a different stage with minor elevation of base line, but with absence of low molecular weight n-alkanes. Studies made by Xu, testing the utilization of OSMOCOTE fertilizer, presented a drastic increase in the microorganisms metabolic activities, accelerating the biodegradation of hydrocarbons. However, in the present experiment, a chromatographic profile (Figures 6(b)-(d)) similar to the one of the first day, suggesting that OSMOCOTE did not significantly increase degradation rate, also proved by liquid chromatography results [35].
4. Conclusions
In this period, nutrient levels were also high, when compared to the other days of experiment, probably due to non-utilization of these nutrients by the microbial community. In comparison to NPK fertilizer, OSMOCOTE showed to be less efficient than the ones presented by reference units. Even the results obtained at reference units were more efficient. This may be explained by the availability of nutrients, since OSMOCOTE liberates nutrients little by little, or perhaps the length of time has been insufficient to prove the fertilizer efficiency.
The gas chromatographic profiles obtained indicate that the simulation of bioremediation of contaminated mangrove substrate, this led to a more advanced stage of degradation, and even the complete disappearance of all the peaks present. Regarding the differences with respect to the use of either fertilizer, ie, a water soluble fertilizer and another with a slow solubility in water, apparently the soluble (NPK) gave the best results may be indicative of future uses in field of bioremediation in areas impacted by oil activities.
5. Acknowledgements
To CNPq, for the scholarship concession. To FINEP, for the financial support through convênio FINEP-FAPEX n01.05.0016.00, which allowed the making of all phases of this work. To the whole team of Núcleo de Estudos Ambientais—NEA (UFBA).
REFERENCES
- P. Y. Yeung, R. L. Johnson and J. G. Xu, “Biodegradation of Petroleum Hydrocarbons in Soil as Affected by Heating and Forced Aeration,” Journal of Environmental Quality, Vol. 26, No. 6, 1997, pp. 1511-1516. doi:10.2134/jeq1997.00472425002600060009x
- M. Vidali, “Bioremediation: An Overview,” Journal of Applied Chemistry, Vol. 73, No. 7, 2001, pp. 1163-1172. doi:10.1351/pac200173071163
- R. C. Prince, “Petroleum Spill Bioremediation in Marine Environments,” Critical Reviews in Microbiology, Vol. 19, No. 4, 1993, pp. 217-242. doi:10.3109/10408419309113530
- R. M. Atlas, “Bioremediation,” Chemical & Engineering News, Vol. 3, 1995, pp. 32-42. doi:10.1021/cen-v073n014.p032
- R. M. Atlas, “Petroleum Biodegradation and Oil Spill Bioremediation,” Marine Pollution Bulletin, Vol. 31, No. 4, 1995, pp. 178-182. doi:10.1016/0025-326X(95)00113-2
- P. H. Pritchard and C. F. Costa, “EPA’s Alaska Oil Spill Bioremediation Project,” Environmental Science & Technology, Vol. 25, No. 3, 1991, pp. 372-379. doi:10.1021/es00015a002
- EPA—Environmental Protection Agency (EUA), “Design Document for Passive Bioventing. How to Evaluate Alternative Cleanup Technologies for Underground Storage Tank Sites: A Guide for Corrective Action Plan Reviewers, 2006 (EPA 510-B-94-003; EPA 510-B-95-007; and EPA 510-R-04-002),” 2008. http://www.epa.gov/swerust1/pubs/tum_ch3.pdf
- R. M. Atlas, “Stimulated Petroleum Biodegradation,” Critical Review in Microbiology, Vol. 5, No. 4, 1977, pp. 371-386. doi:10.3109/10408417709102810
- A. P. Mariano, “Avaliação do Potencial de Biorremediação de Solos e de Águas Subterrâneas Contaminados com óleo Diesel,” Universidade Estadual Paulista, Rio Claro, 2006.
- V. Vallejo, L. Salgado and F. Roldan, “Evaluacion de la Bioestimulacion em la Biodegradacion de TPHs em Suelos Contaminados com Petróleo. Biostimulation Process during the Biodegradation of TPH in Oil Contaminated Soil,” Revista Colombiana de Biotecnología, Vol. 7, No. 2, 2005, pp. 67-78.
- Embrapa, “Sistema Brasileiro de Classificação de Solos,” 1999.
- K. I. Aspilla, H. Agemian and A. S. Y. Chau, “A SemiAutomated Method for the Determination of Inorganic, Organic and Total Phosphate in Sediments,” Analyst, Vol. 101, 1976, pp. 187-197. doi:10.1039/an9760100187
- K. Grasshoff, “Determination of Nitrite, Nitrate, Oxygen, Thiosulphate,” In: K. Grasshoff, M. Ehrhardt and K. Kremling, Eds., Methods of Seawater Analysis, Verlag Chemie Weinheim, New York, 1983, pp. 61-72, 81-84, 139-150.
- J. E. Lindstrom, et al., “Microbial Populations and Hydrocarbon Biodegradation Potentials in Fertilized Shoreline Sediments Affected by the T/V Exxon Valdez Oil Spill,” Applied and Environmental Microbiology, Vol. 57, No. 1, 1991, pp. 2514-2522.
- R. Z. Hoff, “Bioremediation: An Overview of Its Development and Use for Oil Spill Clean Up,” Marine Pollution Bulletin, Vol. 26, No. 9, 1993, pp. 476-481. doi:10.1016/0025-326X(93)90463-T
- J. Rytkonen, M. Itavaara and J. E. Paulsen, “The Improvement of Oil Biodegradation on the Shoreline,” Proceedings of the 7th International Offshore and Polar Engineering Conference, Vol. 2, No. 1, 1997, pp. 25-30.
- J. G. Leahy and R. R. Colwell, “Microbial Degradation of Hydrocarbons in the Environment,” Microbial Reviews, Vol. 53, No. 3, 1990, pp. 305-315.
- J. T. Dibble and R. Bartha, “Effect of Iron on the Biodegradation of Petroleum in Seawater,” Applied and Environmental Microbiology, Vol. 31, No. 4, 1972, pp. 544-550.
- B. P. Tissot and D. H. Welte, “Petroleum Formation and Occurrence,” Springer-Verlag, Berlin, 1984.
- P. C. Ganglianone and L. A. F. Trindade, “Caracterização Geoquímica dos óleos da Bacia do Recôncavo,” Geochimica Brasiliensis, Vol. 2, No. 1, 1988, pp. 15-39.
- S. J. Mcmillen, J. M. Kerr and N. R. Gray, “Microcosm Studies of Factors That Influence Bioremediation of Crude Oils in Soil,” Exploration & Production Environments Conference, San Antonio, 7-10 March 1993, pp. 389-400.
- Z. Wang and R. Bartha, “Effects of Bioremediation on Residues, Activity and Toxicity in Soil Contaminated by Fuel Spills,” Soil Biology Biochemistry, Vol. 22, No. 4, 1990, pp. 501-505. doi:10.1016/0038-0717(90)90185-3
- W. da Hameedi, et al., “The Fate of the Oil Spilled from the Exxon Valdez,” Environmental Science & Technology, Vol. 28, No.13, 1994, pp. 561-568.
- S. Bleinkinsopp, et al., “The Freshwater Biodegradation Potential of Nine Alaskan Oils,” Proceedings of the 20th Arctic and Marine Oil Spill Program Technical Seminar, Alberta, 11-13 June 1997, pp. 581-608.
- A. P. Rosa, “Processos de Biorremediação na Mitigação do Impacto Ambiental, Devido a Eventuais Derrames de óleo na Bacia de Campos—Experimentos Laboratoriais,” Universidade Estadual do Norte Fluminense, 2001.
- R. Olivieri, et al., “Microbial Degradation of Oil Spills Enhanced by a Slow-Release Fertilizer,” Applied and Environmental Microbiology, Vol. 31, No. 5, 1976, pp. 629- 634.
- K. Lee and G. H. Tremblay, “Bioremediation: Application of Slow-Release Fertilizers on Low Energy Shorelines,” Proceedings of the 1993 Oil Spill Conference, Washington DC, 29 March-1 April 1993, pp. 449-454.
- R. M. Atlas, “Microbial Degradation of Petroleum Hydrocarbons: An Environmental Perspective,” Microbiology, Vol. 45, No. 1, 1981, pp. 180-209.
- Z. Wang and M. Fingas, “Study of the Effects of Weathering on the Chemical Composition of a Light Crude Oil,” Proceedings of 17th Arctic and Marine Oil Spill Program Technical Seminar, Vancouver, 8-10 June 1994, pp. 133-171.
- M. F. Fingas, et al., “The Effect of Energy, Settling Time, and Shaking Time on the Swiflask Dispersant Apparatus,” Spill Science and Technology Bulle, Vol. 3, No. 4, 1996, pp. 193-194. doi:10.1016/S1353-2561(97)00010-8
- E. S. Souza, “Desenvolvimento de Métodos de Biorremediação Aplicados a Derrames de Petróleo em Água do mar—Testes Laboratoriais,” Universidade Estadual do Norte Fluminense, 2003.
- T. V. Nascimento, “Aplicação da Biorremediação a Derrames de Petróleo Em Manguezal do Rio Das Ostras, Rj: Simulação Laboratorial,” Universidade Estadual Norte Fluminense, 2006.
- A. P. Rosa and J. A. Trigüis, “Processo de Biorremediação Usando o Fertilizante NPK, em Eventuais Derrames de óleo—Experimentos Laboratoriais,” Revista Brasileira de Geociências, Vol. 36, No.2, 2006, pp. 232- 242.
- R. M. Atlas and R. Bartha, “Degradation and Mineralization of Petroleum in Sea Water: Limitation by Nitrogen and Phosphorous,” Biotechnology and Bioengineering, Vol. 14, No. 3, 1972, pp. 309-318. doi:10.1002/bit.260140304
- P. E. Bergstein and J. R. Vestal, “Crude Oil Biodegradation in Arctic Tundra Ponds,” Arctic, Vol. 31. 1978, pp. 158-169.
- R. Xu, et al., “Application of a Slow-Release Fertilizer for Oil Bioremediation in Beach Sediment,” Journal of Environmental Quality, Vol. 33, No. 4, 2004, pp. 1210- 1216. doi:10.2134/jeq2004.1210