Open Journal of Clinical Diagnostics
Vol.4 No.2(2014), Article
ID:46545,11
pages
DOI:10.4236/ojcd.2014.42014
Determination of Plasmodium Parasite Life Stages and Species in Images of Thin Blood Smears Using Artificial Neural Network
Lucy Gitonga*, Daniel Maitethia Memeu, Kenneth Amiga Kaduki, Mjomba Allen Christopher Kale, Njogu Samson Muriuki
Chuka University, Chuka, Kenya
Email: *gitonga30@yahoo.com, danielmaitethia@gmail.com, Kaduki@uonbi.ac.ke, mjomba@uonbi.ac.ke, njoguumuriuki2@gmail.com
Copyright © 2014 by authors and Scientific Research Publishing Inc.
This work is licensed under the Creative Commons Attribution International License (CC BY).
http://creativecommons.org/licenses/by/4.0/


Received 1 April 2014; revised 1 May 2014; accepted 8 May 2014
ABSTRACT
Malaria is a leading cause of deaths globally. Rapid and accurate diagnosis of the disease is key to its effective treatment and management. Identification of plasmodium parasites life stages and species forms part of the diagnosis. In this study, a technique for identifying the parasites life stages and species using microscopic images of thin blood smears stained with Giemsa was developed. The technique entailed designing and training Artificial Neural Network (ANN) classifiers to perform the classification of infected erythrocytes into their respective stages and species. The outputs of the system were compared to the results of expert microscopists. A total of 205 infected erythrocytes images were used to train and test the performance of the system. The system recorded 99.9% in recognizing stages and 96.2% in recognizing plasmodium species.
Keywords:Plasmodium, Artificial Neural Network (ANN), Classifier, RGB, Train Set, Target

1. Introduction
Malaria is a global public health threat. It is estimated that about 1 million lives are lost annually due to the disease, majority of which are children below five years of age [1] . Besides, the scourge poses a serious economic burden to the affected families and countries where the disease is endemic [2] . The disease is caused by protozoan parasites of the genus Plasmodium which is transmitted by bites of infected female anopheles mosquito. There are four species of Plasmodium parasites known to cause malaria to humans namely; Plasmodium falciparum, Plasmodium vivax, Plasmodium ovale, and Plasmodium malariae. Plasmodium falciparum is the most prevalent and is responsible for the most of the deaths. It is common in tropical Africa [3] . The second most prevalent Plasmodium species is Plasmodium vivax. It is common in South East Asia [3] . Plasmodium malariae and Plasmodium ovale account for a small percentage of the infection [4] . Plasmodium parasites undergo four main life stages namely; early trophozoite (or ring stage), mature trophozoite, gametocyte and schizoint stage. Gametocyte and schizoint stages are reproductive stages with gametocyte being sexual while schizoint is asexual [5] .
A key element to successful treatment of malaria is speedy and accurate diagnosis of the disease. Malaria diagnosis entails detection of Plasmodium parasites, determination of the parasites life stages and species as well as quantification of degree of infection (parasitemia) [6] . A number of diagnostic techniques for the disease exist. These include polymerase chain reaction (PCR) based technique which detect the DNA of the micro-organism being sought [7] -[9] , Rapid Diagnostic Tests (RDT) which detects the antigen generated by the body as a result of the parasite attack [7] [10] , manual microscopy which entails visual examination of a blood smear sample (Thin or thick) to determine the presence of the parasite. Manual microscopy is currently the gold standard method of malaria diagnosis [7] [11] . The technique is relatively cheap, parasites life stages and species as well as parasitemia estimation can be determined by the technique. However, the technique has some challenges which including that the process is time consuming with a single test taking up to one hour [12] [13] . The results of the tests are difficult to reproduce and unreliable when performed by inexperienced microscopist. Microscopes require power to operate, a requirement which make them inaccessible in areas where poverty is prevalent.
The goal of this work is to develop a technique for automating the process of determining Plasmodium parasite stages and species. These two diagnostic tasks are necessary in administration of correct treatment to a malaria patient [14] [15] . A number of studies have attempted to address this problem [16] -[18] . However, most of these studies propose techniques that are not robust enough to be applied for practical purposes. For instance, in a stained blood smear image a number of objects are highlighted by the stain. These include: Plasmodium parasites, blood bacteria and spores, white blood cells, platelets and crystals of the staining chemical, dust and other artifacts [19] . Most studies have not efficiently addressed how to distinguish a valid Plasmodium parasite from the rest of the stained objects (artifacts) [19] . Another area that has not been addressed satisfactorily is how to deal with variation from blood smear image captured under different conditions [19] . These variations are occasioned by differences in: sample preparation, imaging devices, imaging device settings, imaging conditions such as amount and quality of illumination amongst many other factors. Most studies focus attention on analysis of morphological and colour features of highlighted objects in images of stained blood smears. However, little effort is spent in addressing normalization of variations in these features. For example, whereas some erythrocytes may be round shaped, others may not due to the fact that they may be overlapping or as a result of cell disorders such as anemia [19] . Different Plasmodium parasite species and life stages have features which are interrelated. The shapes and pigment of these parasites are not distinct and keep on evolving as the parasite grows. This makes automatic machine identification of the parasite species and stages a very difficult task.
To address the challenges discussed above, a novel technique of determining the species and life stages of Plasmodium parasites in infected erythrocytes images is described in this paper. A strategy which mimics human microscope operator is developed using back propagation artificial neural network (ANN). ANN has got many advantages [20] which led to its adoption in this study. These include the fact that it doesn’t require derivation of a mathematical model of the problem to be solved or a priori knowledge of the statistical properties of the features to be used for classification. Besides, they have ability to learn and adapt to changes in the environment without the risk of over-fitting.
1.1. Artificial Neural Networks (ANN)
In situations where statistical properties of pattern class are not known, classification of a decision theoretic problem is best handled by methods that yield the required decision functions directly via training. Neural network is one such approach. It comprises of inter-connections of nonlinear computing elements organized as networks reminiscent of the way neurons are believed to be interconnected in the brain. The basic block of a neural network comprises of a computing element where weighted inputs are added followed by a nonlinear activation element which receives the sum of the weighted inputs and gives an output value. This basic architecture of artificial neural network is referred to as the perceptron. They consist of a single layer of neurons. Perceptrons can learn linear decision functions that separate two linearly separable training sets. Figure 1 shows schematically the model for two pattern classes.
The response of the device is based on a weighted sum of its inputs; that is
 (1)
(1)
This is the linear decision function with respect to the components of the pattern vectors. When ![]() the threshold element causes the output of the perceptron to be,
the threshold element causes the output of the perceptron to be, ![]() , indicating that the pattern x was recognized as belonging to class w1. On the other hand, when
, indicating that the pattern x was recognized as belonging to class w1. On the other hand, when![]() , x is classified as belonging to w2. If n such neuron models are arranged into a layer, they can be used to classify patterns into 2n pattern classes, provided the classes are linearly separable [21] . The limitation of a perceptron is that that it cannot classify classes of patterns whose decision functions are not linearly separable. To solve this problem, use is made of multilayer neural networks. There are two classes of multilayer neural networks namely, feed-forward networks and feedback networks. The feed-forward ANNs allow signals to travel one way only; from the input to output. There are no feedback loops and so the output of any layer is not affected by previous output of the same layer. Feed-forward networks associate inputs with output and are extensively used in pattern recognition. Feedback network have signals travelling in both directions by introducing loops in network.
, x is classified as belonging to w2. If n such neuron models are arranged into a layer, they can be used to classify patterns into 2n pattern classes, provided the classes are linearly separable [21] . The limitation of a perceptron is that that it cannot classify classes of patterns whose decision functions are not linearly separable. To solve this problem, use is made of multilayer neural networks. There are two classes of multilayer neural networks namely, feed-forward networks and feedback networks. The feed-forward ANNs allow signals to travel one way only; from the input to output. There are no feedback loops and so the output of any layer is not affected by previous output of the same layer. Feed-forward networks associate inputs with output and are extensively used in pattern recognition. Feedback network have signals travelling in both directions by introducing loops in network.
1.2. Learning Rule
A learning rule is a procedure for modifying the weights and biases of a network. Learning rules can be classified under three categories namely; supervised learning, unsupervised learning, and reinforcement learning.
In supervised learning, the networkis provided with a training set, which is a set of examples which give proper network behaviour: , where
 ![]() is the
is the ![]() network input and
network input and ![]() is the corresponding network output commonly referred to as the target. As the inputs are applied to the network, outputs are compared to the target. The learning rule is then used to adjust the weights and biases of the network in order to minimize the difference between the network outputs and the targets.
is the corresponding network output commonly referred to as the target. As the inputs are applied to the network, outputs are compared to the target. The learning rule is then used to adjust the weights and biases of the network in order to minimize the difference between the network outputs and the targets.
In unsupervised learning, the weights and the biases are modified in response to the network inputs only. There are no target outputs available. The algorithm performs some kind of clustering operation. Inputs are categorized into finite number of classes.
In reinforcement learning, the learning algorithm is provided with the network inputs and a grade (also called score). The grade is a measure of the network performance over some sequence of output.
2. Algorithm Development
Expert microscopist use color, shapes, relative sizes and texture of both infected erythrocyte and Plasmodium
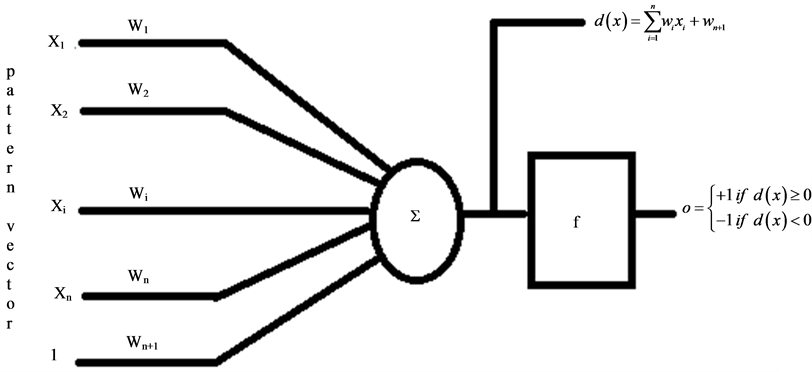
Figure 1. The neuron model, it consists of the weighted inputs, the summer, and the activation function f.
parasites to distinguish between different life stages and species of Plasmodium parasites. Therefore, an automated system for performing such classification using images of thin blood smear should be able of inferring information about color, and morphology of infected erythrocytes and Plasmodium parasites from the images. It is therefore logical that the system should comprise of classifiers trained with color and morphological features on infected erythrocyte images in order to categorize various classes of the parasite life stages and species. This is the model used to develop such a system in this work. A block diagram of the model is depicted in the Figure 2.
3. Methodology
Images of thin blood smear were obtained from two sources, namely Center for Disease Control (CDC) [22] and Kenya Medical Research Institute (KEMRI) [22] [23] . The images were preprocessed by performing median filtering operation with a filter kernel of 5 by 5 to remove noise. The images were then spatially rescaled to a uniform size. Identification of infected erythrocytes was then done by a trained ANN using erythrocytes RGB feature as its input [24] .
Automation of Plasmodium parasites classification into their respective stages and species is a difficult task. This is due to the high correlation of parasite features in different stages and species. Based on this difficulty, neural network classifiers were considered to be the best tools for the job. This is because they would learn to distinguish different stages and species using examples of image features of these parasites used as training set.
3.1. Stages Classification
Two sets of features were used to train neural network classifiers to classify Plasmodium life stages. One was, direct pixel values of RGB images obtained from the two sources. Another set of features comprised of the parasites and infected erythrocytes morphological, color and texture information. The features were divided into four classes corresponding to the four main life stages of Plasmodium parasites namely; early trophozoites (the ring stage), mature trophozoite, schizoint and gametocyte stages. These features were then used to train two ANN classifiers to recognize Plasmodium life stages. Algorithmic steps for the two procedure followed are given in Table 1 and Table2 A total of 100 images were used in training of ANN classifiers.
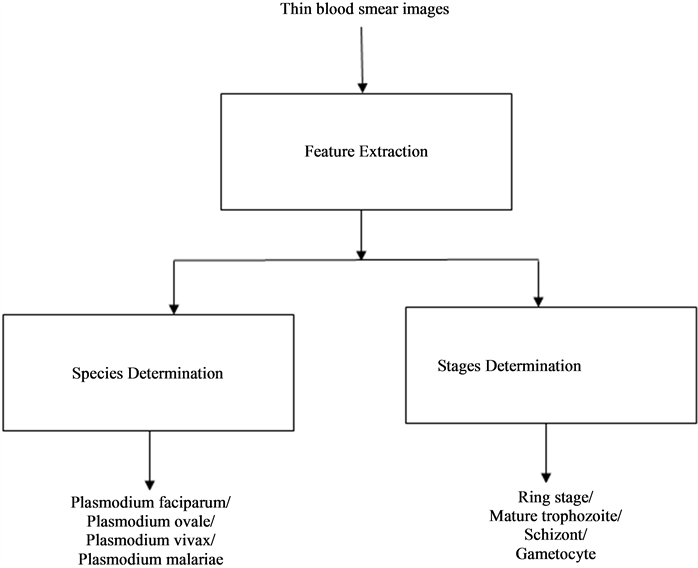
Figure 2. Block diagram showing a black box model of Plasmodium parasites stages and species classification.

Table 1. Algorithmic steps for training ANN to identify Plasmodium life stages using color features.
Table 2. Algorithmic steps for training ANN to identify Plasmodium life stages using colour, morphological and texture features.
Artificial neural network was designed and trained using the steps described in Table 1 and their performance noted for different numbers of hidden neurons. The training set comprised of a 3 by 800 matrix of RGB input features and a target matrix of 4 by 800 elements. The training set was divided into four classes corresponding to the four stages of Plasmodium parasites. A fifth of the training set was set aside for validating the network performance.
The next technique explored for Plasmodium parasites stages differentiation was the use of the parasites morphological, colour and texture information. Here, another set of features comprising of morphological (shape and size), colour and texture features were extracted. The features are similar to what human microscopists use to distinguish between stages and species of Plasmodium parasites. Once an erythrocyte had been identified as infected, the parasite size, shape, texture, number of nucleated objects per infected erythrocyte, and their separation distances were evaluated. Besides colour information was also represented in form of the average hue, saturation, intensity, red, green, and blue components of the infected erythrocytes. These parameters were then used as feature vector for training a multilayer neural network to classify Plasmodium parasites into its respective life stages. The training set comprised was made up of 15 by 800 input features and a 4 by 800 target matrix. This training set was also divided into four groups corresponding to four plasmodium parasites life stages with a fifth of the feature vector used for validation. The algorithmic steps used for this classification task are given in Table2
The neural network classifier described above was trained with different number of hidden neurons and their performances recorded.
3.2. Species Determination
As was the case with stages classification, species identification was experimented using two approaches. One was training a multilayer neural network classifier using only colour information of the infected erythrocyte, and the second scheme was to use a combination of colour, morphology, and texture features of infected erythrocyte. In both cases, a total of 205 infected erythrocyte sub-images were used to form 205 feature vectors. 80 feature vectors were extracted from Plasmodium falciparum infected erythrocytes, 50 feature vectors were extracted from Plasmodium ovale infected erythrocytes, 50 feature vectors were extracted from Plasmodium vivax infected erythrocytes, while, 35 feature vectors were extracted from Plasmodium malariae infected erythrocytes. The feature vectors were used to train multilayer artificial neural network classifiers.
In the first case RGB features were used to form the feature vector. These were the red, green, and blue components of the infected erythrocytes. The features were divided into four classes—the four species of Plasmodium parasites which infect humans.
In the second case colour, morphological and texture information for both the detected parasites and infected erythrocytes were used to form the feature vector. The features were divided into four classes, the four species of Plasmodium parasites which infect humans. Table 3 and Table 4 give the algorithmic steps used to extract the features and train the classifiers.
A feature vector of 3 by 205 elements was formed. Four fifth of these features were used in training of an ANN classifier while remaining features were used for validation of the network.
A total of 4000 features were extracted from the infected erythrocyte images. These features were divided into 4 classes based on the species of plasmodium parasites that was infecting the erythrocyte they were extracted from.
4. Results and Discussion
4.1. Test Results for Stages Determination
Table 5 gives the results obtained after training an ANN classifier with colour features. From these results it can be seen that the network attained an overall classification accuracy of 75.5% with a generalization ability of 51.1%. Regression plot for the network is shown in Figure 3. The validation session shows that that the network performed relatively poor (correlation of 51.8%) when tested with features which were not used in training it (the validation set). This implies that there would be nearly a 50% chance of correct diagnosis by the classifier using colour features as the input.
For the second ANN classifier, morphological, colour and texture features were extracted from the same 30 images used in the first classifier. The performance of the network was recorded in Table6
From these results it can be seen that the network attained an overall classification accuracy of 90.34% with a generalization ability of 99.91%. Regression plot for the network is shown in Figure 4. This is a great improvement compared to the previous value of 51.8% obtained from ANN trained with RGB features to perform Plasmodium parasite identification. This implies that colour features alone are not adequate to distinguish different life stages of plasmodium parasites but rather morphological and texture of the infected cell ought to be factored in as well. The system generalization ability as impressive as can be seen from the validation column of Table6 This implies that given similar features independent of the training set, there would be a 99.91% chance of correct diagnosis.
4.2. Test Results for Species Identification
Classification accuracies of neural networks trained to differentiate species of Plasmodium parasites using two sets of features were investigated. One neural network was trained with RGB features while the other network was trained with a combination of morphological, colour and texture features. The networks performances were monitored for different number of hidden neurons and training was stopped when the network reached the optimum performance, i.e. when no further improvement in the classification accuracy of the network could be made. Table 7 show the best performance attained by both networks.
Table 3. Algorithmic steps for training ANN to identify Plasmodium parasites species using color features.
Table 4. Algorithmic steps for training ANN to identify Plasmodium species using colour, morphological and texture features.
Table 5. Performance of stages identification using only RGB colour features of the detected Plasmodium parasites.
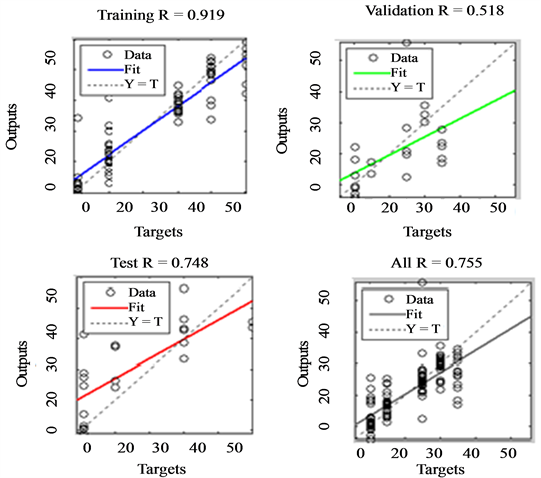
Figure 3. Performance of an ANN trained with RGB features to perform stages recognition.
Table 6. Performance of stages identification using morphological, colour and texture features of the detected Plasmodium parasites.
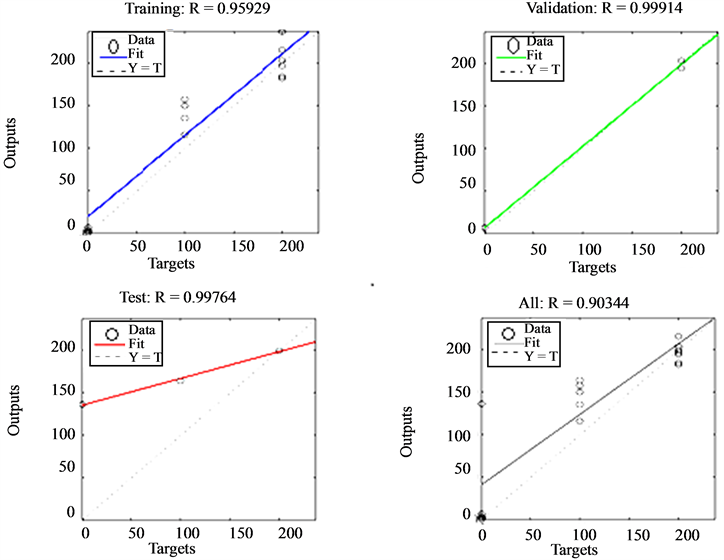
Figure 4. Performance of an ANN trained with colour, morphological and texture features to perform Plasmodium stages identification.
The best performance recorded was produced by the network trained with a combination of morphological, colour and texture features. This network yielded an overall classification of 95.85% with 93.2% generalization ability as can be seen from the regression plot of Figure 5. This implies that for a new sample being classified by the network, there would be a 96.26% chance of correct species identification. This is a great improvement from the other network trained only with colour features. As before, the reason for this can be attributed to the fact that a combination of colour, morphology and texture features describes Plasmodium parasites species more precisely as compare to colour features alone. It was therefore concluded that artificial neural network for species identification trained with colour, morphological, and texture features should be adopted for development of the malaria diagnosis system.
5. Conclusions
In this paper, a technique of classifying plasmodium parasites life stages and species in thin blood smear images
Table 7 . ANN performance for species identification.
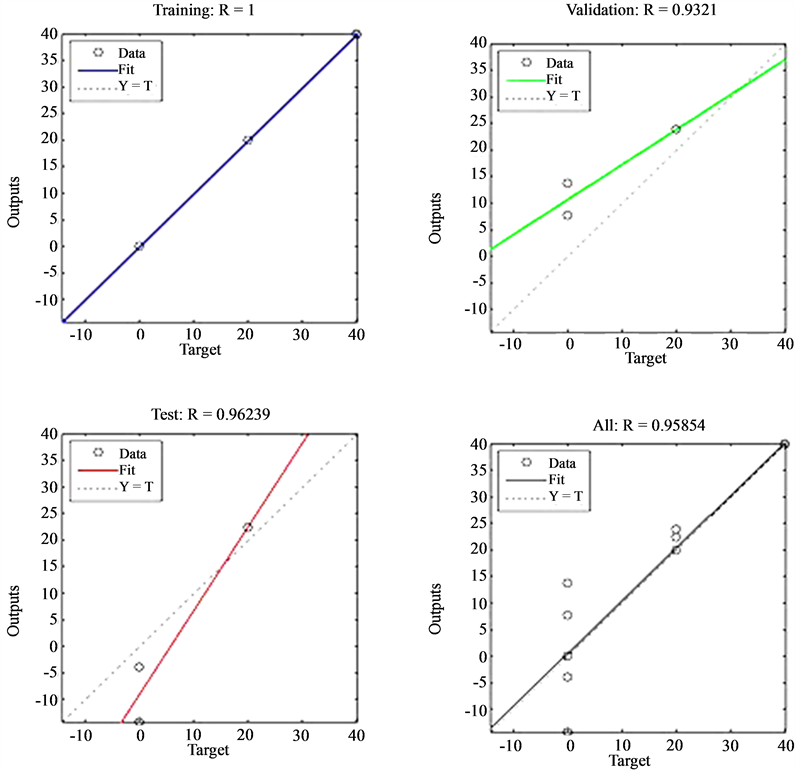
Figure 5. Performance of ANN trained with colour, morphological and texture features to identify Plasmodium species.
using ANN was developed. Algorithmic steps for extracting features from infected images as well as training of different ANN classifiers were described. The trained networks were then tested using validation samples different from those used as the training set.
The ANN classifier for stages identification attained a classification accuracy of 99.9% and 97.76% in training and validation respectively. The ANN classifier for species identification attained sensitivities of 96.2% and 93.2% in training and validation respectively. Colour, morphological and texture features of infected erythrocyte images were found to be most suitable inputs to the above classifiers.
This technique has the potential for substituting human microscopist in clinical diagnosis of malaria. The instrumentation requires implementing the technique comprising of an optical microscope fitted with a digital microscope. The digital camera should be interfaced to a computer installed with a software for acquisition of microscopic images and processing them using the described technique.
References
- Korenromp, E., Miller, J., Nahlen, B., Wardlaw, T. and Young, M. (2005) World Malaria Report 2005. Tech Rep World Health Organisation, Geneva.
- Foster, S. and Philip, M. (1998) Economics and Its Contribution to the Fight against Malaria. Annals of Tropical Medicine and Parasitology, 92, 391-398. http://dx.doi.org/10.1080/00034989859375
- Hay, S.I., Guerra, C.A., Tatem, A.J., Noor, A.M. and Snow, R.W. (2004) The Global Distribution and Population at Risk of Malaria: Past, Present, and Future. The Lancet Infectious Diseases, 4, 327-336. http://dx.doi.org/10.1016/S1473-3099(04)01043-6
- Zhou, M., Liu, Q., Wongsrichanalai, C., Suwonkerd, W., Panart, K., Prajakwong, S., Pensir, A., Kimura, M., Atsuoka, H., Ferreira, M.U., Isomura, S. and Kawamoto, F. (1998) High Prevalence of Plasmodium malariae and Plasmodium ovale in Malaria Patients along the Thai-Myanmar Border, as Revealed by Acridine Orange Staining and PCR-Based Diagnoses. Tropical Medicine and International Health.
- Robert, V. and Boudin, C. (2003) Biology of Man-Mosquito Plasmodium Transmission. Bulletin de la Société de Pathologie Exotique, 96, 6-20.
- WHO (2010) Guidelines for the Treatment of Malaria. 2nd Edition.
- Warhurst, D.C. and Williams, J.E. (1996) Laboratory Diagnosis of Malaria. ACO Broadsheet No.148, Journal of Clinical Pathology, 49, 533-538. http://dx.doi.org/10.1136/jcp.49.7.533
- Kawamoto, F., Miyake, H., Kaneko, O., Kimura, M., Dung, Liu, Q., Zhou, M., Duc Dao, L., Kawai, S., Isomura, S. and Wataya, Y. (1996) Sequence Variation in the 18sRNA Gene, a Target for PCR-Based Malaria Diagnosis in Plasmodium Ovale from Southern Vietnam. Journal of Clinical Microbiology, 34, 2287-2289.
- Seesod, N., Nopparar, P., Hedrum, A., Holder, A., Thiathong, S., Uhlen, M. and Lundeburg, J. (1997) An Integrated System Using Immune-Magnetic Separation, Polymerase Chain Reaction, and Colorimetric Detection for Diagnosis of Plasmodium Falciparum. The American Journal of Tropical Medicine and Hygiene, 56, 322-328.
- Beadle, C., Long, G.W., Weiss, W.R., McElroy, P.D., Maret, S.M., Oloo, A.J. and Hoffman, S.L. (1994) Diagnosis of Malaria by Detection of p. Falciparum HRP-2 Antigen with a Rapid Dipstick Antigen—Capture Assay. Lancet, 343, 564-568. http://dx.doi.org/10.1016/S0140-6736(94)91520-2
- Report of Joint WHO/USAID (2005) New Perspectives of Malaria Diagnostics. Informal Consultations, 25-27 October 1999.
- Mirdha, B., Samantaray, S. and Mishra, B. (1997) Laboratory Diagnosis of Malaria. Journal of Clinical Pathology. http://dx.doi.org/10.1136/jcp.50.4.356-a
- Kain, K.C., Harrington, M.A., Tennyson, S. and Keystone, J.S. (1998) Imported Malaria; Prospective Analysis of Problems in Diagnosis and Management. Clinical Infectious Diseases, 27, 142-149. http://dx.doi.org/10.1086/514616
- Witkowski, B., Lelièvre, J., Barragán, M.J., et al. (2010) Increased Tolerance to Artemisinin in Plasmodium Falciparum Is Mediated by a Quiescence Mechanism. Antimicrobial Agents and Chemotherapy, 54, 1872-1877. http://dx.doi.org/10.1128/AAC.01636-09
- Thapar, M.M., Gil, J.P. and Bjorkman, A. (2005) In Vitro Recrudescence of Plasmodium falciparum Parasites Suppressed to Dormant State by Atovaquone Alone and in Combination with Proguanil. Transactions of the Royal Society of Tropical Medicine and Hygiene, 99, 62-70.
- Ross, N.E., Pritchard, C.J., Rubin, D.M. and Duse, A.G. (2006) Automated Image Processing Method for the Diagnosis and Classification of Malaria on Thin Blood Smears. Medical & Biological Engineering & Computing, 44, 427-436. http://dx.doi.org/10.1007/s11517-006-0044-2
- Di Ruberto, R.C., Dempster, A., Khan, S. and Jarra, B. (2002) Analysis of Infected Blood Cell Images Using Morphological Operators. Image and Vision Computing, 20, 133-146.
- Diaz, G., Gonzalez, F.A. and Eduardo, R. (2009) A Semi-Automatic Method for Quantification and Classification of Erythrocytes Infected with Malaria Parasites in Microscopic Images. Journal of Biomedical Informatics, 42, 296-307. http://dx.doi.org/10.1016/j.jbi.2008.11.005
- Tek, F.B., Dempster, A.G. and Kale, I. (2009) Computer Vision for Microscopy Diagnosis of Malaria. Malaria Journal, 8, 153. http://dx.doi.org/10.1186/1475-2875-8-153
- Raj, K.B., Ashok, K.G. and Manoj, K.S. (2009) Matlab and Its Application in Engineering.
- Hagan, M.T., Demuth, H.B. and Beale, M. (1996) Neural Network Design. Pws Publishing Company.
- http://www.dpd.cdc.gov/dpdx/HTML/Frames/M-R/Malaria/body_Malariadiagfind2.htm
- http://www.kemri.org/
- Daniel, M.M. (2013) A Rapid Malaria Diagnostic Method Based on Automatic Detection and Classification of Plasmodium Parasites in Stained Thin Blood Smear Images. MSc Thesis, University of Nairobi.
NOTES

*Corresponding author.