Open Journal of Animal Sciences
Vol.4 No.4(2014), Article
ID:47639,10
pages
DOI:10.4236/ojas.2014.44021
Effects of a Geographically-Targeted Intervention and Creative Outreach to Reduce Shelter Intake in Portland, Oregon
Gregory S. Miller, Margaret R. Slater, Emily Weiss
Shelter Research and Development, Community Outreach, American Society for the Prevention of Cruelty to Animals (ASPCA®), New York, USA
Email: greg.miller@aspca.org
Copyright © 2014 by authors and Scientific Research Publishing Inc.
This work is licensed under the Creative Commons Attribution International License (CC BY).
http://creativecommons.org/licenses/by/4.0/


Received 27 April 2014; revised 10 June 2014; accepted 26 June 2014
ABSTRACT
Animal shelters focus much of their efforts towards decreasing euthanasia and one of the best ways to reduce euthanasia risk may be to prevent cats and dogs from ever entering a shelter. This study, conducted in Portland, Oregon, relied on the capabilities of Geographic Information Systems (GIS) to precisely and scientifically identify an intervention area (with high shelter intake) and to identify control areas to compare the project results with community-wide trends. The intervention itself was designed and implemented in a comprehensive way by seeking numerous paths to engage pet owners and reduce shelter intake of cats and Pit Bull type dogs. This research highlighted the ability of Geographic Information Systems (GIS) to significantly improve a community’s capacity to identify the most appropriate locations to focus resources and to closely track and measure interventions. Portland’s targeted intervention to reduce shelter intake utilized many outreach tools with varying levels of impact. The overall intervention yielded a reduction in intake of owned cats that was greater in total numbers and percentage than four control areas. Furthermore, this work identified a percentage of cat spay/neuter out of the estimated number of owned, originally intact cats within the intervention and control areas. As percentages approached or surpassed 20%, those areas realized larger intake reductions than control areas with lower percentages.
Keywords:Animal Shelter Intake, GIS, Spay Neuter, Cat, Dog

1. Introduction
Approximately 5 - 7 million dogs and cats enter animal shelters annually [1] ; and in some communities more than half are euthanized. Animal shelters have traditionally focused much of their efforts to decrease euthanasia through programs that increase adoptions and getting lost pets back home. However, one of the best ways to reduce euthanasia risk may be to prevent cats and dogs from ever entering a shelter. Therefore, decreasing shelter intake is a key goal for many communities not only to reduce euthanasia risk, but also to decrease the distress for owners and animals from relinquishment, and to reduce costs at shelters and animal control organizations. How to reach a goal of reducing shelter intake is a challenge being faced nationwide and is very directly related to this research.
Several previous studies have examined the impact of spay/neuter on shelter intake [2] -[5] . Their results are varied but suggest that cat intake may be more sensitive to spay/neuter efforts than dogs [2] -[4] . They also illustrate some of the difficulties in studying community level interventions including needing very large numbers of animals receiving spay/neuter to have an impact. These difficulties also include factors such as fluctuations in the level or focus of funding for animal welfare, changes in policy like shelter hours and staff efforts at picking up stray animals as well as significant environmental/natural events like hurricanes which may confound the results.
One recent study examined two adjacent counties in CA for shelter intake trends using data from 1993 to 2005 [2] . One county had spay/neuter voucher programs and the other did not. Statistical analyses showed a greater than expected decrease in surrendered cats during the time the voucher program was in effect in the one county but no influence on dog intake. Another recent study examined the impact of high volume subsidized spay/neuter clinic on dog and cat intake in a county at the county’s only animal shelter [3] . Dog intake was already declining and no increase in rate of decline was seen during the 3.5 year time period after the spay/neuter clinic was open. The median number of cats impounded did decline after the spay/neuter clinic was opened and service calls and complaint numbers were also lower. These results did suggest that large numbers of spay/neuter could influence cat intake.
A third article summarized data from two different programs in different parts of the country for the effect of spay/neuter on shelter intake and euthanasia [4] . The New Hampshire state program included shelter spay/neuter as well as low income owner spay/neuter services for their dogs and cats. Results initially appeared to be a substantially decreased intake for cats but after 6 years, in 2000, the intake began to increase again. Dog intake was in decline prior to the program initiation and again in about 2000, the intake began to increase. In the city of Austin, TX free spay/neuter in specific zip codes was offered beginning in 2000. These seven zip codes were selected based on lower income and higher poverty levels than the rest of Austin and not on shelter intake. When comparing animal control shelter intake in the seven selected zip codes with the other city zip codes, there was a slower increase in intake across time for cats and dogs in the seven zip code areas. These results suggest that focusing spay/neuter on smaller areas could result in an impact on intake for both cats and dogs.
Finally, one published study analyzed communities funded by a single grant agency and found that new lowcost spay/neuter and adoption programs do not simply substitute from existing spay/neuter and adoptions but raised the total community numbers [5] . More related to our research, they did not find any trends or statistically significant results demonstrating any relationship between total spay/neuter surgeries and shelter intake.
This research expands on previous studies by first relying on the capabilities of Geographic Information Systems (GIS) to precisely and scientifically identify an appropriate intervention area with high shelter intake. Second, GIS was again utilized to identify control areas for comparison of the project results with community-wide trends to address confounding. Finally, the intervention itself was designed and implemented in a much broader and comprehensive way beyond just spay/neuter to prevent intake by seeking numerous paths to engage pet owners and reduce shelter intake of cats and Pit Bull type dogs (who are at high risk for longer shelter stays and euthanasia compared to other dogs).
The Portland, OR community was selected for this project for a number of reasons. The Animal Shelter Alliance of Portland (ASAP), represents the greater Portland, Oregon metro area’s largest animal welfare organizations. The coalition has a mission to end the euthanasia of social, healthy, and treatable cats and dogs. In striving towards their mission, ASAP had a history of collaboration on various community projects including those aimed at reducing shelter intake of cats and dogs. In late 2011, the American Society for Prevention of Cruelty to Animals (ASPCA) began a partnership with ASAP that was designed to take advantage of GIS technology as well as the creative spirit that we believe is necessary to discover new ways of reducing shelter intake. Their willingness to think outside of the box and to focus significant resources towards a geographically-identified area of high intake as well as their attention to detail made this partnership beneficial for ASAP and the ASPCA.
The objectives of this manuscript are to: 1) describe the use of GIS technology in developing and tracking a data-based target for decreasing shelter intake; 2) discuss the types of interventions used in the attempt to decrease intake and 3) document the efficacy of this approach in decreasing shelter intake.
2. Methods
2.1. Data Sources and Acquisition
The four primary ASAP animal shelters (Humane Society for Southwest Washington, Multnomah County Animal Services, Oregon Humane Society, and Washington County Animal Services) pulled cat and dog intake data for all of 2010 from their shelter software/database systems. Although the software varied by shelter, they all were able to provide intake data in an Excel format that included individual records for all cats and dogs that entered their shelters in 2010. Data fields included species, intake type (owned or free-roaming), age, breed, gender, spay/neuter status, and address. The addresses included the owner addresses for owned animals and the location found for free-roaming animals. The data cleaning process involved removal of animal intake records of animals that: were returned within 30 days following adoption, were abandoned at shelters, and did not have sufficient or complete address information. To avoid large amounts of missing data, our criteria recommend that intake data be available community-wide with at least 85% of the community’s animal intake and that at least 80% of that data is clean and able to be mapped. The full 2010 dataset met the established criteria for completeness and cleanness.
2.2. Use of GIS Technology for Intervention and Control Area Selection
The community’s goal was to lower cat and dog shelter intake and they had specific concerns for dogs loosely categorized as “Pit Bulls”. The shelters defined Pit Bull type dogs as any dogs that visually resemble one or more bully type breeds. The analysis compiled shelter intake data from the four animal shelters for all of 2010 and utilized standard hot spot and density mapping methods to determine the areas within the community that were relinquishing the most cats and dogs and/or producing the most stray intake. Pit Bull type dogs, as a subset of special interest, were also mapped separately.
For the analysis, the ESRI ArcGIS software package and toolsets were used. The cleaned shelter data was geocoded from its spreadsheet format, creating the spatial point dataset that was the basis for the GIS analysis. The cat and dog intake points were then mapped using multiple mapping techniques. These included using the spatial join operation to map hot spots (identifying higher concentrations and clusters of intake) by census tract, census block group, neighborhood, and zip code as well as creating surface density maps by implementing the kernel density tool (Figure 1 is one example from the analysis).
The ASAP organizations (both animal shelters and spay/neuter providers) were engaged to help select an intervention area to focus on reducing intake of cats and Pit Bull-type dogs into the community’s shelters. This was based on consideration of the highest concentrations (hot spots) of Pit Bull type dog and cat intake as well as on local considerations related to the neighborhoods (size and location) and feasibility of implementing a program within any given area. The final intervention area combined the boundaries of three established neighborhoods in East Portland (Hazelwood, Mill Park, and Hazelwood/Mill Park) and was approximately five square miles in size (Figure 2). Utilizing the same shape and size (in land area) as the intervention area, four control areas were identified that displayed similar levels of shelter intake for dogs and cats as well as comparable numbers of humans, total households, and median incomes.
2.3. Outreach Methods
The overall outreach approach and individual tools were based on the initial direction provided by the ASPCA to explore novel and creative interventions. The ASAP planning team then came up with a strategy that laid out a wide range of tools and services. The services offered to pet owners within the intervention area included free spay/neuter surgeries, free behavior training, and free vaccines. Incentives were also offered including retail business gift cards and rewards for referring others to the program.
Outreach and targeted services began in the intervention area in January 2012 and continued through June 2013. The outreach tools used within the intervention neighborhoods included everything from postcards and
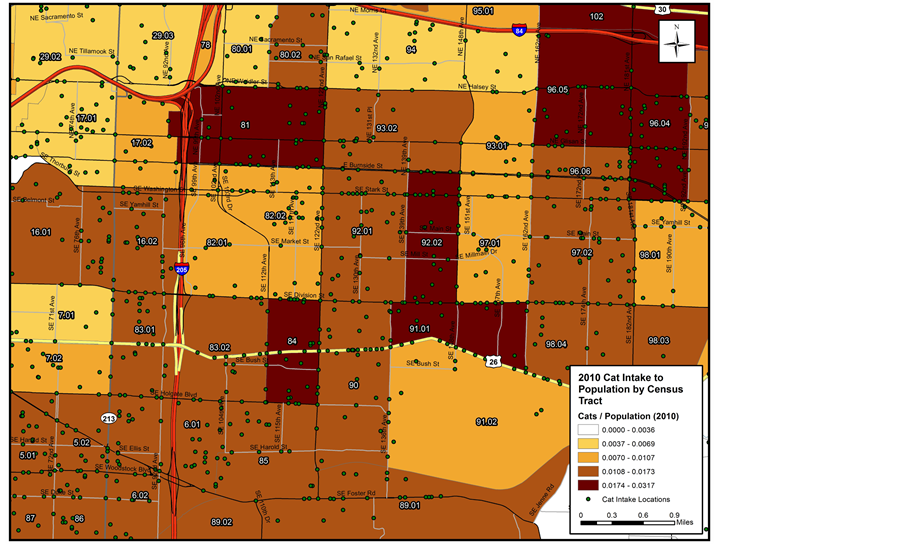
Figure 1. Map of 2010 cat shelter intake by Census tract in East Portland. This map was helpful to alliance staff in determining the final intervention area.

Figure 2. Map of the Portland intervention area spay/neuter surgeries. The larger black outlined area represents the entire intervention area (~5 square miles). The interior boundaries delineate the three neighborhoods (Hazelwood, Mill Park, and Hazelwood/Mill Park) within the overall intervention area. Hazelwood is the horseshoe shaped neighborhood while Mill Park is in the bottom center and Hazelwood/Mill Park is the small area in the left center of the overall intervention area.
mailers, to free vaccine clinics, to behavior training classes, and presentations at local schools as well as extensive one-on-one relationship-building via an outreach coordinator and volunteers.
2.4. Tracking Interventions and Intake Data
The data tracked included shelter intake, spay/neuter, and data points related to the type and amounts of intervention outreach. Shelter intake was mapped and summarized by month for the intervention and control areas. This provided the ability to measure progress towards the intervention’s primary goal of reducing intake and to compare that change to other locations in the community (via the control areas). For spay/neuter, the intervention spay/neuter locations as well as the locations of public spay/neuter were provided and mapped. Mapping the locations of where animals came from for public and project spay/neuter allowed for comparison between the numbers of spay/neuter surgeries completed for animals from the intervention area and the control areas. All outreach tools, services, and incentives were tracked separately by the outreach coordinator and stored in a project database. Each record indicated which tool (such as a mailer or interaction with an outreach volunteer) led to an intervention area pet owner initially coming in contact with the intervention program (even if this did not lead directly to providing a service). The record also tracked which tool ultimately led each pet to receive a service (including spay/neuter, vaccines, or training). The individual outreach tools were aggregated into categories that allowed for an overall glimpse into the types of outreach that were the most successful versus those that were not.
To measure efficacy of this intervention in another way, we calculated the estimated percentage of owned intact cats that were spayed or neutered during the 18-month project timeframe using a recognized formula [6] . The calculation of owned cat numbers was based on human population estimates and estimates of the number of persons above or below the poverty line. These figures, based on the US Census American Community Survey, were obtained for the intervention and control areas through ESRI’s Community Analyst web application [7] . The number of spays or neuters was collected during the project. The final estimates of the percentage of owned intact cats that were spayed or neutered within the intervention and control areas were then compared to each other.
3. Results
The Portland alliance of shelters relied heavily on maps and analyses to decide where to implement their intervention program and continued to rely on GIS to make sure the project stayed on track. During monthly meetings of the project steering committee, updates on progress with spay/neuter surgeries, success of outreach tools, and changes in intake from the intervention area were reviewed and discussed. Sub-areas of the intervention target area were examined closely and outreach staff was able to adjust their efforts based on project data. Additionally, a Google map of the intervention area boundary allowed for project and shelter to staff to quickly and easily identify clients that were eligible for the program.
The Portland intervention included more than 60 unique outreach tools. Thirty five of these tools led to at least one animal being served by the program. Individual tools that didn’t lead directly to any animals using the program included a local newspaper ad, many events primarily focused on Pit Bull type dogs, meeting with neighborhood associations, emailing one of the organization’s volunteers, and flyers sent home with elementary school children. In general, these unsuccessful tools were similar in that they were simply trying to raise awareness of the project and identify eligible pet owners by describing the purpose and scope of the project without developing a real dialogue or connection to the pet owners. For Pit Bull type dogs, the top category of outreach that lead to dogs receiving a service was referral by a friend or relative (Table 1). For owned cats, mailers followed by referrals from already existing programs were the most common outreach categories with referrals from friends and relatives coming in third (Table 2). The top three outreach tool categories were the same for Pit Bull type dogs and cats in the intervention area. However the relative importance of each was a bit different with friend or relative being the most important for the dog owners but the mailer being the primary tool for cat owners. Through the 18-month intervention period, 901 animals received wellness and/or spay/neuter services from the program. This included 579 cat surgeries (439 owned cats and 140 unowned cats) and 160 dog surgeries (91% Pit Bull type dog) (Figure 2).
The analysis to measure the efficacy of this intervention’s approach found a larger reduction in owned cat intake from the intervention area than any of the four control areas (Figure 3 and Figure 4). The difference/
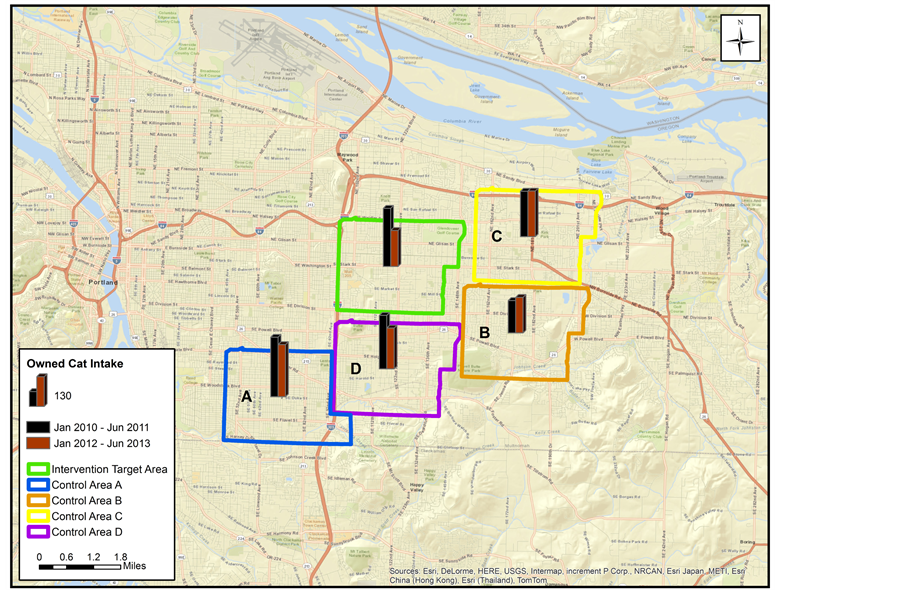
Figure 3. Map of the Portland intervention and control areas displaying owned cat shelter intake bar graphs.
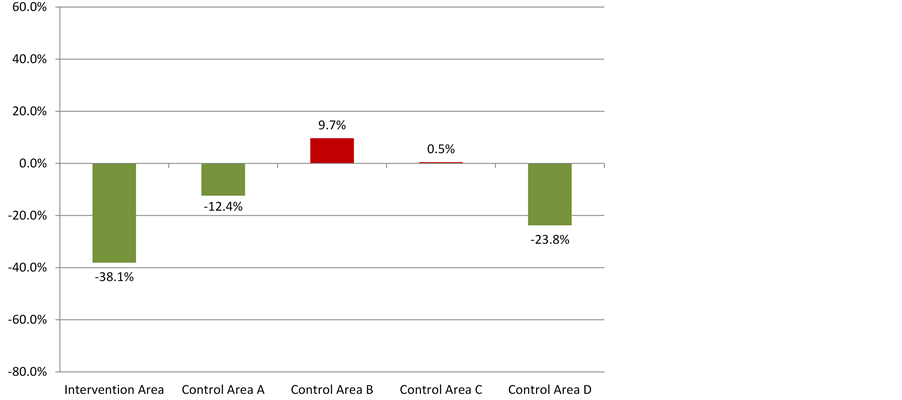
Figure 4. Percent change in owned cat intake between January 2010-June 2011 and January 2012-June 2013 in the Portland intervention and control areas.
change in intake for stray cats (Figure 5) and Pit Bull-type dogs (Figure 6) was not distinguishably different between the intervention and control areas.
We also found that the estimated percentage of owned intact cats that were spayed or neutered was higher for the 18-month period in the intervention area than any of the control areas. The highest percentage of spay/neuter occurred in the intervention area followed by control area D (Figure 7). These areas were also the two that experienced the largest decreases in owned cat intake during the same period (23% and 19%, respectively, Figure 3 and Figure 4).

Figure 5. Percent change in stray cat intake between January 2010-June 2011 and January 2012-June 2013 in the Portland intervention and control areas.

Table 1. Number of Pit Bull type dogs served by the Portland intervention program by outreach tool category.
Table 2. Number of owned cats served by the Portland intervention program by outreach tool category.
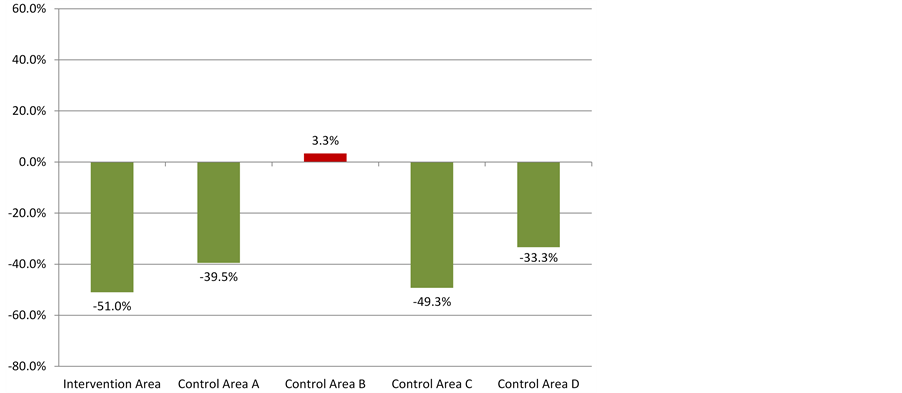
Figure 6. Percent change in Pit Bull type dog intake between January 2010- June 2011 and January 2012-June 2013 in the Portland intervention and control areas.
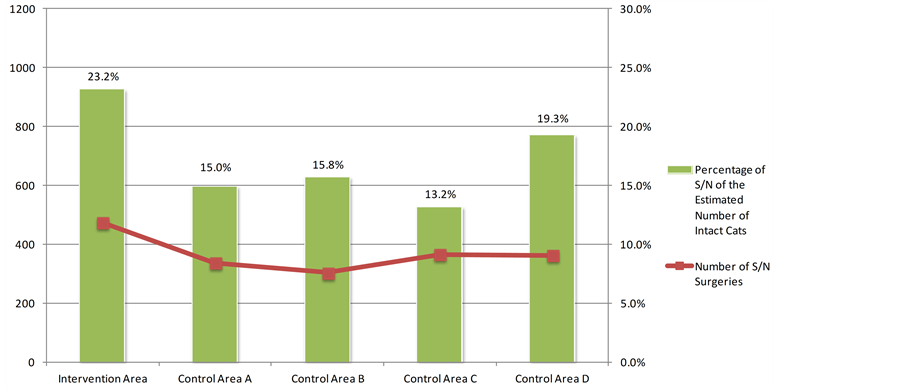
Figure 7. Number of owned cat spay/neuter surgeries from January 2012-June 2013 relative to estimates of intact owned cats for the Portland intervention and control areas.
4. Discussion
The key findings of this research were that: GIS can be a valuable tool in selecting a target for an intake reduction intervention as well as tracking program success; outreach tools can be a successful way to increase participation in programming; some outreach tools were more successful than others in increasing participation in the program; the intervention area owned cat intake decreased by a greater number (and percentage) than the control areas; the estimated percentage of owned intact cats that were spayed or neutered was higher for the intervention area; and, as the estimated percentage of owned intact cats that were spayed or neutered approached or surpassed 20% for a given area the intake reductions were more profound.
For the animal sheltering field and communities interested in reducing shelter intake and euthanasia risk, this research emphasizes the potential that lies in developing programs focused on the areas with the most at-risk animals. GIS is a valuable tool both in identifying the hot spots of intake and in tracking the progress of intervention programs. We would encourage the use of GIS to facilitate animal shelters understanding the intake dynamics in their community. GIS can then be used to track and visualize the implementation of their interventions.
This research demonstrated the benefits for shelters to work out in their community as opposed to just focusing on animals inside their shelters and to intervene in the community before animals ever reach their doors. Some outreach tools such as targeted mailers along with referrals from existing programs and by friends and relatives, were more successful than others. These research results would suggest further consideration is needed regarding the cost and effort related to each tool and approach. While flyers and mailings saw some success it is important to consider the overall cost per pet impacted by these tools which was quite high. Referrals either by friends or relatives or from existing community programs could be the most impactful and cost effective but require an established program that is familiar to the community residents. Making the existing services free may also have contributed to the success of these approaches.
During the 18-month project using varied outreach tools, the intervention area showed a reduction in owned cat shelter intake. This reduction was greater in total numbers and percentage than the four control areas. Furthermore, this work identified a percentage of cat spay/neuter out of the estimated number of owned, originally intact cats within the selected areas. As percentages approached or surpassed 20%, those areas realized larger intake reductions than control areas with lower percentages. It remains to be seen whether such levels of spay/ neuter will have the same desired impact in other communities. This provides some evidence of success of a geographically-targeted intervention to reduce shelter intake of owned cats. How unique these findings were to Portland, both in reducing intake generally and in identifying a level of spay/neuter to intact animals that will allow a community to reduce shelter intake requires additional research. Determining if 20% spay/neuter of estimated is a critical level that will yield results in most communities also remains to be demonstrated.
While the same result was not achieved for unowned cats or Pit Bull type dogs as for owned cats, this is not all that surprising since the majority of the intervention resources ended up targeting owned cats, and their owners, with less emphasis (and resources spent) on unowned cats and Pit Bull type dogs. A lot of the outreach relied on the strength of existing programs such as “Spay and Save” which began targeting cat owners in 2010 in the Portland region. Additionally, unowned cats were not a primary focus, as is evident in the number of spay/ neuter surgeries completed (140 versus 439 for owned cats). As for Pit Bull type dogs the relatively low numbers for intake and high variability created an additional challenge to finding a clearly distinguishable impact on intake.
These findings are consistent with those of Kass [2] and Scarlett [3] in that we also found a reduction in cat intake while the intervention seemed to have no noticeable impact on dog intake. Our study differs primarily in that the intervention was more targeted than previous studies. The intervention area in Portland was approximately five square miles in size, was determined based on shelter intake, and was compared to control areas of the same size within the same county. Kass [2] and Scarlett [3] were both county level studies, White [4] studied the state of New Hampshire and the work in Austin [4] was based on zip codes that were not selected based on shelter intake. The county and state study area sizes could have made it more difficult to find solid changes and attribute those changes primarily to the spay/neuter clinic (the intervention).
Additionally, unlike the previous studies, the Portland intervention utilized a wide-range of outreach tools and did so over a relatively short amount of time. The effort was comprehensive in that many different tactics were utilized in an attempt to reduce shelter intake and this all took place over an 18-month time period. Spay/neuter surgeries were a primary piece of the intervention but additional services and tools such as training, vaccines, food, collars and tags made this effort more thorough in trying to address any obstacles that may lead to the surrender of a cat or dog.
We recognize that this research was limited in scope and that Portland is in many ways unique. The Portland metropolitan region’s shelters had a previous history of collaborating and brought their strong sense of community to the development of this project. The project relied on their team’s abilities to try creative outreach methods and connect with pet owners on a very personal level. This is something that perhaps can be replicated in many other communities while recognizing the unique characteristics of each.
5. Conclusion
This research highlighted the ability of Geographic Information Systems (GIS) to significantly improve a community’s capacity to identify the most appropriate locations to focus resources and to closely track and measure interventions. Portland’s targeted intervention to reduce shelter intake utilized many outreach tools with varying levels of impact. The overall intervention yielded positive results for owned cats and was supported by a measure of the percentage of spay/neuter of the estimated number of owned cats.
Acknowledgements
The authors wish to acknowledge Meg Allison (ASPCA) for her assistance with data management and analysis. We would also like to thank Kelly Podoloff, Anika Moje, Sharon Harmon, Kris Otteman, Joyce Briggs, Mike Oswald, Anne Potter, Karen Kraus, and the entire Animal Shelter Alliance of Portland (ASAP) team for their creative spirit, leadership, and willingness to implement this research program. Additional thanks to Kelly Campbell and PetSmart Charities, Inc. for their support and funding of this project.
References
- ASPCA (2014) Pet Statistics. http://www.aspca.org/about-us/faq/pet-statistics
- Kass, P., Johnson, K. and Weng, H. (2013) Evaluation of Animal Control Measures on Pet Demographics in Santa Clara County, California, 1993-2006. Peer Journal, 1, e18. http://dx.doi.org/10.7717/peerj.18
- Scarlett, J. and Johnston, N. (2012) Impact of a Subsidized Spay Neuter Clinic on Impoundments and Euthanasia in a Community Shelter and on Service and Complaint Calls to Animal Control. Journal of Applied Animal Welfare Science, 15, 53-69. http://dx.doi.org/10.1080/10888705.2012.624902
- White, S.C., Jefferson, E. and Levy, J.K. (2010) Impact of Publicly Sponsored Neutering Programs on Animal Population Dynamics in Animal Shelters: The New Hampshire and Austin Experiences. Journal of Applied Animal Welfare Science, 13, 191-212. http://dx.doi.org/10.1080/10888700903579903
- Frank, J. and Carlisle-Frank, P. (2007) Analysis of Programs to Reduce Overpopulation of Companion Animals: Do Adoption and Low-Cost Spay/Neuter Programs Merely Cause Substitution of Sources? Ecological Economics, 62, 740-746. http://dx.doi.org/10.1016/j.ecolecon.2006.09.011
- Kortis, B. (2013) Why, How and Applying for PetSmart Charities Funding. Texas Unites for Animals Conference, Austin. http://www.texasunites.com/handouts/2013/20_Targeted%20TNR_Kortis.pdf
- Esri (2012) Esri Community Analyst: Reports Reference Guide.