World Journal of Neuroscience
Vol.4 No.3(2014), Article ID:46654,9 pages
DOI:10.4236/wjns.2014.43025
Identification of Genetic Variants Underlying Anxiety and Multiple Sclerosis in Heterogeneous Stock Rats
Amelie Baud1, Jonathan Flint2, Alberto Fernandez-Teruel3, The Rat Genome Sequencing Mapping Consortium*
1EMBL-EBI, Wellcome Trust Genome Campus, Hinxton, UK
2Wellcome Trust Centre for Human Genetics, Oxford, UK
3Medical Psychology Unit, Department of Psychiatry & Forensic Medicine, Institute of Neurosciences, Universitat Autònoma de Barcelona, Barcelona, Spain.
Email: abaud@rip.ens-cachan.fr
Copyright © 2014 by authors and Scientific Research Publishing Inc.
This work is licensed under the Creative Commons Attribution International License (CC BY).
http://creativecommons.org/licenses/by/4.0/


Received 1 May 2014; revised 2 June 2014; accepted 7 June 2014
ABSTRACT
Identifying genetic variants that contribute to phenotypic variation is expected to provide insights into the etiology of complex traits. Here we show how combining genetic mapping in an outbred population of rats with sequence data from the progenitors of the population made it possible to identify causal variants and genes for a large number of phenotypes. We identified 355 genomic loci contributing to 122 measures relevant to six models of disease, including fear-related behaviors and experimental autoimmune encephalomyelitis. At 35 of those loci we identified the responsible gene, and in some cases, the responsible variant.
Keywords:Genetic Mapping, Imputation, Causal Variants, Anxiety, Multiple Sclerosis, Complex Traits

1. Introduction
Genome-wide association studies have been very successful at identifying regions of the genome where genetic variation is correlated (“associated”) with phenotypic variation (Quantitative Trait Loci, QTLs), but identifying the causal variants underlying the QTLs remains a challenge. Finding causal variants (single nucleotide poly- morphisms (SNPs), insertions, deletions and other structural variants) can provide insights into the etiology of the trait by identifying the responsible genes and highlighting the mechanisms involved (e.g. change in protein sequence, regulation of gene expression). The rat Genome Sequencing and Mapping (RGSM) Consortium reported in an article [1] published in Nature Genetics last year the identification of 35 causal genes for 31 phenotypes including models of anxiety, multiple sclerosis and four other diseases (Table 1). Our study combined genome-wide association mapping with whole-genome sequence data in a population of 1407 outbred, Heterogeneous Stock rats. Here we give an overview of the study and present those results that are relevant to behaviour and neurosciences. We also point the reader to a web-based, user-friendly viewer where the data and results of our study can be explored in details.
2. Genetic Contribution to Phenotypic Variation and Genetic Mapping
Genetic mapping in the rat NIH Heterogeneous Stock (HS) identifies QTLs at sufficiently high resolution to enable the search for causal variants and genes. The NIH-HS is descended from eight inbred strains (BN/SsN, MR/N, BUF/N, M520/N, WN/N, ACI/N, WKY/N and F344/N) through more than sixty generations of circular breeding [2] [3] (Figure 1). Because a large number of recombination events have accumulated over the generations, each HS rat is a fine-grained mosaic of the eight progenitor genomes (Figure 1). As a result, it is possible to precisely map the genetic variants that contribute to phenotypic variation.
The RGSM Consortium collected in 2006 HS rats 160 measures relevant to at least six models of disease: anxiety, type 2 diabetes, hypertension, obesity, osteoporosis, and multiple sclerosis. The phenotyping pipeline was designed so that collecting one measure would affect measures collected at a later point as little as possible [3] [4] . For genetic mapping, 1407 of these rats were also genotyped at 265,551 SNPs spread throughout the genome. Using these genotypes and a mixed model approach [5] , we estimated the proportion of phenotypic variation attributable to additive genetic effects (heritability) to range between 4 and 74% across the 160 measures.
We next sought to identify genomic loci contributing to phenotypic variation. Genetic mapping in the HS is best performed using haplotype mapping [6] , so we first reconstructed the chromosomes of the HS rats as mosaics of the progenitor haplotypes (a haplotype is a coloured block in Figure 1). To do so, we compared at each locus the genotypes of each HS rat with the genotypes of the progenitors using a method called a Hidden Markov Model [6] . We then tested whether one or more of the progenitor haplotypes was associated with phenotypic variation at each locus.

Table 1. Summary of phenotypes collected.
We identified 355 QTLs for 122 measures at a false discovery rate of 10% (Figure 2). These QTLs explain on average 42% of the phenotypic variation of genetic origin, contrasting with studies in humans where typically less than 10% of the heritable phenotypic variation is explained by known QTLs. This difference is likely due to the absence of rare variants, whose effects are very difficult to detect, in the rat HS [1] .
The median size of the 90% confidence intervals for the QTLs identified in the HS was 4.5 Mb, which compares very well with more traditional mapping populations such as F2 crosses, where QTLs are typically 80 Mb wide and encompass 800 genes [7] . Because the QTLs mapped in the HS still comprise more than 40 genes on average, we used sequence data to try to narrow down the list of candidate genes at the QTLs.
3. Combining Sequence Data with Genetic Mapping to Identify Causal Genetic Variants and Genes
To identify causal variants using genetic mapping, genotypes for every single variant segregating in the population are required. It is possible to obtain this information in the HS by sequencing only the eight progenitors and
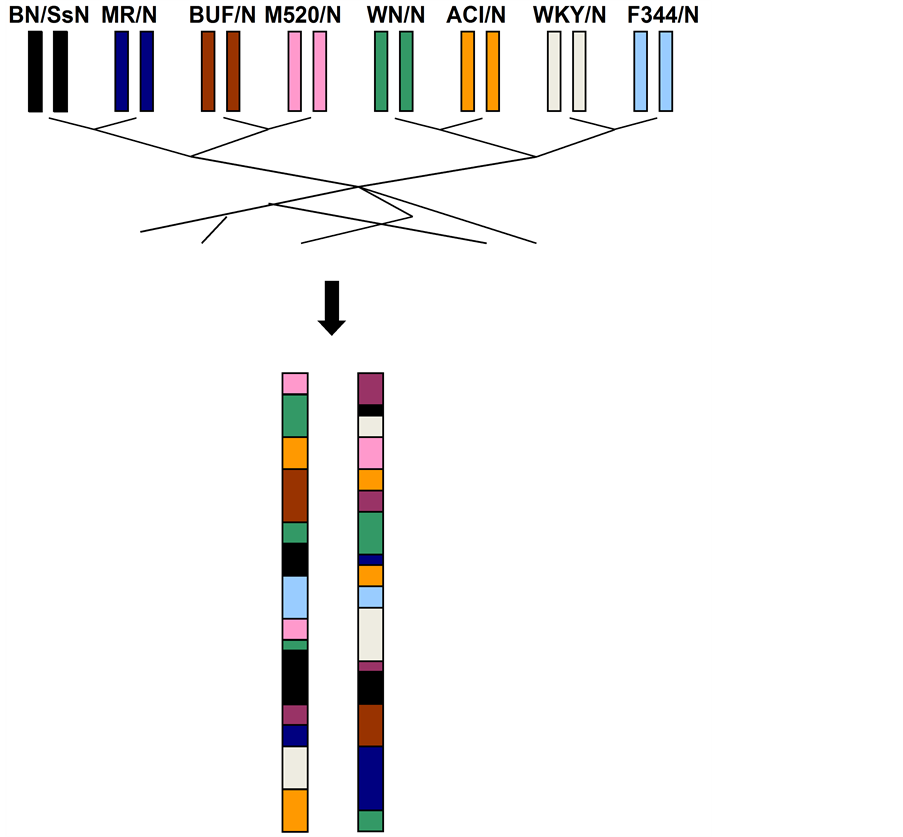
Figure 1. The NIH Heterogeneous Stock. The NIH Heterogeneous Stock is descended from eight inbred progenitors through more than 60 generations of outbreeding. As a result, each HS rat chromosome is a fine-grained mosaic of the progenitor genomes (a pair of homologous chromosomes is shown). This mosaic can be reconstructed from the genotypes of the HS rats and the eight progenitors. It is used to map QTLs in the HS and to leverage sequence data from the progenitors to the HS rats. A large number of sequence variants exist within each haplotype (i.e. block).
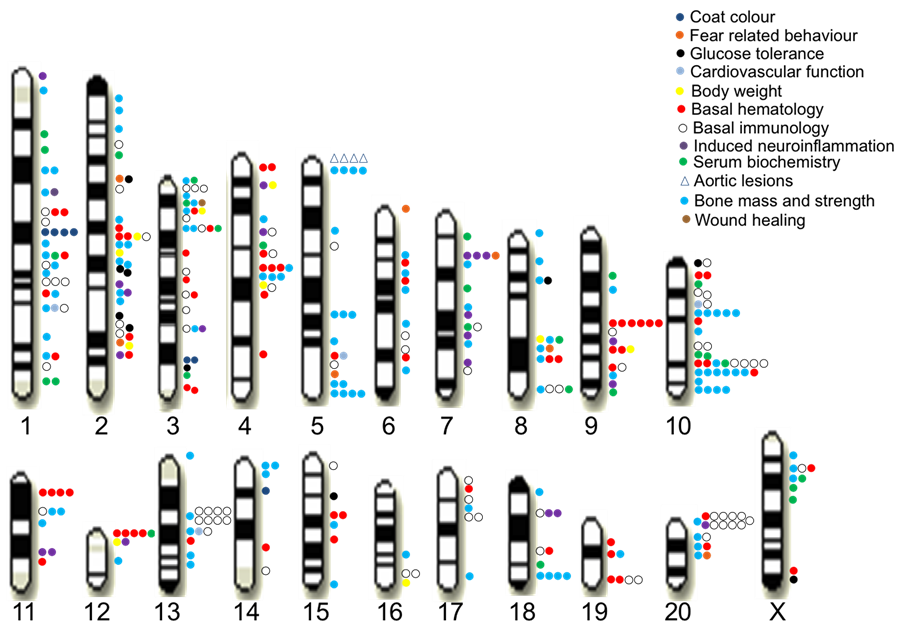
Figure 2. QTLs identified for 160 measures in the rat HS.
then reconstructing the sequence of each HS chromosome as a mosaic of the progenitor genomes. The RGSM Consortium used next-generation technology to sequence the HS progenitors. Virtually all variants that exist between the progenitors of the HS were identified in the regions of the genome accessible to next generation sequencing (about 85% of the genome). A total of 7.2 million SNPs, 633,000 small insertions/deletions and 44,000 larger variants were catalogued. Having reconstructed the HS chromosomes as mosaics of the progenitor genomes, we were able to impute the variant callsin the HS rats and thereby virtually genotype each HS rat at each of the sequence variants.
We used a statistical test called “merge analysis” to identify potential causal variants among the variants present at the QTL [8] . Briefly, for each variant present at the QTL, merge analysis compares two models for phenotypic variation: one based on the genotypes at the variant, and one based on the progenitor haplotypes. If the QTL arises from a single causal variant, the genotypic model for this variant will be more significant than the haplotypic model. Therefore, variants for which the genotypic model is more significant than the haplotypic model have the potential to underlie the QTL, and we called them “candidate variants” (Figure 3).
A surprising finding of our study was the high proportion (44%) of QTL without candidate variants, which suggests that they arise from multiple causal variants. At those QTLs with “candidate variants” however, merge analysis helped us to identify the causal variant and/or gene. We describe three situations where we were able to identify the causal factor with confidence.
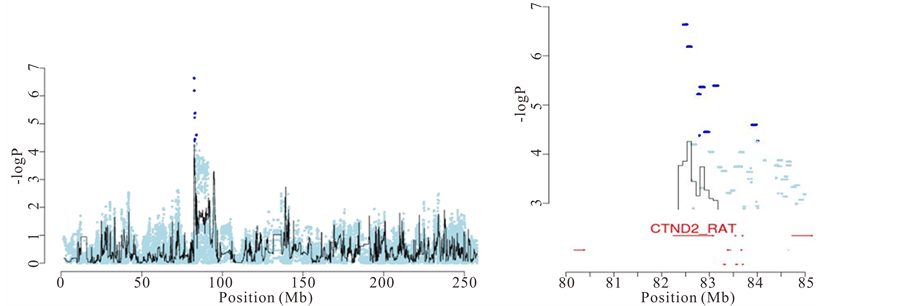
First, there are QTLs where only one gene contains “candidate variants” (as defined by merge analysis). One example is a QTL on chromosome 2 for “response latency” in the two-way active avoidance task in the shuttle box. Figure 4(a) shows that Catenin delta 2 is the only gene at the QTL that has “candidate variants”, and is therefore likely to be the causal gene. The mean “response latency” in a single 40-trial session of the shuttle box task (i.e. the average latency to cross to the opposite compartment in presence of the conditioned-avoidance response-or the unconditioned-escape response-stimulus) represents the efficiency to acquire that conflict/anxietydriven learning task. It is a validated rat measure of anxiety, as shown by behavioural, psychopharmacological and lesion studies [9] -[13] . Catenin-delta 2 (Ctnnd2) is a protein found in complexes with cadherin cell adhesion molecules at neuronal synapses. It has been shown to have a role in hippocampal plasticity and function, as well
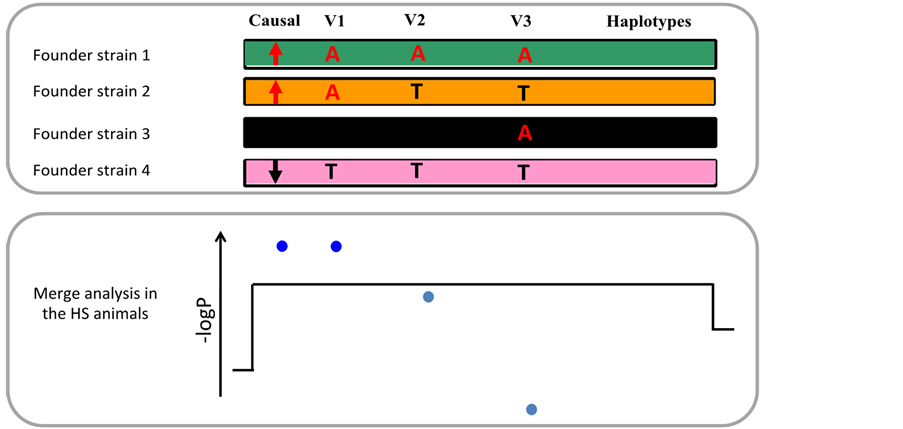
Figure 3. Merge analysis identifies “candidate” variants. For simplicity a population with only four progenitor strains is shown. The upper panel shows a segment of the genomes of the progenitors, and four SNPs, one of which is causal for the QTL. The lower panel shows the significance of the association (expressed as −logP) between phenotype and progenitor haplotypes (black line), and between phenotype and each of the four variants (blue dots). The progenitor haplotypes always capture the QTL effect because the causal alleles segregate with the haplotypes they are on. The strain distribution pattern (SDP) of V1 is the same as that of the causal SNP (one allele in progenitors 1 and 2, the other in progenitors 3 and 4). Therefore, V1 and the causal SNP are perfectly correlated in the HS. It results that genotypic variation at V1 explains phenotypic variation as well as haplotypic variation does, and the association of V1 with the phenotype is more significant than that of the haplotypes. Contrastingly, the SDP of V3 is uncorrelated to that of the causal variants, so that V3 and the causal variant are uncorrelated in the HS animals, and V3 is not associated with the phenotype. The SDP of V2 is imperfectly correlated with that of the causal variant, so that V2 and the causal variant are imperfectly correlated in the HS. As a consequence, genotypic variation at V2 does not capture the QTL effect as well as haplotypic variation does. The two variants that capture the QTL effect as well as the haplotypes are called “candidate variants” and are coloured dark blue.
as in hippocampus-dependent tasks such as spatial learning and contextual fear conditioning, as evidenced by Ctnnd2 knockout mice [14] . These findings appear to indicate a role of Ctnnd2 in response latency in the shuttle box test, as the two-way avoidance task is known to be hippocampus-dependent, and strongly related to contextual fear conditioning and anxiety [11] [13] .
Second, merge analysis helped identify causal variants when one of the “candidate variants” was predicted to affect protein structure. Thus, we identified a candidate variant in ABCB10 that was predicted to alter the transporter function of ABCB10 and in turn affect mean red blood cell volume. ABCB10 is a mitochondrial transporter whose role in erythroid differentiation has been demonstrated [15] -[17] .
Finally, merge analysis contributed to the understanding of experimental autoimmune encephalomyelitis (EAE), a neuroinflammatory disease that constitutes a validated rat model of multiple sclerosis [18] . The major histocompatibility complex (MHC) class II region on chromosome 20 (named Eae1) is known to influence EAE susceptibility, although attempts to identify the responsible gene have had limited success. We were able to prioritise genes at the QTLs based on their proximity with the most significant “candidate variants”. For example, at a QTL for severity of EAE located in the major histocompatibility complex (MHC), one of the three most highly associated “candidate variants” was in an intron of Btnl2 and another was 274 bp upstream of RT1-Db1, both in the MHC class II region in chromosome 20 (Figure 4(b)).
This study by the RGSM Consortium demonstrates the power of coupling sequence data with genetic mapping in model organism populations of known ancestry to identify variants and genes controlling complex traits. The genetic mapping results and sequence data are available for other investigators to explore in more details at http://mus.well.ox.ac.uk/gscandb/rat Guidelines for this web-based viewer can be found in a supplementary note to our Nature Genetics article [1] . All the data are available from public repositories and are described in details in Baud et al. [19] .
 (a)
(a)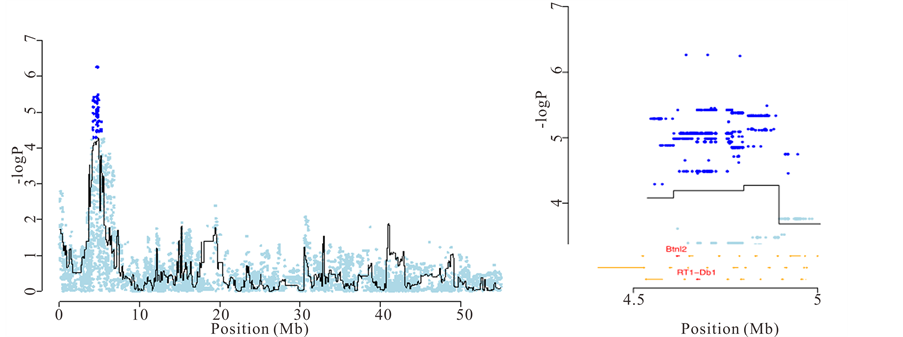 (b)
(b)
Figure 4. Identification of causal genes for anxiety and experimental autoimmune encephalomyelitis. (a) Left: association between latency to cross to the other compartment in the shuttle box and a locus on chromosome 2. Right: Zoom on the chromosome 2 QTL and identification of Ctnnd2 as the causal gene using merge analysis; (b) Left: association between weight loss due to EAE and the major histocompatibility locus on chromosome 20. Right: Zoom on the chromosome 20 QTL and identification of Btln2 and RT1-Db1 as the most likely causal genes.
Acknowledgements
The funders we would like to acknowledge are as follows: the European Union’s Seventh Framework Programme (FP7/2007-2013) under grant agreement HEALTH-F4-2010-241504 (EURATRANS); the European Union’s Sixth Framework Programme EURATools (grant LSHG-CT-2005-019015); The Wellcome Trust (090532/Z/09/Z, 083573/Z/07/Z, 089269/Z/09/Z); the “Ministerio de Ciencia e Innovación” (ref.PSI2009-10532), the “Fundació La Marató de TV3” (ref. 092630) and the “Direcció General de la Recerca” (ref. 2009SGR-0051).
References
- Baud, A., Hermsen, R., Guryev, V., Stridh, P., Graham, D., McBride, M.W., et al. (2013) Combined Sequence-Based and Genetic Mapping Analysis of Complex Traits in Outbred Rats. Nature Genetics, 45, 767-775.
- Hansen, C. and Spuhler, K. (1984) Development of the National Institutes of Health Genetically Heterogeneous Rat Stock. Alcoholism: Clinical and Experimental Research, 8, 477-479. http://dx.doi.org/10.1111/j.1530-0277.1984.tb05706.x
- Johannesson, M., Lopez-Aumatell, R., Stridh, P., Diez, M., Tuncel, J., Blazquez, G., et al. (2009) A Resource for the Simultaneous High-Resolution Mapping of Multiple Quantitative Trait Loci in Rats: The NIH Heterogeneous Stock. Genome Research, 19, 150-158. http://dx.doi.org/10.1101/gr.081497.108
- Solberg, L.C., Valdar, W., Gauguier, D., Nunez, G., Taylor, A., Burnett, S., et al. (2006) A Protocol for HighThroughput Phenotyping, Suitable for Quantitative Trait Analysis in Mice. Mammalian Genome, 17, 129-146.
- Kang, H.M., Zaitlen, N.A., Wade, C.M., Kirby, A., Heckerman, D., Daly, M.J., et al. (2008) Efficient Control of Population Structure in Model Organism Association Mapping. Genetics, 178, 1709-1723.
- Mott, R., Talbot, C.J., Turri, M.G., Collins, A.C. and Flint, J. (2000) A Method for Fine Mapping Quantitative Trait Loci in Outbred Animal Stocks. Proceedings of the National Academy of Sciences of the United States of America, 97, 12649-12654.
- Flint, J. (2011) Mapping Quantitative Traits and Strategies to Find Quantitative Trait Genes. Methods, 53, 163-174.
- Yalcin, B., Flint, J. and Mott, R. (2005) Using Progenitor Strain Information to Identify Quantitative Trait Nucleotides in Outbred Mice. Genetics, 171, 673-681.
- Diaz-Moran, S., Palencia, M., Mont-Cardona, C., Canete, T., Blazquez, G., Martinez-Membrives, E., et al. (2012) Coping Style and Stress Hormone Responses in Genetically Heterogeneous Rats: Comparison with the Roman Rat Strains. Behavioural Brain Research, 228, 203-210.
- Fernandez-Teruel, A., Escorihuela, R.M., Nunez, J.F., Zapata, A., Boix, F., Salazar, W., et al. (1991) The Early Acquisition of Two-Way (Shuttle-Box) Avoidance as an Anxiety-Mediated Behavior: Psychopharmacological Validation. Brain Research Bulletin, 26, 173-176. http://dx.doi.org/10.1016/0361-9230(91)90205-X
- Gray, J.A. (1982) The Neuropsychology of Anxiety: An Enquiry into the Functions of the Septo-Hippocampal System. Oxford University Press, Oxford, 548 p.
- Lopez-Aumatell, R., Vicens-Costa, E., Guitart-Masip, M., Martinez-Membrives, E., Valdar, W., Johannesson, M., et al. (2009) Unlearned Anxiety Predicts Learned Fear: A Comparison among Heterogeneous Rats and the Roman Rat Strains. Behavioural Brain Research, 202, 92-101. http://dx.doi.org/10.1016/j.bbr.2009.03.024
- Vicens-Costa, E., Martinez-Membrives, E., Lopez-Aumatell, R., Guitart-Masip, M., Canete, T., Blazquez, G., et al. (2011) Two-Way Avoidance Acquisition Is Negatively Related to Conditioned Freezing and Positively Associated with Startle Reactions: A Dissection of Anxiety and Fear In Genetically Heterogeneous Rats. Physiology & Behavior, 103, 148-156. http://dx.doi.org/10.1016/j.physbeh.2010.12.009
- Israely, I., Costa, R.M., Xie, C.W., Silva, A.J., Kosik, K.S. and Liu, X. (2004) Deletion of the neuron-Specific Protein Delta-Catenin Leads to Severe Cognitive and Synaptic Dysfunction. Current Biology, 14, 1657-1663.
- Shirihai, O.S., Gregory, T., Yu, C., Orkin, S.H. and Weiss, M.J. (2000) ABC-me: A Novel Mitochondrial Transporter Induced by GATA-1 during Erythroid Differentiation. The EMBO Journal, 19, 2492-2502.
- Hyde, B.B., Liesa, M., Elorza, A.A., Qiu, W., Haigh, S.E., Richey, L., et al. (2012) The Mitochondrial Transporter ABC-me (ABCB10), a Downstream Target of GATA-1, Is Essential for Erythropoiesis in Vivo. Cell Death & Differentiation, 19, 1117-1126.
- Veyrieras, J.B., Kudaravalli, S., Kim, S.Y., Dermitzakis, E.T., Gilad, Y., Stephens, M., et al. (2008) High-Resolution Mapping of Expression-QTLs Yields Insight into Human Gene Regulation. PLOS Genetics, 4, Article ID: e1000214.
- Wallstrom, E. and Olsson, T. (2008) Rat Models of Experimental Autoimmune Encephalomyelitis. In: Conn, P.M., Ed., Sourcebook of Models for Biomedical Research, Humana Press, Totowa, 547-556. http://dx.doi.org/10.1007/978-1-59745-285-4_56
- Baud, A., Guryev, V., Hummel, O. and Johannesson, M., The Rat Genome Sequencing and Mapping Consortium and Flint, J. (2014) Genomes and Phenomes of a Population of Outbred Rats and Its Progenitors. Scientific Data, 1, Article ID: 140011.
Rat Genome Sequencing and Mapping Consortium*
Phenotyping group
Sophie Calderari, Dominique Gauguier, Pernilla Stridh, Margarita Diez, Johan Ockinger, Amennai D. Beyeen, Alan Gillett, Nada Abdelmagid, Andre Ortlieb Guerreiro-Cacais, Maja Jagodic, Tomas Olsson, Martina Johannesson, Jonatan Tuncel, Ulrika Norin, Rikard Holmdahl, Delyth Graham, Elisabeth Beattie, Ngan Huynh, William H. Miller, Martin W. McBride, Anna F. Dominiczak, Daniel L. Koller, Tatiana Foroud, Imranul Alam, Samreen Falak, Norbert Hubner, Mary Osborne-Pellegrin, Esther Martinez-Membrives, Regina Lopez-Aumatell, Toni Canete, Gloria Blazquez, Elia Vicens-Costa, Carme Mont-Cardona, Sira Diaz-Moran, Adolf Tobena, Alberto Fernandez-Teruel
High-density genotyping array design and analysis group
Oliver Hummel, Diana Zelenika, Kathrin Saar, Giannino Patone, Anja Bauerfeind, Marie-Therese Bihoreau, Matthias Heinig, Young-Ae Lee, Carola Rintisch, Herbert Schulz, David A. Wheeler, Kim C. Worley, Donna M. Muzny, Richard A. Gibbs, Mark Lathrop, Norbert Hubner
Sequencing group
Roel Hermsen, Oliver Hummel, Nico Lansu, Giannino Patone, Pim Toonen, Frans Paul Ruzius, Ewart de Bruijn, Heidi Hauser, Santosh S. Atanur, Tim J. Aitman, Paul Flicek, David J. Adams, Thomas Keane, Kathrin Saar, Norbert Hubner, Victor Guryev, Edwin Cuppen
Protein structure group
Tomas Malinauskas, E. Yvonne Jones
QTL data analysis group
Amelie Baud, Jonathan Flint, Diana Ekman, Richard Mott
Project coordination
Amelie Baud, Regina Lopez-Aumatell, Anna F. Dominiczak, Norbert Hubner, Martina Johannesson, Rikard Holmdahl, Tomas Olsson, Dominique Gauguier, Alberto Fernandez-Teruel, Richard Mott, Edwin Cuppen, Jonathan Flint.
Affiliations
Hubrecht Institute, Koninklijke Nederlandse Akademie van Wetenschappen and University Medical Center Utrecht, Utrecht, The Netherlands.
Roel Hermsen, Victor Guryev, Nico Lansu, Pim Toonen, Frans Paul Ruzius, Ewart de Bruijn Edwin Cuppen
European Research Institute for the Biology of Ageing, Rijksuniversiteit Groningen, Universitair Medisch Centrum Groningen, Groningen, The Netherlands.
Victor Guryev
Neuroimmunology Unit, Department of Clinical Neuroscience, Centre for Molecular Medicine, Karolinska Institutet, Stockholm, Sweden.
Pernilla Stridh, Margarita Diez, Johan Ockinger, Amennai D Beyeen, Alan Gillett, Nada Abdelmagid, Andre Ortlieb Guerreiro-Cacais, Maja Jagodic Tomas Olsson
British Heart Foundation (BHF) Glasgow Cardiovascular Research Centre, Institute of Cardiovascular Medical Sciences, Glasgow University, Glasgow, UK.
Delyth Graham, Martin W. McBride, Elisabeth Beattie, Ngan Huynh, William H. Miller ; Anna F. Dominiczak
Department of Medical and Molecular Genetics, Indiana University School of Medicine, Indianapolis, Indiana, USA.
Tatiana Foroud Daniel L. Koller
Institut National de la Santé et de la Recherche Médicale (INSERM) Unité Mixte de Recherche Scientifique (UMRS) 872, Cordeliers Research Centre, Paris, France.
Sophie Calderari Dominique Gauguier
Department of Medical Biochemistry and Biophysics, Division of Medical Inflammation Research, Karolinska Institutet, Stockholm, Sweden.
Jonatan Tuncel, Ulrika Norin, Diana Ekman, Martina Johannesson Rikard Holmdahl
Department of Orthopedic Surgery, Indiana University School of Medicine, Indianapolis, Indiana, USA.
Imranul Alam
Max-Delbruck Center for Molecular Medicine, Berlin, Germany.
Samreen Falak, Oliver Hummel, Kathrin Saar, Giannino Patone, Anja Bauerfeind, Matthias Heinig, Young-Ae Lee, Carola Rintisch, Herbert Schulz Norbert Hubner
INSERM U698, Hôpital Bichat, Paris, France.
Mary Osborne-Pellegrin
Medical Psychology Unit, Department of Psychiatry Forensic Medicine, Institute of Neurosciences, Universitat Autònoma de Barcelona, Bellaterra, Barcelona, Spain.
Esther Martinez-Membrives, Toni Canete, Gloria Blazquez, Elia Vicens-Costa, Carme Mont-Cardona, Sira Diaz-Moran, Adolf Tobena, Regina Lopez-Aumatell Alberto Fernandez-Teruel
Commissariat à l’Energie Atomique, Institut de Génomique, Centre National de Génotypage, Evry, France.
Diana Zelenika, Marie-Therese Bihoreau Mark Lathrop
Department of Computational Biology, Max Planck Institute for Molecular Genetics, Berlin, Germany.
Matthias Heinig
Pediatric Allergology, Experimental and Clinical Research Center, Charité Universittsmedizin Berlin, Berlin, Germany.
Young-Ae Lee
Human Genome Sequencing Center, Baylor College of Medicine, Houston, Texas, USA.
David A. Wheeler, Kim C. Worley, Donna M. Muzny Richard A. Gibbs
The Wellcome Trust Sanger Institute, Hinxton, Cambridge, UK.
Heidi Hauser, David J. Adams Thomas Keane
Physiological Genomics and Medicine Group, Medical Research Council Clinical Sciences Centre, Faculty of Medicine, Imperial College London, Hammersmith Hospital, London, UK.
Santosh S. Atanur Tim J. Aitman
European Bioinformatics Institute, Wellcome Trust Genome Campus, Cambridge, UK.
Paul Flicek
DZHK (German Centre for Cardiovascular Research), Partner site Berlin, Berlin, Germany.
Norbert Hubner
Division of Structural Biology, Wellcome Trust Centre for Human Genetics, University of Oxford, UK.
Tomas Malinauskas, E. Yvonne Jones
Wellcome Trust Centre for Human Genetics, University of Oxford, UK.
NOTES

*The investigators of the Rat Genome Sequencing and Mapping Consortium are listed in the supplementary file Investigators_RGSMC.docx.