Open Journal of Ecology Vol.05 No.04(2015), Article ID:55279,9
pages
10.4236/oje.2015.54010
Optimal Control of a Threatened Wildebeest-Lion Prey-Predator System in the Serengeti Ecosystem
T. D. Sagamiko1, N. Shaban1, C. L. Nahonyo2, O. D. Makinde3
1Department of Mathematics, University of Dar es Salaam, Dar es Salaam, Tanzania
2Department of Zoology and Wildlife Conservation, University of Dar es Salaam, Dar es Salaam, Tanzania
3Faculty of Military Science, Stellenbosch University, Stellenbosch, South Africa
Email: tsagamiko@gmail.com, shabanmbare@gmail.com, nahonyo@udsm.ac.tz, makinded@gmail.com
Copyright © 2015 by authors and Scientific Research Publishing Inc.
This work is licensed under the Creative Commons Attribution International License (CC BY).
http://creativecommons.org/licenses/by/4.0/


Received 7 February 2015; accepted 26 March 2015; published 1 April 2015
ABSTRACT
We develop a two-species prey-predator model in which prey is wildebeest and predator is lion. The threats to wildebeest are poaching and drought while to lion are retaliatory killing and drought. The system is found in the Serengeti ecosystem. Optimal control theory is applied to investigate optimal strategies for controlling the threats in the system where anti-poaching patrols are used for poaching, construction of strong bomas for retaliatory killing and construction of dams for drought control. The possible impact of using a combination of the three controls either one at a time or two at a time on the threats facing the system is also examined. We observe that the best result is achieved by using all controls at the same time, where a combined approach in tackling threats to yield optimal results is a good approach in the management of wildlife populations.
Keywords:
Optimal Control, Prey-Predator System, Threat, Poaching, Serengeti

1. Introduction
Population dynamics is the dominant branch of mathematical biology that deals with forces affecting changes in population densities or affecting the form of population growth. It is clear that predator population depends on their prey species for survival and affects the survival and fecundity rate of prey species. Therefore, predator population is affected by changes in prey population in a complex and cyclic predator-prey relationship [1] .
Many biological species have been driven to extinction and many others are at the verge of extinction due to several external forces such as over exploitation, predation, environmental pollution and mismanagement of the habitat [2] . Thus problems affecting wild animals and their habitats should be evaluated to ensure sustainable conservation of wildlife populations [3] .
Environmental pollution, catastrophes and mismanagement of the habitat may cause reduction of species population and probably lead to extinction due to perturbation of the system. Hazards such as fire and drought can also cause the decline of species in an ecosystem [4] . For example, the dry season drought of 1993 in the Serengeti ecosystem is a strong and well studied pertubation. Rainfall during the dry season was only 25% of the lowest previously recorded level, and directly led to the death of about 30% of the wildebeest and perhaps 40% to 50% of the total park population of the large mammals [5] . However, according to Holling, Serengeti is highly resilient system as it has historically absorbed a wide range of pertubations. Despite being resilient, the time interval for the system to return to its equilibrium seems to be long hence the need of control arises. For example, it took seven years for the wildebeest population to recover from 1993 severe drought and about six years for the lion population from 1994 Canine distemper virus [5] .
Kideghesho [6] , mentions poaching of wildelife to be among the main threats facing the Serengeti ecosystem. Poaching has become a threat to many migratory populations, particularly as human populations around protected areas increase [7] [8] . It has been reported that local consumption of bushmeat from the Serengeti National Park and surrounding areas is responsible for approximately 70,000 - 129,000 wildebeest deaths per year [9] and any further increase in the amount of poaching could lead to decline in the wildebeest population in the Serengeti-Mara ecosystem [10] . However, lion killing not only in the Serengeti ecosystem but for the entire East Africa is mainly due to Maasai retaliation as lions prey their livestock [11] . In his 19 months study, Kissui [12] , recorded 85 lions killings in 12 villages by Maasai retaliation. This happens because many parts of Maasai land have been preserved as wildelife protected areas (e.g. Serengeti, Tarangire and Amboseli) and Game reserves (e.g. Mkomazi and Loliondo) but none of these protected areas are fenced and lions are reported to frequently kill Maasai cattle in adjacent rangelands [13] .
Few studies on optimal control of Prey-Predator system such as those by Chakraborty et al., [1] , Kar and Ghosh [14] have determined various optimal control strategies. In particular, Kar and Ghosh [14] controlled alternative food to predator to an exploited prey-predator system. However, none of these studies have considered the aspect of drought, poaching and retaliatory killing as threats to be controlled for survival of prey-predator system particularly wildebeest and lions in the Serengeti ecosystem. Therefore, this study intends to apply optimal control theory to maximize Wildebeest-Lion prey-predator population in the Serengeti Ecosytem under threat of drought, poaching and retaliatory killings and ensuring the cost of applying these controls is minimum.
This paper is organized as follows: In Section 2, a threatened prey-predator model is developed. In Section 3, time-dependent controls are introduced and analysis of optimal control is carried out. In Section 4, scenarios for different control strategies are considered and the results are discussed. Lastly, Section 5 presents conclusions about the proposed control strategies suggested for this threatened system. The outcome tends to display a significant increase in the number of individuals due to control strategies employed.
2. The Model with Threats
Consider two populations of different species:
 a prey population,
and
a prey population,
and , a predator
population. The prey species is wildebeest and predator species is lion. Drought
affect both species, while wildebeest is threatened by poaching lion is threatened
by retaliatory killing. Prey species are assumed to grow logistically to the carrying
capacity in the absence of the predator, poaching and drought, hence these are only
causes of prey mortality. The rate of increase of the predator population depends
on the amount of prey biomass it converts as food. Thus according to Hollying type
II functional response [15] the two populations are modeled as follows:
, a predator
population. The prey species is wildebeest and predator species is lion. Drought
affect both species, while wildebeest is threatened by poaching lion is threatened
by retaliatory killing. Prey species are assumed to grow logistically to the carrying
capacity in the absence of the predator, poaching and drought, hence these are only
causes of prey mortality. The rate of increase of the predator population depends
on the amount of prey biomass it converts as food. Thus according to Hollying type
II functional response [15] the two populations are modeled as follows:
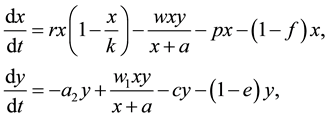 (1)
(1)
where x is the prey density at time t, y is the predator density at time t, r is
the intrinsic prey growth rate, k is the prey carrying capacity, w is the maximum
per capita predation rate,
 is the predator
biomass to the prey (conversion rate), p is the wildebeest poaching rate in Serengeti,
c is lion death rate due to retaliatory killing, f is the percentage of wildebeest
resilient to drought, hence
is the predator
biomass to the prey (conversion rate), p is the wildebeest poaching rate in Serengeti,
c is lion death rate due to retaliatory killing, f is the percentage of wildebeest
resilient to drought, hence
 is the wildebeest death rate due to drought, e is the percentage of lion resilient
to drought, hence
is the wildebeest death rate due to drought, e is the percentage of lion resilient
to drought, hence
 is the lion death rate due to drought, a is the predator half saturation and
 is the lion mortality rate.
3. The Model with Time Dependent Control Effort
We introduce into model (1), time dependent control efforts on anti-poaching patrols , construction
of strong bomas
, construction
of strong bomas ,
and construction of dams
,
and construction of dams
 as controls to curtail the threats to the prey-predator system. The prey-predator
model (1) thus becomes:
as controls to curtail the threats to the prey-predator system. The prey-predator
model (1) thus becomes:
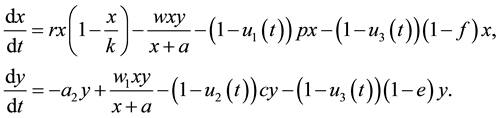 (2)
(2)
3.1. Analysis of Optimal Control
The objective is to maximize the species population size at the final time of control
while minimizing the cost. These costs are due to control strategies applied such
as cost of antipoaching, construction of strong bomas and conservation cost for
drought control. We assume the total population
 is to be maximized to the final time, with different relative weights applied to
prey and predator populations. For simplicity we take
is to be maximized to the final time, with different relative weights applied to
prey and predator populations. For simplicity we take
 as
as ,
,
 as
as
 and
and
 as
as .
Thus the objective function is:
.
Thus the objective function is:
 , (3)
, (3)
where ,
,
 ,
,
 ,
,
 ,
,
 are
positive weights. The term
are
positive weights. The term
 is the cost of control efforts on antipoaching strategy,
 is
the cost of control efforts on construction of strong boma and
is
the cost of control efforts on construction of strong boma and
 is the cost of drought control strategy. We seek an optimal control triple
 ,
,
 and
and
 such that
 ,
, (4)
,
, (4)
where
 such that
 are lebesgue measurable with
 ,
,
 and
and
 for
for
 is the control set.
3.2. Characterization of the Optimal Control
Pontryagin’s maximum principle which provides necessary condition, converts Equations
(2) and (3) into a problem of maximizing point-wise a Hamiltonian , with respect
to
, with respect
to ,
,
 and
and .
.
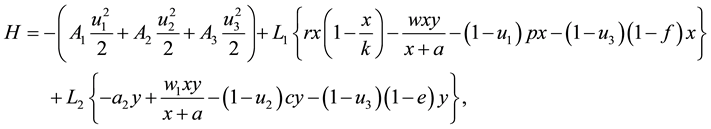 (5)
(5)
where
 and
and
 are the adjoint variables or co-state variables.
Theorem 1. For the optimal control tripple ,
,
 and
and
 that maximizes
 over
over ,
then there exists adjoint variables
,
then there exists adjoint variables
 and
and
 satisfying
 (6)
(6)
 (7)
(7)
and with transversality condition as
 and
and ,
see [10] .
,
see [10] .
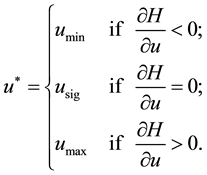
By optimality condition, we have
 at
at ,
,
That is
 at
at ,
,
 at
at
 and
and
 at
at
 (8)
(8)
but:
 (10)
(10)
Hence .
(11)
.
(11)
 , (12)
Hence .
(13)
.
(13)
 , (14)
Hence .
(15)
.
(15)
Equivalently, we can represent the optimal control as
 , (16)
 , (17)
and .
(18)
.
(18)
The optimal control can be numerically calculated under various parameter sets using a forward-backward sweep method involving fourth order Runge-Kutta procedure. The successive steps are as follows (see example, Kar & Ghosh, 2012 [14] ).
1) Divide the total time interval into
 equal subintervals and set the state at different times as
 and the costate variables as
 .
.
2) Assume control takes zero over the time intervals i.e.
 for
starting iteration.
for
starting iteration.
3) Using the initial condition
 solve the state according to the ODE with the values of
 forwardly.
4) Using the transversality condition ,
,
 and
the values for
and
the values for
 as well as previously evaluated values for
 ,
solve
,
solve
 in time from costate differential equation in backward process.
5) Update the control entering the new
 and
and
 through the rule

where
4. Numerical Results and Discussion
In this section we study numerically an optimal control of a threatened prey-predator system.
Let us take the system parameters
 [5] ,
[5] ,
 [5] ,
[5] ,
 [11] ,
 [16] ,
 [17] ,
 [17] ,
 [18] ,
 [18] ,
 [assumed],
 [calculated],
together with the initial guess states
[calculated],
together with the initial guess states
 and
and .
Assume the weights for prey and predator at final time are being kept fixed as
.
Assume the weights for prey and predator at final time are being kept fixed as
 and
and .
However the weights of controls
.
However the weights of controls ,
,
 and
and
 are respectively assumed to be
 ,
,
 and
and .
The weights of state variables are usually assigned depending on their relative
importance while those of controls are assigned relative to their cost implications.
.
The weights of state variables are usually assigned depending on their relative
importance while those of controls are assigned relative to their cost implications.
Next, we investigate the effect of the following optimal control strategies on the threatened prey-predator population.
・ Strategy A: Application of anti-poaching patrols for controlling poaching.
・ Strategy B: Construction of strong bomas for control of retaliatory killings.
・ Strategy C: Construction of dams for drought control.
・ Strategy D: Combination of application of anti-poaching patrols and construction of strong bomas.
・ Strategy E: Combination of application of anti-poaching patrols and construction of dams.
・ Strategy F: Combination of construction of strong bomas and dams and.
・ Strategy G: Combination of application of anti-poaching patrols, construction of strong bomas and dams.
4.1. Strategy A: Application of Anti-Poaching Patrols for Control of Poaching
The application of anti-poaching patrols
 is used to optimize the objective function
 while we set the con- struction of strong boma
 and construction of dams
 to zero. In Figure 1, the results show a significant
difference in the prey population with optimal strategy compared to prey population
without control while no effect to predator population as the control is taken only
to prey species. From Table 1 we see that if no
control measures are taken the wildebeest population would drop to approximately
152 individuals from 300 individuals expected to be attained during these 5 years
if there was no threat. With this control strategy the wildebeest population rises
to approximately 188, which is a saving of 36 individuals. Lion population goes
to about 29 individuals and with optimal anti-poaching patrol the population almost
remains the same because the control measure is taken only to prey population as
described in the model.
to zero. In Figure 1, the results show a significant
difference in the prey population with optimal strategy compared to prey population
without control while no effect to predator population as the control is taken only
to prey species. From Table 1 we see that if no
control measures are taken the wildebeest population would drop to approximately
152 individuals from 300 individuals expected to be attained during these 5 years
if there was no threat. With this control strategy the wildebeest population rises
to approximately 188, which is a saving of 36 individuals. Lion population goes
to about 29 individuals and with optimal anti-poaching patrol the population almost
remains the same because the control measure is taken only to prey population as
described in the model.
4.2. Strategy B: Construction of Strong Bomas for Control of Retaliatory Killings
The construction of strong boma
 is used to optimize the objective function
 while we set the application of anti-poaching patrols
 and construction of dams
 to zero. In Figure 2, the results show a significant
difference in the predator population with optimal strategy compared to predator
population without control while a little decrease in prey species. From Table 1 we see that due to application of construction of
strong bomas lion species increases from 29 to 36 individuals which is a saving
of 7 lion individuals. Wildebeest population decreases from 152 to 147 individuals
and this is caused by predation as a result of increasing number of lions without
taking control of all threats to wildebeest.
to zero. In Figure 2, the results show a significant
difference in the predator population with optimal strategy compared to predator
population without control while a little decrease in prey species. From Table 1 we see that due to application of construction of
strong bomas lion species increases from 29 to 36 individuals which is a saving
of 7 lion individuals. Wildebeest population decreases from 152 to 147 individuals
and this is caused by predation as a result of increasing number of lions without
taking control of all threats to wildebeest.
4.3. Strategy C: Construction of Dams for Drought Control
The construction of dams
 is used to optimize the objective function
 while we set the application of anti- poaching patrols
 and construction of strong boma
 to zero. In Figure 3, the results show a significant
difference in the prey and predator populations with optimal strategy compared to
prey and predator populations without control. From Table
1 we see that if no control measures are undertaken the wildebeest population
to zero. In Figure 3, the results show a significant
difference in the prey and predator populations with optimal strategy compared to
prey and predator populations without control. From Table
1 we see that if no control measures are undertaken the wildebeest population

Table 1. The different final states and total costs for different controls strategies from numerical codes.
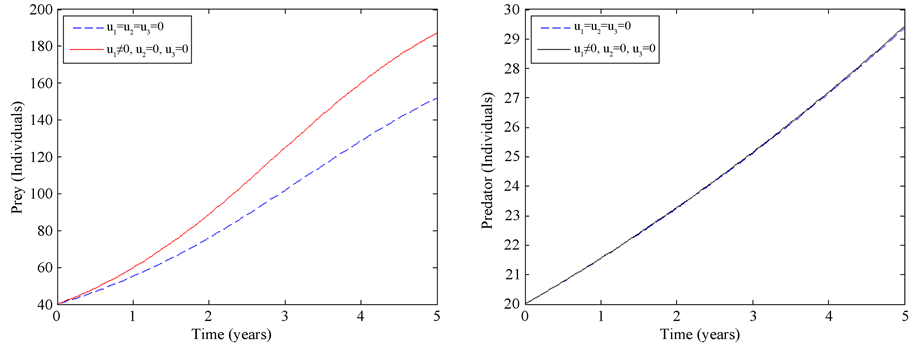
Figure 1. Simulations of a threatened prey-predator model showing the effect of optimal application of anti-poaching patrols.
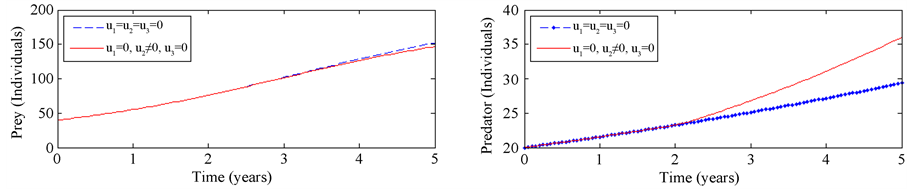
Figure 2. Simulations of a threatened prey-predator model showing the effect of optimal application of construction of strong bomas.
would drop to approximately 152 individuals different from the 300 expected number
during the 5 years. With this control strategy the wildebeest population rises to
approximately 204, which is a saving of 52 individuals. With optimal construction
of dams
 Lion population rises from 29 to 44 individuals at final time of control which is
a saving of 15 individuals.
Lion population rises from 29 to 44 individuals at final time of control which is
a saving of 15 individuals.
4.4. Strategy D: Combination of Application of Anti-Poaching Patrols and Construction of Strong Bomas
The application of anti-poaching patrols
 and construction of strong bomas
 are used to optimize the objective function
 while we set construction of dams
 to zero. In Figure 4, the results show a significant
difference in prey and predator populations before and after control. From Table 1 numerical results suggests
to zero. In Figure 4, the results show a significant
difference in prey and predator populations before and after control. From Table 1 numerical results suggests
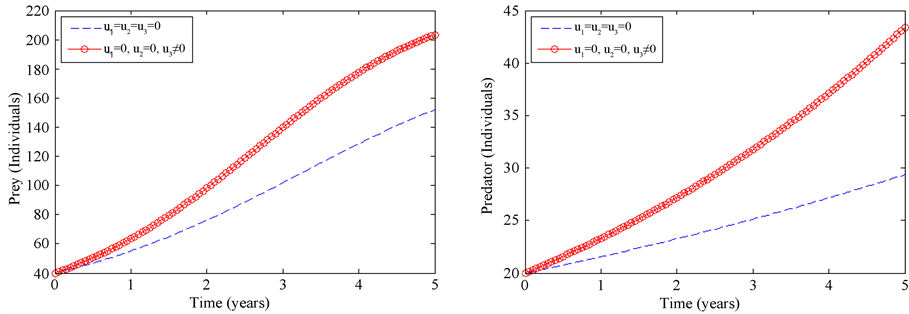
Figure 3. Simulations of a threatened prey-predator model showing the effect of optimal application of construction of dams.
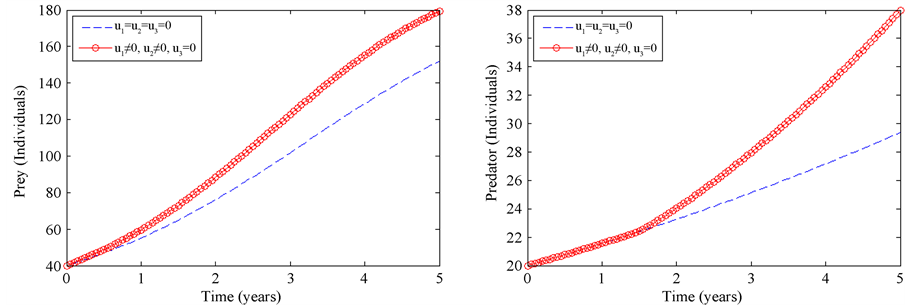
Figure 4. Simulations of a threatened prey-predator model showing the effect of optimal application of anti-poaching patrol and construction of strong bomas.
that if no control measures are applied the lion population would go to 29 individuals, but with this control strategy the population rises to 38 individuals during the 5 years which is a saving of 9 individuals. Wildebeest population rises from approximately 152 to 180 which is a saving of 28 individuals.
4.5. Strategy E: Combination of Application of Anti-Poaching Patrols and Construction of Dams
The application of anti-poaching patrols
 and construction of dams
 are used to optimize the objective function J while we set construction of dams
 to zero. In Figure 5, the results show a significant
difference in prey and predator populations before and after control. From Table 1 numerical results indicates that if no control measures
are taken the lion population would go to 29 individuals during these 5 years. With
this control strategy the lion population rises to 44 which is a saving of 15 individuals.
Wildebeest population rises from approximately 152 to 240 which is a saving of 88
individuals.
to zero. In Figure 5, the results show a significant
difference in prey and predator populations before and after control. From Table 1 numerical results indicates that if no control measures
are taken the lion population would go to 29 individuals during these 5 years. With
this control strategy the lion population rises to 44 which is a saving of 15 individuals.
Wildebeest population rises from approximately 152 to 240 which is a saving of 88
individuals.
4.6. Strategy F: Combination of Construction of Strong Bomas and Dams
The application of construction of strong bomas
 and construction of dams
 are used to optimize the objective function
 while we set application of anti-poaching patrol to zero. In
Figure 6, the results show a significant difference in prey and predator
populations before and after control. From Table 1
numerical results indicate that if no control measures are put in place the lion
population would go to approximately 29 individuals from 20 initial individuals
during the 5 years. With this control strategy the lion population rises to 60 which
is a saving of 31 individuals. Wildebeest population rises from approximately 152
to 190 which is a saving of 38 individuals.
while we set application of anti-poaching patrol to zero. In
Figure 6, the results show a significant difference in prey and predator
populations before and after control. From Table 1
numerical results indicate that if no control measures are put in place the lion
population would go to approximately 29 individuals from 20 initial individuals
during the 5 years. With this control strategy the lion population rises to 60 which
is a saving of 31 individuals. Wildebeest population rises from approximately 152
to 190 which is a saving of 38 individuals.
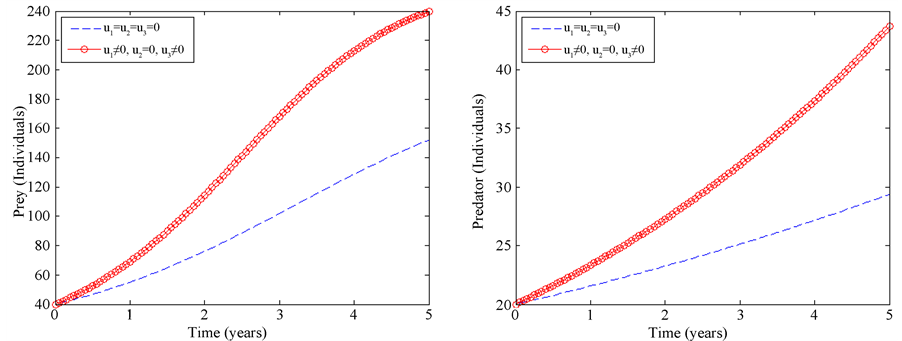
Figure 5. Simulations of a threatened prey-predator model showing the effect of optimal application of anti-poaching patrol and construction of dams.
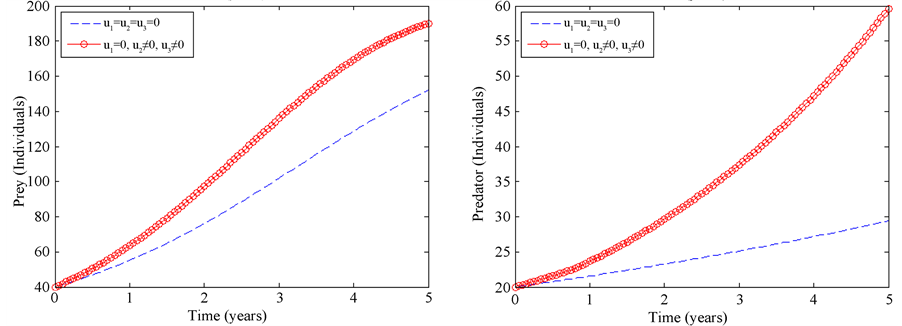
Figure 6. Simulations of a threatened prey-predator model showing the effect of optimal construction of strong bomas and dams.
4.7. Strategy G: Combination of Application of Anti-Poaching Patrols, Construction of Strong Bomas and Dams
Here, all three controls ( ,
, , and
, and )
are used to optimize the objective function
)
are used to optimize the objective function .
In Figure 7, the results show a significant difference
in prey and predator populations before and after control. From
Table 1 numerical results indicate that if no control measures are undertaken
the lion population would go to approximately 29 individuals from 20 initial individuals
during these 5 years. With this control strategy the lion population rises to 65
which is a saving of 36 individuals. Wildebeest population rises from approximately
152 to 223 which is a saving of 71 individuals. This is the strategy which shows
the best result for both species among all others as it yields the highest combination
of prey and predator individuals saved as a result of control application.
.
In Figure 7, the results show a significant difference
in prey and predator populations before and after control. From
Table 1 numerical results indicate that if no control measures are undertaken
the lion population would go to approximately 29 individuals from 20 initial individuals
during these 5 years. With this control strategy the lion population rises to 65
which is a saving of 36 individuals. Wildebeest population rises from approximately
152 to 223 which is a saving of 71 individuals. This is the strategy which shows
the best result for both species among all others as it yields the highest combination
of prey and predator individuals saved as a result of control application.
5. Concluding Remarks
In this paper, we presented a threatened prey-predator model using a deterministic system of differential equations. The threats are poaching, retaliatory killings and drought. Controls are introduced to the system which are anti-poaching patrols, construction of strong bomas and dams for controlling poaching, retaliatory killings and drought, respectively. In investigating the effect of optimal control, we use one control at a time, a combination of two controls at a time while setting other(s) to zero to compare the effects of the control strategies on the eradication of threats to prey-predator system. Additionally, the case of all controls was also taken into consideration. Our numerical results suggest that the use of all three controls, anti-poaching patrols, construction of strong bomas and dams has highest impact on the control of the system threats. From these findings, we see that
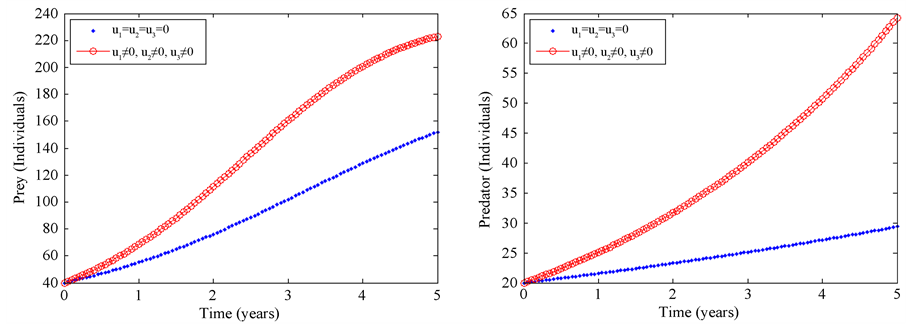
Figure 7. Simulations of a threatened prey-predator model showing the effect of optimal application of anti-poaching patrols, construction of strong bomas and dams.
when we have a system threatened by various threats, dealing with individual threat to the system does not often yield best results. Instead, combined approach of tackling all threats to yield better result is a good approach in the management of the wildlife populations. There is thus a booster effect when tackling many population decimating factors at a go than dealing with them individually. In case of single control strategy implementation, the priority would be construction of dams as it saves more individuals compared to others.
References
- Chakraborty, K., Chakraborty, M. and Kar, T. (2011) Optimal Control of Harvest and Bifurcation of a Prey-Predator Model with Stage Structure. Applied Mathematics and Computation, 217, 8778-8792. http://dx.doi.org/10.1016/j.amc.2011.03.139
- Dubey, B. (2007) A Prey-Predator Model with a Reserved Area. Nonlinear Analysis: Modeling and Control, 12, 479- 494.
- Peterson, M.J. (1991) Wildlife Parasitism, Science and Management Policy. Wildlife Management, 55, 782-789. http://dx.doi.org/10.2307/3809532
- Walker, B., Carpenter, S., Anderies, J., Abel, N., Cumming, G., Janssen, M., Lebel, L., Norberg, J., Peterson, G. and Pritchard, R. (2002) Resilience Management in Social-Ecological Systems: A Working Hypothesis for a Participatory Approach. Conservation Ecology, 6, 14.
- Sinclair, A.R.E., Packer, C., Mduma, S.A.R. and Fryxell, J.M. (2008) Serengeti III, Human Impacts on Ecosystems Dynamics. The University of Chicagopress, Chicago. http://dx.doi.org/10.7208/chicago/9780226760353.001.0001
- Kideghesho, J.R. (2010) “Serengeti Shall Not Die”: Transforming an Ambition into a Reality. Tropical Conservation Science, 3, 228-248.
- Bolger, D., Newmark, W., Morrison, T. and Doak, D. (2008) The Need for Integrative Approaches to Understand and Conserve Migratory Ungulates. Ecology Letters, 11, 63-77.
- Haris, G., Thirgood, S., Hopcraft, J., Cromsigt, J. and Berger, J. (2009) Global Decline in Aggregated Migrations of Large Terrestrial Mammals. Endangered Species Research, 7, 55-76. http://dx.doi.org/10.3354/esr00173
- GEAS (2013) Saving the Great Migrations: Declining Wildebeest in East Africa? http://na.unep.net/geas/getUNEPPageWithArticleIDScript.php?article_id=107
- Hopcraft, J., Sinclair, A., Holdo, R., Mwangomo, E., Mduma, S., Thirgood, S., Borner, M., Fryxell, J. and Olff, H. (2013) Why Are Wildebeest the Most Abundant Herbivore in the Serengeti Ecosystem? Serengeti IV: Sustaining Bio- diversity in a Coupled Human-Natureal System. University of Chicago Press, Chicago.
- Ikanda, D. and Packer, C. (2008) Ritual vs. Retaliatory Killing of African Lions in the Ngorongoro Conservation Area, Tanzania. Endangered Species Research, 6, 67-74. http://dx.doi.org/10.3354/esr00120
- Kissui, B.M. (2008) Livestock Predation by Lions, Leopards, Spotted Hyenas and Their Vulnerability to Retaliatory Killing in the Maasai Steppe, Tanzania. Animal Conservation, 11, 422-432.
- Kolowski, J.M. and Holekam, K.E. (2006) Spatial, Temporal and Physical Characteristics of Livestock Depradations by Large Carnivores along a Kenyan Reserve Border. Biological Conservation, 128, 529-541. http://dx.doi.org/10.1016/j.biocon.2005.10.021
- Kar, T. and Gosh, B. (2012) Sustainability and Optimal Control of an Exploited Prey-Predator System through Provision of Alternative Food to Predator. Biosystems, 109, 220-232. http://dx.doi.org/10.1016/j.biosystems.2012.02.003
- Holling, C.S. (1965) The Functional Response of Predators to Prey Density and Its Role in Mimicry and Popuation Regulation. Memoirs of the Entomological Society of Canada, 97, 1-60. http://dx.doi.org/10.4039/entm9745fv
- Fryxell, J.M., Mosser, A., Sinclair, A.R.E. and Packer, C. (2007) Group Formation Stabilizes Predator-Prey Dynamics. Nature, 449, 1041-1043. http://dx.doi.org/10.1038/nature06177
- Schaller, G.B. (1972) The Serengeti Lion: A Study of Predator-Prey Relations. University of Chicago Press, Chicago.
- Mduma, S.R. (1996) Serengeti Wildebeest Population Dynamics: Regulation, Limitation and Implication for Harvesting. Ph.D. Thesis, University of British Columbia, Canada.