Open Journal of Genetics
Vol.4 No.2(2014), Article ID:44515,9 pages DOI:10.4236/ojgen.2014.42011
Genetic Diversity of Great Dane Breed Using Ten Microsatellites: Impact of Breeding Control over the Breeding Line
Gino Noris1*, Carla Santana1*, Mariana Herrán-Aguirre2*, Marco Antonio Meraz-Ríos3, Mario Pérez-Martínez2, Carlos Esquivel-Lacroix4, Leonor C. Acosta-Saavedra5, Eduardo Rodríguez1, María de la Paz Juaréz1, Emma S. Calderón-Aranda5, Rocío Gómez5*#
1BIMODI (Biología Molecular Diagnóstica), Querétaro, Qro., México
2Departamento de Morfología, Facultad de Medicina Veterinaria y Zootecnia, Universidad Nacional Autónoma de México, México D.F., México
3Departamento de Biomedicina Molecular, Cinvestav-IPN, México D.F., México
4Departamento de Reproducción, Facultad de Medicina Veterinaria y Zootecnia, Universidad Nacional Autónoma de México, México D.F., México
5Departamento de Toxicología, Cinvestav-IPN. Av. Instituto Politécnico Nacional 2508, Col. San Pedro Zacatenco, México D.F., México
Email: #mrgomez@cinvestav.mx
Copyright © 2014 by authors and Scientific Research Publishing Inc.
This work is licensed under the Creative Commons Attribution International License (CC BY).
http://creativecommons.org/licenses/by/4.0/


Received 19 February 2014; revised 15 March 2014; accepted 6 April 2014
ABSTRACT
The American Kennel Club and the Fédération Cynologique Internationale recognize two phenotypic variants of Great Dane breed denominated American and European varieties. Historically, these varieties have been segregated according to morphological characteristics. In an attempt to obtain a better characterization, breeders have been interested in the genetic parameters that could evaluate the within-breed diversity. In this document, we studied the genetic structure of Great Dane breed with 10 STR markers in 88 dogs using capillary electrophoresis. Cluster analysis, population differentiation and phylogenetic analyses revealed that American and European varieties are genetically independent. Nevertheless, within the American variety a genetic stratification was found. Additionally, a high misclassification (28%) was detected, which could be due to wrong registration or false paternity. Our results support the importance to deem genetic markers as useful tools in breeding control. Similarly, these studies serve as an accurate reference to establish standards by dog breeding associations and for choosing among dogs for inter-breeding. Nevertheless, genetic tools are only a complement of morphological methods, since both are reshuffling the control over the breeding line. Notwithstanding, this database provides an overall and scape concerning the impact of genetic diversity within-breed. Unmistakably, more databases are needed to increase the quality of the breeding line as well as the number of STR in order to study, with more detail, the genetic structure in the Great Dane race.
Keywords:Genetic Structure, Great Dane Varieties, Microsatellites, Population Genetics, Population Stratification

1. Introduction
In agreement with the American Kennel Club (AKC) and the Fédération Cynologique Internationale (FCI) there are two recognized varieties of the Great Dane breed: American and European [1] . The differences between these varieties are exclusively associated with morphologic characteristics. However, with the advent of new bioinformatics tools, Kennel clubs have become more interested in genetic studies to evaluate the within-breed diversity. These studies are a powerful tool to obtain a better characterization by combining both genetic and phenotypic characteristics [2] . Short tandem repeats (STRs) are the preferred markers to study genetic variability in a population as well as parentage verification, suggesting that different breeds display distinct allele frequencies. Hence, STRs provide information about the genetic composition of purebred canine populations [3] -[7] . In this light, recent studies have demonstrated considerable genetic differentiation even within recognized breeds [8] . These differences could be related to artificial selection, demographic events (bottleneck and effective population size), as well as population stratification. In an attempt to gain more insight into these differences, an increasing number of studies have been focused on characterizing genetic structure among and within canine populations. Nevertheless, little information is available and analysis of genetic structure in local populations is still limited.
In order to study genetic variation in Great Danes, we characterized within-breed genetic differences. We analyzed 10 STR markers in 176 chromosomes using capillary electrophoresis. The population genetic structure, population differentiation, and phylogenetic analyses showed that American and European varieties are genetically independent. In addition, cluster analyses using Bayesian methods suggested that the American variety is stratified in two subpopulations, one of them showing an excess of heterozygosity (F = −0.0600). This data indicate that crossbreeding between different varieties of Great Dane dogs, to correct for genetic diseases, has originated genetic stratification within the American variety of Great Danes. Our results also show that this approach is useful for addressing dog breed genetic differences, even among varieties within the same breed, and corroborates the importance of determining the within-breed genetic structure in order to maintain breeding lines.
2. Materials and Methods
2.1. Population Studied
In cooperation with the Herrán-Aguirre kennel and the Mexican Great Dane Club, 88 dog records were compiled from animals with breeding license. From each individual we obtained information regarding origin, birthplace, age and sex by reviewing individual registration (pedigree) data provided by the owners. Great Dane dogs were phenotypically classified as American (65 dogs) or European (23 dogs), following the American Kennel Club (AKC) and the Fédération Cynologique Internationale (FCI) standards (Table 1), and based on the reiterated information on the dogs’ pedigree.
2.2. Sampling
Blood samples (4 mL) were collected using the vacutainer system, with EDTA as anticoagulant. DNA was isolated from these samples and purified using the Qiamp DNA Mini Kit (Qiagen, Düsseldorf, Germany), following the manufacturer’s instructions.

Table 1. Phenotypic differences between American and European varieties.
2.3. DNA Analysis
Approximately 10 ng of target DNA were amplified using the commercial typing StockMark® Dog Genotyping Kit (Applied Biosystems, Carlsbad, CA, USA), under recommended conditions; a 2700 Thermal Cycler (Applied Biosystems, Carlsbad, CA, USA) was employed for the PCR method. The fragment analysis was assayed on the ABI PRISM 310 Genetic Analyzer (Applied Biosystems, Carlsbad, CA, USA) using the Genescan® analysis v. 3.7 software (Applied Biosystems, Carlsbad, CA, USA).
2.4. Statistical Analysis
Allele and genotype frequencies, number of alleles (k), and genetic diversity (GD) were calculated with the FSTAT v.2.9.3.2 software [9] . Hardy-Weinberg expectation (HWE) and inbreeding coefficient (F) were obtained by applying Weir and Cockerham’s F statistics, using the Genètix v. 4.05.2 software [10] . Significance levels were determined empirically with 10,000 permutations. Population differentiation with exact test probability was carried out with the Arlequin v.3.1 software, using 100,000 simulations [11] .
To infer population structure, we used principal component analysis with the GenAlEx v. 6.41 [12] software followed by a model based on Bayesian statistics using the Structure v. 2.3X software [13] . Briefly, the genetic background of each individual is represented by a vector,  , where qk is the proportion of the individual genome originated in the population k. The software uses the Markov Chain Monte Carlo (MCMC) method to estimate the number of populations, allele frequencies in each population, and the q value for each sampled individual. All runs were performed with 100,000 length of burn-in period and 700,000 number of MCMC repeats after burn-in. This procedure calculates the probability that the observed set of genotypes could occur across a designated range of possible k’s.
Allele frequencies of each population were used to construct a dendrogram. The analysis was done using the Phylip package v. 3.69 [14] and Treeview v. 1.6.6 software [15] . The Neighbor-Joining method (NJ) was used to display the matrix of pairwise distance to compute Reynold’s standard genetic distances among the different populations. Also, a bootstrap method (100,000 replications) was used to test the significance of the population cluster in the dendrogram [16] -[18] .
3. Results
3.1. Population Genetic Structure
Two varieties of Great Dane were defined by phenotypic characteristics (Table 1). The 88 dogs were originally classified by phenotypic parameters as 65 Americans and 23 Europeans.
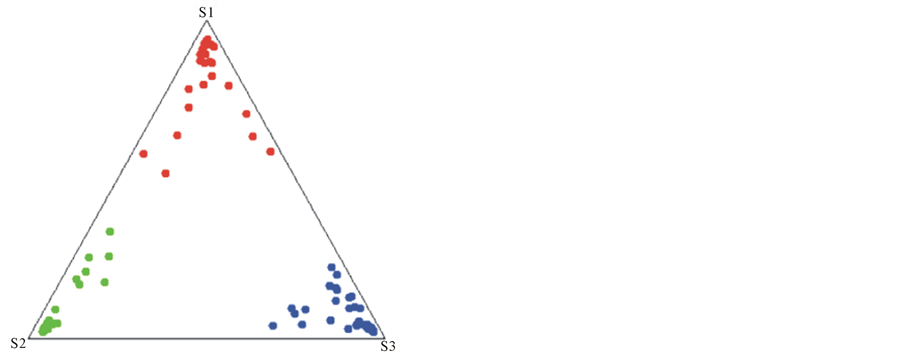
To establish whether these varieties showed genetic differences, we determined the genetic structure of the Great Dane breed using principal component analysis (PCA) as a preliminary method. As a result, we obtained three different Great Dane clusters, which can be considered as three independent genetic populations (data not shown). In order to confirm these findings, we used a Bayesian clustering method to estimate the number of distinct populations and calculated the within-breed genetic diversity. We analyzed 88 individuals and found that they were clustered into three different genetic populations (k = 3, P = 1). The individuals were sorted as follows: 26 in subpopulation 1, 26 in subpopulation 2 and 36 in subpopulation 3. Based on clusters obtained by the Bayesian method as well as on phenotypic characteristics we assumed that 52 dogs were Americans (subpopulations 1 and 2) and 36 were Europeans (subpopulation 3) (Figure 1). These results were verified phylogenetically by dendrogram construction (Figure 2).
As a result of the genetic analysis, we found that of the 65 dogs that were originally classified as Americans based on phenotype, only 47 (72%) were genetically Americans, and 18 (28%) were genetically reclassified as Europeans. Alternatively, of the 23 phenotypically European dogs, 18 (78%) remained as genetically Europeans, but 5 (22%) were genetically reclassified as Americans.
In addition, a population differentiation analysis was performed to detect genetic differences among the defined groups (Table 2). In this regard, important differences were found between subpopulations 2 and 3 (P <
 (a)
(a)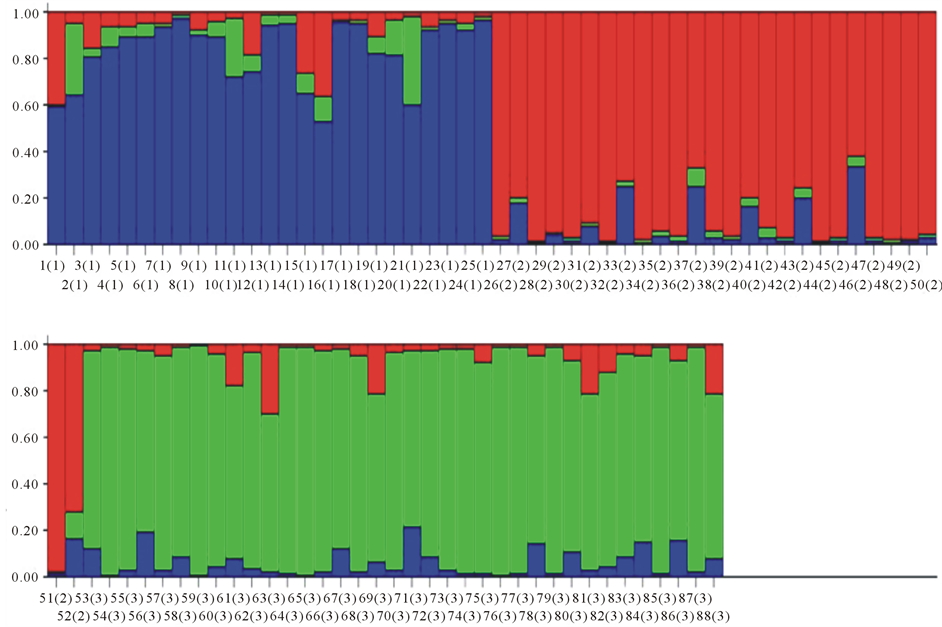 (b)
(b)
Figure 1. Genetic structure of the Great Dane breed. (a) Triangle pigureEb population 3) (Dane breed lost showing the genetic structure. (b) The bar plot represents the amount of genome of each individual that originated from each of three subpopulations represented as red (subpopulation 1), green (subpopulation 2), and blue (subpopulation 3).
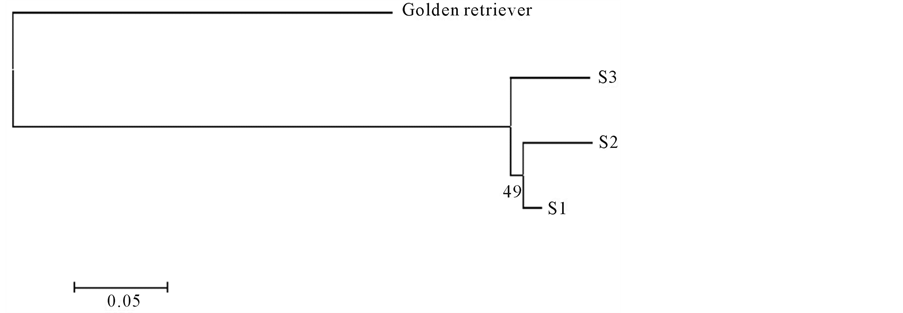
Figure 2. Neighbor-Joiningdendrogram constructed from the Reynold’ standard genetic distances. Footnote: S1: subpopulation 1, S2: subpopulation 2, S3: subpopulation 3.
Table 2. Population differentiation among the defined groups.
Footnote: *P < 0.05, **P £ 0.001, ***P £ 0.0001, Markov Chain Leght = 100,000 steps.
0.0001 ± 0.0000), as well as between subpopulations 1 and 3 (P = 0.00450 ± 0.0019). On the other hand, when subpopulations 1 and subpopulation 2 were compared, only 5 out of 10 loci showed significant differences (P < 0.05), including the more informative loci.
3.2. Descriptive Genetic Statistics
We estimated allele frequencies, number of alleles (k), gene diversity (GD), observed heterozygotes (Ho), expected heterozygotes (He), and Hardy-Weinberg expectation for each variety (Table 3). A total of 58 different alleles were found, 18 (32%) seemed to be private alleles: 5 alleles for subpopulation 1 (FHC2054-169bp, PEZ5-117bp, PEZ12-279bp, PEZ6-171bp and PEZ6-185bp), 3 alleles for subpopulation 2 (FHC2054-149bp, PEZ12-304bp, PEZ3-131bp), and 10 alleles for subpopulation 3 (FHC2054-141bp, FHC2054-145bp, FHC2054- 165bp, FHC2054-174bp; PEZ1-110bp, FHC2010-230bp, PEZ3-128bp, PEZ3-137bp, PEZ6-195bp and PEZ8- 247bp). The more informative loci were PEZ3, PEZ6 and PEZ12 (genetic diversity, GD > 0.7), whereas the less informative loci were PEZ1, PEZ5 and FHC2079 (GD < 0.5). Hardy-Weinberg equilibrium was observed for all loci in the three populations with the exception (P < 0.05) of loci FHC2054 and FHC2010 in subpopulation 2 and subpopulation 3, respectively (Table 3).
Ultimately, the inbreeding coefficients (F) for each variety using the 10 loci were calculated. The lowest F value was observed in subpopulation 2 (F = −0.0600), which indicates an excess of heterozygosity, whereas
Table 3. Allelic frequencies and descriptive statistics parameters regarding the 10 STR loci in the three cluster found in Great Dane.
Footnote: S1: subpopulation-1, S2: subpopulation-2, S3: subpopulation-3, k: number of alleles, GD: genetic diversity, Ho: observed heterozigosity, He: expected heterozygosity, HW: Hardy-Weinberg (Weir &Cockerham) P-value, F: Inbreeding coefficient. Bold numbers mean private alleles.
subpopulation 1 and subpopulation 3 showed values of F = 0.0450 and F = 0.0150, respectively, with the consequent homozygote excess.
4. Discussion
This study comprises genetic information concerning the recognized Great Dane varieties, in which we showed the high efficiency of genetic markers in the control over the breeding line.
Our results reveal that the two recognized varieties of the Great Dane breed are genetically different, as has been assumed by its phenotypic characteristics. Nevertheless, cluster analysis confirms three different genetic subpopulations in the Great Dane population studied. Both subpopulation 1 and subpopulation 3exhibited an excess of homozigosity, which is related to inbreeding as a consequence of pure lineages. Based on phenotypic parameters, these populations correspond to the American and European varieties, respectively. Conversely, the third subpopulation showed an increase in heterozigosity levels (F = −0.0600), which could be associated with recent mixtures between dogs that are not of the same variety. Consequently, subpopulation 3 may be the result of sub-structural differentiation also named “breed split” caused by artificial selection. This non-natural selection carried out by breeders segregates varieties not only phenotypically, but genetically [8] .
As a consequence of the lack of control in the genetic diversity within-breed, we found an important amount of discrepancies in classification. In light of this evidence, 25% of the dogs were reclassified when using genetic bases. These discrepancies could be related to wrong registration as well as false paternity. In this regard, previous studies have reported that dog breeds showed around 10% of average pedigree error, whereas the frequency of false paternity was close to 5% [19] -[21] . In addition, the high misclassification could be related to crossbreeding between pure lines and recent admixture dogs. Although this miscegenation maintains morphological characteristics, the genetic imprint is modified. This practice may increase the European genetic lineage, though preserving the American phenotype, given that both varieties share an European ancestor. As a result of these mating practices, we found that 28% of the dogs with American pedigree were genetically classified as Europeans. Our findings are in agreement with recent studies, which support up to 30% of genetic variation in pure breeds [22] . This genetic variation can cause important genetic differences even among different countries as Quingnon and colleagues point out [23] .
Our results provide support to deem genetic markers as useful tools in breeding control to increase the quality in the breeding line [2] . These methods can also help in health control and even in preserving athletic attributes, which have been gaining steady ground in the Canidae family [3] [24] -[26] . Both genetic and morphological characteristics are important features to determine dog breed or variety. Nevertheless, STR genotyping should not be considered unique in defining the variety of an individual because this would lead to inaccuracies [7] [27] -[29] . Although our data evinces the complex genetic architecture in within-breed dogs, it is advisable to increase the population size to discard sampling artifacts. In addition, further research is needed in which the number of STRs is increased to identify additional genetic characteristics.
5. Conclusion
Our findings demonstrate the usefulness of microsatellites in breeding and selection practices. Concomitantly, it is important to evaluate the genetic characteristics within breeds to maintain the breeding lines. Besides, our results support the use of STRs as a powerful tool to assign each variety rightly. Finally, it is also noteworthy to mention the usefulness of this type of studies to reduce genetic diseases by the identification of risk factors. To our knowledge, this is the first report of genetic diversity in Great Dane breed.
Acknowledgements
We thank all the dog owners from the Mexican Great Dane Club who allowed us to sample their dogs and gave us access to their breeding licenses, as well as to pedigree and registration information. We thank BIMODI staff for logistic assistance in sample and data management.
Conflict of Interest Statement
None of the authors has any financial or personal relationship that could inappropriately influence or bias the content of this paper.
References
- Crowley, J. and Adelman, B. (1998) The Complete Dog Book; Official Publication of the American Kennel Club. Howell Book House, New York.
- Parker, H.G. (2012) Genomic Analyses of Modern Dog Breeds. Mammalian Genome, 23, 19-27. http://dx.doi.org/10.1007/s00335-011-9387-6
- Huson, H.J., Parker, H.G., Runstadler, J. and Ostrander, E.A. (2010) A Genetic Dissection of Breed Composition and Performance Enhancement in the Alaskan sled Dog. BMC Genetics, 11, 71. http://dx.doi.org/10.1186/1471-2156-11-71
- Boyko, A.R., Quignon, P., Li, L., Schoenebeck J.J., Degenhardt, J.D., et al. (2010) A Simple Genetic Architecture Underlies Morphological Variation in Dogs. PLoS Biology, 8, e1000451. http://dx.doi.org/10.1371/journal.pbio.1000451
- Lindblad-Toh, K., Wade, C.M., Mikkelsen, T.S., Karlsson, EK., Jaffe, D.B., et al. (2005) Genome Sequence, Comparative Analysis and Haplotype Structure of the Domestic Dog. Nature, 438, 803-819. http://dx.doi.org/10.1038/nature04338
- Ostrander, E.A. and Wayne, R.K. (2005) The Canine Genome. Genome Research, 15, 1706-1716. http://dx.doi.org/10.1101/gr.3736605
- Mellersh, C. (2011) DNA Testing and Domestic Dogs. Mammalian Genome, 23, 109-123. http://dx.doi.org/10.1007/s00335-011-9365-z
- Wade, C.M. (2011) Inbreeding and Genetic Diversity in Dogs: Results from DNA Analysis. The Veterinary Journal, 189, 183-188. http://dx.doi.org/10.1016/j.tvjl.2011.06.017
- Goudet, J. (2002) FSTAT Software. Institute of Ecology BB, UNIL, CH-1015 (2002) Editor. 2.9.3.2 ed., Laussane.
- Belkhir, L.C., Raufaste, N. and Bonhomme, F. (1996-2004) GENETIX 4.05 Logiciel Sous Windows TM Pour la Génétique des Populations. In: Laboratoire Génome P, Interactions, CNRS UMR 5171, editor, Université de Montpellier II, Montpellier.
- Excoffier, L, Laval, G and Schneider, S. (2005) Arlequin (Version 3.0): An Integrated Software Package for Population Genetics Data Analysis. Evol Bioinform Online, 1, 47-50.
- Peakall, R. and Smouse, P.E. (2006) GENALEX 6: Genetic Analysis in Excel. Population Genetic Software for Teaching and Research. Molecular Ecology Notes, 6, 288-295. http://dx.doi.org/10.1111/j.1471-8286.2005.01155.x
- Pritchard, J.K., Stephens, M. and Donnelly, P. (2000) Inference of Population Structure Using Multilocus Genotype Data. Genetics, 155, 945-959.
- Felsenstein, F. (2005) PHYLIP (Plylogeny Inference Package) Version 3.2. Cladistics, 5, 164-166.
- Page, R.D. (1996) TreeView: An Application to Display Phylogenetic Trees on Personal Computers. Computer Applications in the Biosciences, 12, 357-358.
- Efron, B., Halloran, E. and Holmes, S. (1996) Bootstrap Confidence Levels for Phylogenetic Trees. Proceedings of National Academy of Sciences of the United States of America, 93, 13429-13434. http://dx.doi.org/10.1073/pnas.93.23.13429
- Saitou, N. and Nei, M. (1987) The Neighbor-Joining Method: A New Method for Reconstructing Phylogenetic Trees. Mol Biol Evol, 4, 406-425.
- Nei, M., Tajima, F. and Tateno, Y. (1983) Accuracy of Estimated Phylogenetic Trees from Molecular Data. II. Gene Frequency Data. Journal of Molecular Evolution, 19, 153-170. http://dx.doi.org/10.1007/BF02300753
- Oliehoek, P.A. and Bijma, P. (2009) Effects of Pedigree Errors on the Efficiency of Conservation Decisions. Genetics Selection Evolution, 41, 9. http://dx.doi.org/10.1186/1297-9686-41-9
- Leroy, G., Verrier, E., Meriaux, J.C. and Rognon, X. (2009) Genetic Diversity of Dog Breeds: Between-Breed Diversity, Breed Assignation and Conservation Approaches. Animal Genetics, 40, 333-343. http://dx.doi.org/10.1111/j.1365-2052.2008.01843.x
- Leroy, G., Verrier, E., Meriaux, J.C. and Rognon, X. (2009) Genetic Diversity of Dog Breeds: Within-Breed Diversity Comparing Genealogical and Molecular Data. Animal Genetics, 40, 323-332. http://dx.doi.org/10.1111/j.1365-2052.2008.01842.x
- Pires, A.E., Amorim, I.R., Ginja, C., Gomes, M., Godinho, I., et al. (2009) Molecular Structure in Peripheral Dog Breeds: Portuguese Native Breeds as a Case Study. Animal Genetics, 40, 383-392. http://dx.doi.org/10.1111/j.1365-2052.2009.01849.x
- Quignon, P., Herbin, L., Cadieu, E., Kirkness, E.F., Hedan, B., et al. (2007) Canine Population Structure: Assessment and Impact of Intra-Breed Stratification on SNP-Based Association Studies. PLoS One, 2, e1324. http://dx.doi.org/10.1371/journal.pone.0001324
- Kanthaswamy, S., Tom, B.K., Mattila, A.M., Johnston, E., Dayton, M., et al. (2009) Canine Population Data Generated from a Multiplex STR Kit for Use in Forensic Casework. Journal of Forensic Sciences, 54, 829-840. http://dx.doi.org/10.1111/j.1556-4029.2009.01080.x
- DeNise, S., Johnston, E., Halverson, J., Marshall, K., Rosenfeld, D., et al. (2004) Power of Exclusion for Parentage Verification and Probability of Match for Identity in American Kennel Club Breeds Using 17 Canine Microsatellite Markers. Animal Genetics, 35, 14-17. http://dx.doi.org/10.1046/j.1365-2052.2003.01074.x
- Van Asch, B., Pinheiro, R., Pereira, R., Alves, C., Pereira, V., et al. (2009) A Framework for the Development of STR Genotyping in Domestic Animal Species: Characterization and Population Study of 12 Canine X-Chromosome Loci. Electrophoresis, 31, 303-308. http://dx.doi.org/10.1002/elps.200900389
- Wellmann, R. and Bennewitz, J. (2011) Identification and Characterization of Hierarchical Structures in Dog Breeding Schemes, a Novel Method Applied to the Norfolk Terrier. Journal of Animal Science, 89, 3846-3858. http://dx.doi.org/10.2527/jas.2010-3709
- Zenke, P., Egyed, B., Zoldag, L. and Padar, Z. (2011) Population Genetic Study in Hungarian Canine Populations Using Forensically Informative STR Loci. Forensic Science International: Genetics, 5, e31-e36. http://dx.doi.org/10.1016/j.fsigen.2010.03.013
NOTES

*These authors equally contributed to this work.
#Corresponding author.