Open Journal of Molecular and Integrative Physiology
Vol.1 No.2(2011), Article ID:6949,8 pages DOI:10.4236/ojmip.2011.12003
Direction without speed information process in the human brain: a magnetoencephalographic study using random dots apparent motion stimulus
1Department of Integrative Physiology, National Institute for Physiological Sciences, Myodaiji-cho, Okazaki, Japan;
2Department of Physiological Sciences, School of Life Sciences, Graduate University for Advanced Studies, Hayama, Kanagawa, Japan.
Email: *kaneoke@wakayama-med.ac.jp
Received 23 May 2011; revised 10 June 2011; accepted 20 June 2011.
Keywords: apparent motion; random dot kinematogram; direction; information entropy; magnetoencephalography
ABSTRACT
Apparent motion stimulus induces visual perception of smooth motion even though there is no speed information. We examined whether human brain response as measured by magnetoencephalography carries direction information in the visually presented apparent motion of a random-dot pattern in a similar manner as continuous motions that have speed and direction information. Although there was no significant effect of motion direction on the peak response latency and amplitude, mutual information entropy (IE) significantly increased after the motion onset at approximately 36 ms after the response latency in 41% of the evaluations. Detailed analysis of the data from five subjects who participated in both the present apparent motion and our previous coherent motion studies revealed that the maximum IE latency (delay) for apparent motion was significantly longer than that for coherent motion, although the mean maximum IE was the same. The results indicate that direction is represented in the response waveform evoked by apparent motion but the manner is different from that for coherent motion probably due to the distinct neural processes engaged only for the apparent motion perception. We consider that direction and speed can be processed separately in the human brain because direction information was generated without speed information for the perception of apparent motion.
1. INTRODUCTION
Humans visually perceive motion of objects even when the objects do not move but change their positions discontinuously. The neural process underlying such apparent motion perception must be different from that for the real motions, because human brains create vivid images of the path of the apparent motion that do not exist and cannot not be seen [1-3]. Further, apparent motion stimulus is inherently ambiguous; subtle changes in the stimulus conditions, such as presentation timing and distance of the position change, could induce quite different perceptions. For example, shifts of random-dot patterns induces apparent motion when the amount of shift is sufficiently short, but the same pattern shift over a longer distance induces perceived blinking of dots [4-6]. Thus, human brains must determine what happened from the two possibilities such as motion or blink. Such neural processes would not be engaged in motion perception induced by continuous motion stimulus.
Direction information of visually detected motion has been shown to be represented in the human brain response waveform as measured by electroencephalography [7] and magnetoencephalography [8]. These studies used the continuous motion of random dots (coherent motion) to evoke human brain response to motion onset. Further, previous study showed that direction information was represented in the response waveform independent of speed information [8], suggesting that human brains process direction and speed information separately at least in part. For apparent motion, there is no physical speed and an image of motion direction (and path) is generated possibly by a top-down process [2,3]; continuous motion, on the other hand, has physical speed and direction that could be detected by bottom-up processes. In this study, we investigated whether direction information was represented in the human brain response waveform evoked by apparent motion. If it were the case, the next question is whether such direction information is represented in a similar manner as that for continuous motions. We hypothesized that direction information of apparent motion is also represented in the response waveform but in a somewhat different manner as that for continuous motion because of different neural processes.
2. MATERIALS AND METHODS
2.1. Subjects
Ten healthy right-handed colleagues (two women and eight men, 24 to 48 years old) participated in this study. All subjects had normal or corrected to normal visual acuity. They provided informed consent and were experienced subjects of the MEG experiments. The study was approved by the ethical committee for the human study in the institute (National Institute for Physiological Sciences).
2.2. Visual Stimulus
A random dot kinematogram (RDK) was used to present apparent motion or blinking of the dots. Stimuli were generated by a program on an IBM-compatible personal computer (PC9800, NEC, Japan) and then projected onto a rear-projection screen in a magnetically shielded room. A projector with digital light processing (Mirage 2000; Christie Digital Systems Canada, Kitchener, ON, Canada) was used to present the visual stimuli. As this monitor has a memory for the two frames, the actual image presentation was about 33 ms after the command from the computer because the refresh rate was 60 Hz. This delay was subtracted from the measured MEG latency. The stimuli (RDK) subtended a square of 4.6˚ × 4.6˚ visual angle at a distance of 234 cm, with a dot size of 0.039˚ × 0.039˚ (5.0 cd/m2). Dot density was 10% of the area and background luminance was 1.2 cd/m2.
The visual stimulus consisted of two frames (Figure 1). In Frame 1, stationary random dots were presented for 2 to 3 s. The subsequently presented Frame 2 consisted of the same stationary dots, but the whole dots’ locations in Frame 1 were shifted one of four directions (left, right, up, or down-ward) at a fixed distance (0.17˚ or 1.5˚). There was no so-called interstimulus interval. The amounts of shift was determined so that the condition with the shift of 0.17˚ evoked vivid apparent motion perception and the other (1.5˚) evoked no motion according to our previous study [9]. Frame 2 was shown for 0.5 s. With this stimulus presentation, we could measure the magnetic response evoked that was related only to the change in the frame (from Frame 1 to 2).
One experimental session consisted of randomly presented 8 (4 directions × 2 shifts) stimuli, in each of which Frame 1 and 2 were projected sequentially. In one experimental session, 100 epochs for each direction of apparent motion with a shift of 0.17˚ and 25 epochs for
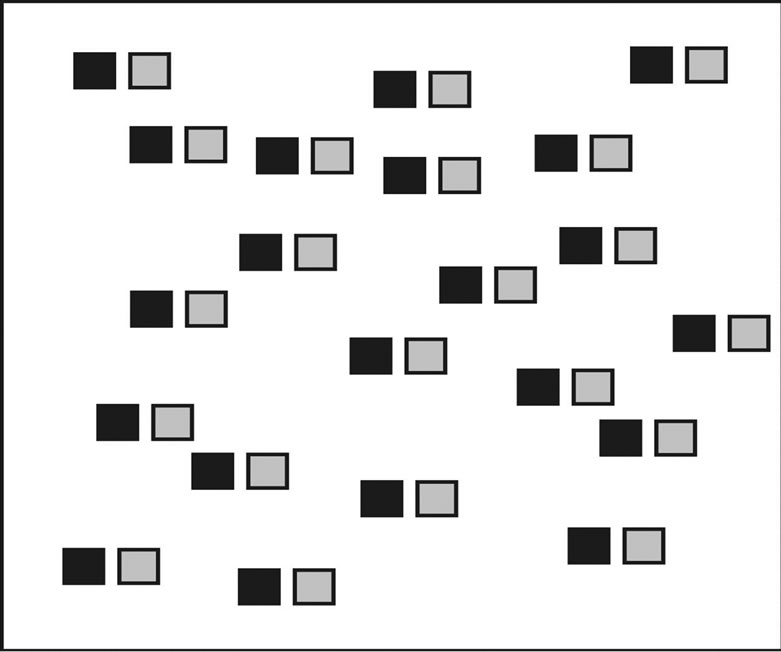
Figure 1. The random-dot pattern. In frame 1, the pattern (shown here by black squares) was presented for 2 s to 3 s. Subsequently, the pattern shifted at a certain distance (shown by gray squares). When the shift was small enough, the subjects saw vivid motion of the pattern (in this case, towards the right).
each direction of blink with a shift of 1.5˚ were collected (in total, 500 epochs) with intermission (less than 5 min). To keep the subject’s attention, he or she was requested to count the number of blink stimulus. The direction and the distance of the pattern shift were chosen at random for each epoch. The pattern in Frame 2 at the opposite side of the shift was not a wraparound of Frame 1, but rather the area was replaced by the new dot pattern so as not to evoke the perception of motion at the direction opposite to the shift.
2.3. MEG Measurements
A whole-head 306-channel MEG system (Vectorview; Electa Neuromag, Helsinki, Finland) was used to acquire human brain responses to motion onset. Subjects were seated in a dimly lit, magnetically shielded room and passively viewed a fixation point (marked with a red spot) at the center of the screen. They were instructed to fix their eyes on the spot at all times during the recording session and blink if necessary while stationary dots were presented after the frame change. Blink and eye position were monitored and recorded along with MEG signals using an infrared eye tracker (pupil/corneal reflection tracking system; ISCAN, Cambridge, MA, USA). A subject’s head position relative to the MEG sensor coils was determined by measuring the positions of four small head position indicator (HPI) coils attached to the scalp (using nasion and bilateral tragi as anatomical landmarks for opositioning) with a three-dimensional digitizer (3 Space Fastrak; Polhemus, Colchester, VT, USA) outside the shielded room. Positions of the HPI coils were also measured with MEG sensors by feeding current to the coils at the beginning of each recording session.
MEG signals were continuously measured with triple-sensor elements at 102 locations above the head. Each sensor element has a magnetometer and two planar gradiometers oriented perpendicular to each other. Planar gradiometers measured the spatial gradient of the magnetic field that would be typically measured with magnetometers. Signals were band-pass filtered at 1 - 200 Hz and digitized at 1 kHz. Digitized data—including MEG waveforms, eye movements, and eight event codes for the stimulus conditions—were stored on the hard disk of the workstation for further analysis.
2.4. Data Analysis
2.4.1. Mean Magnetic Field Gradient
Data files were converted to Matlab files (Matlab version 7.5; Mathworks, Natick, MA, USA) and analyzed with programs developed using Matlab commands. For each motion direction, epochs in a session ranging from 50 ms before and to 500 ms after the onset of motion (frame change) were averaged for 100 epochs. The mean signal amplitude of signal obtained before frame change was used for baseline correction. Epochs in which MEG signal variations for planar gradiometers were >3000 fT/cm (or eye movements were >0.5˚) during epoch acquisition were excluded from averaging. Averaged data were low pass filtered at 30 Hz and residual noise was reduced by wavelet analysis (denoise procedure in the Matlab toolbox).
As planar gradiometers measure the spatial gradient of a magnetic field using a pair of coils oriented perpendicular to each other, the strength (magnetic field gradient, MFG) of the gradient at each sensor location was calculated as the square root of (gx(t)2 + gy(t)2), where gx(t) and gy(t) are the amplitude data at time t for the two planar gradiometers. In this study, we used the mean magnetic field gradient (mMFG) in each sensor location to evaluate the temporal structure of the MEG response, because peak latency and amplitude of the global response waveform have been shown to vary with motion speed [8,10-12]. For the calculation of mMFG, sensor locations were divided into four regions (anterior, left, right, and posterior) (Figure 2). At each location, the time course of the mMFG was calculated by simply averaging the MFG within the locus at each time. The mMFG is useful for quantifying global response strength evoked by the visual responses in neurons, and this value corresponds to the root mean square value seen in many EEG and MEG studies. The peak latency and amplitude of each response waveform was determined for the first response component as in our previous study [8].
We measured four different responses at each experimental session, since apparent motions with four different directions were presented. These four responses acquired in each session are referred to as the “response data set” in this study and were used to calculate mutual information entropy (see below).
2.4.2. Mutual Information Entropy
We calculated the mutual information entropy (IE) [13-15] between response amplitude data before motion
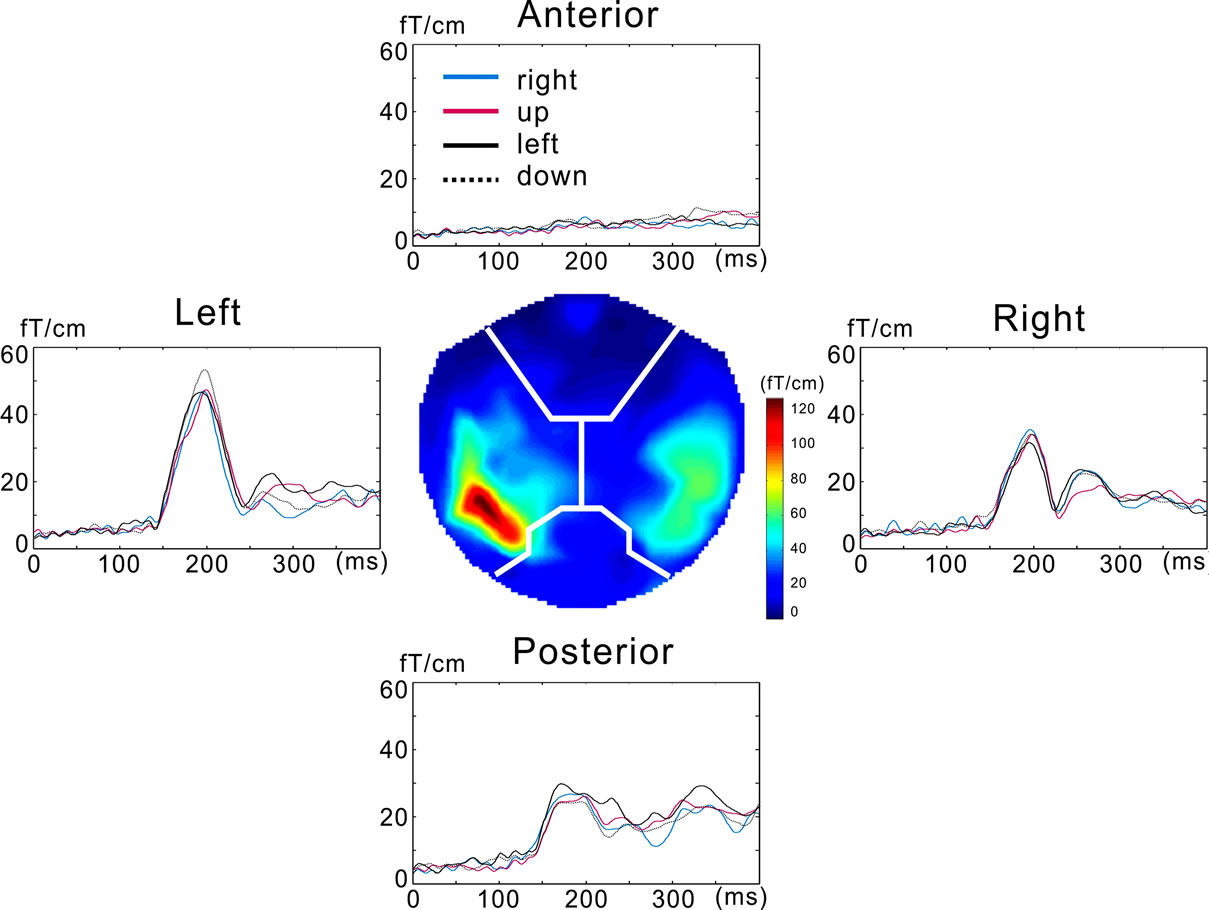
Figure 2. The response waveforms and the magnetic field gradient map. The map the center of the figure shows the pattern at the peak latency (200 ms after the stimulus onset). The mean magnetic field gradient waveforms are shown for each sensor location.
onset and response amplitude data after motion onset as in our previous study [8]. This value indicates how much IE increases (or decreases) in the response to motion stimuli. If the response amplitude was varied with different stimulus motion directions of stimulus and the amount of variance was significantly larger than the variance before motion onset, IE would increase, indicating that direction information is actually represented in the MEG response waveform.
The mutual IE for each response data set (see above) was calculated using the following equation:
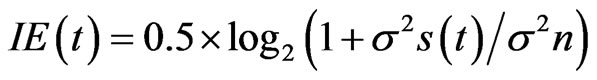 where IE(t) is the IE at time t, σ2s(t) is variance of the signal amplitude variance at time t, and σ2n is the variance of the noise, determined as the mean variance of amplitude among the responses (mMFG) with four different directions before motion onset. We assumed that variance of the amplitude after motion onset, σ2r(t) was the sum of signal and noise variances, that is: σ2r(t) = σ2s(t) + σ2n. Using σ2r, IE was calculated as 0.5 ×
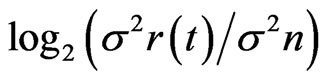 . The value of σ2s(t) could vary simply with noise. The 95% probability of the upper limit of the variance due to noise was estimated with a χ2 distribution using three degrees of freedom as 18.51 × σ2n. With that value, IE < 2.14 was shown to occur by chance. We thus considered that any data with IE > 2.14 were significantly increased after motion presentation.
3. RESULTS
All subjects perceived vivid motion of random-dot patterns when the frame shift was 0.17˚ for all the directions. Of the 160 response waveforms acquired (ten subjects × four directions × four sensor locations), 88 response waveforms for eight subjects were examined because these response amplitude exceeded two standard deviations (S.D.) of noise level before stimulus onset. Figure 2 shows the illustrative response waveforms and the magnetic field gradient map at the peak of the response (200 ms after the stimulus onset) for one subject.
Multivariate repeated-measure analysis of variance (ANOVA) revealed that stimulus direction did not significantly affect both the peak latency and the amplitude data (F(3, 12) = 0.476, p > 0.05 for the latency data, F(3, 12) = 2.536, p > 0.05 for the amplitude data). Figure 3 shows the mean latency (±standard error of the mean, S.E.M) and amplitude data for each stimulus direction.
The maximum mutual IE for each response data set (see Materials and Methods) is shown with the relative latency from the peak response latency (delay) in Figure 4. All the IE data were more than “one”, indicating that the mutual IE increased after the stimulus onset. In 22 response data sets, nine data sets (41%) showed significant increase in IE (that is > 2.14, see Materials and Methods).
Generally, the data distributed after the peak response latency (mean ± S.D. was 45.9 ± 38 ms). The mean (±S.D.) delay for IE > 2.14 was 35.5 (±49.7) ms and that for IE < 2.14 was 53.1 (±27.3) ms. There was no significant difference of the delay between the data for IE > 2.14 and those for IE < 2.14 (by t-test, where significance was identified as p > 0.05).
Our five subjects in this study participated also in our previous study that examined the direction information in the response to continuous coherent motions [8]. Using these data, we examined whether there was any difference in the representation of direction information between apparent motion (AM) and continuous coherent motion (CM). The data for CM were the response data sets for the same subjects and locations at the speed of 7.0˚/s. Twelve response data sets for each motion (AM and CM) were used to compare the maximum IE, delay, peak response amplitude, and peak response latency.
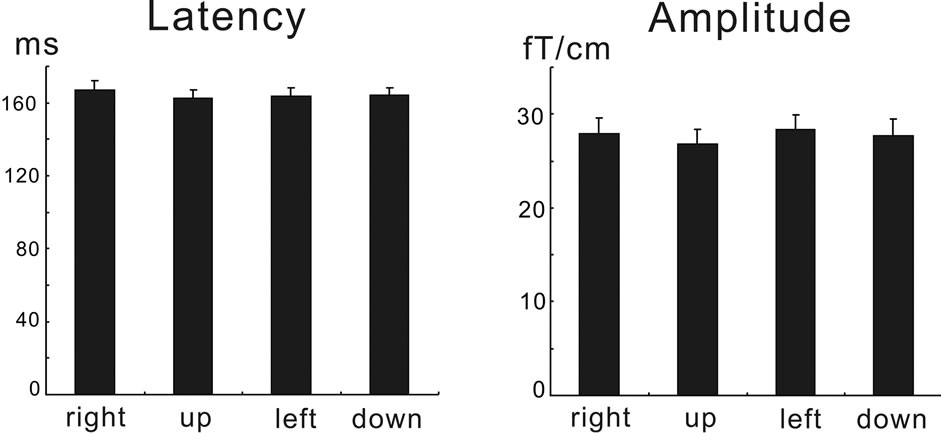
Figure 3. The peak response latency and amplitude data. The data were plotted as mean ±S.E.M. for each stimulus direction (right, up left, and down). There were no significant effects of direction on the data (see text).
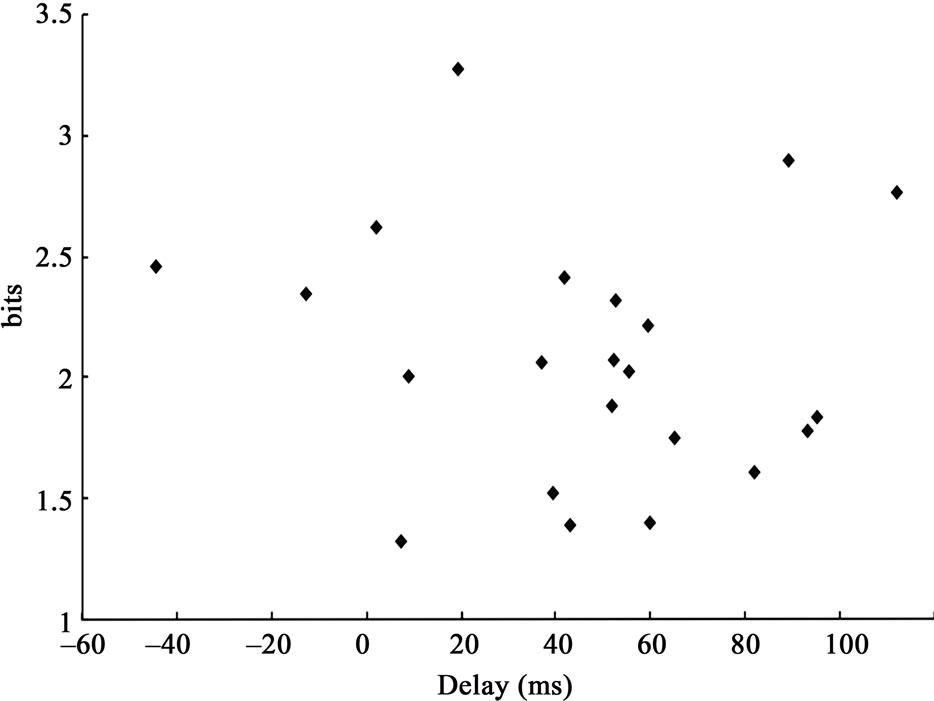
Figure 4. The maximum mutual information entropy (IE) plotted with the delay. The delay indicates the relative latency between the peak response latency and the maximum IE latency after the stimulus onset.
The results are shown in Figure 5. Paired t-tests revealed that the delay and the peak amplitude for AM were significantly larger than those for CM (p < 0.05), but there was no significant difference in the maximum IE or peak latency.
4. DISCUSSION
The peak response amplitude (20 to 30 fT/cm) and latency (160 to 170 ms) data for the apparent motion (Figure 1) were similar to those for the coherent motions noted in our previous studies [8]. The results were rather surprising considering the stimulus durations: the coherent motions were presented for 0.5 s but the apparent motion stimulus was the frame change in 16.7 ms because the refresh rate was 60 Hz. Our previous study,
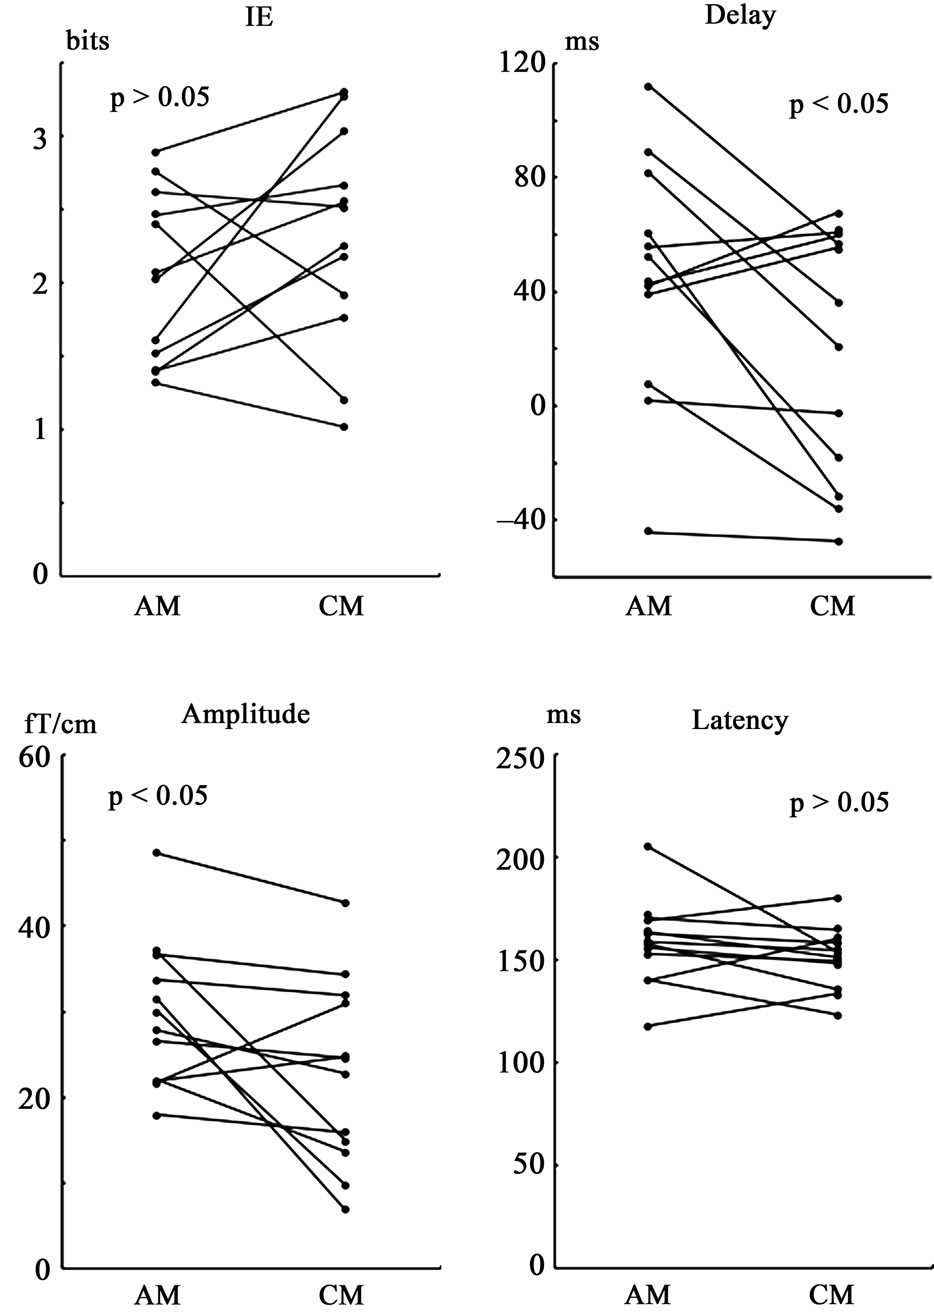
Figure 5. Comparison of the data between apparent motion (AM) and coherent motion (CM). Twelve response data sets (48 response waveforms) for five subjects were used to examine the difference in direction information representation in the response waveform between AM and CM. The maximum mutual information entropy (IE) and the peak latency (Latency) for AM were not significantly different from those for CM. The latency when maximum IE occurred relative to the peak response latency (Delay) for AM was significantly larger than that for CM. The peak response amplitude (Amplitude) for AM was also significantly larger than that for CM.
however, showed that the stimulus presentation of 10 ms was enough to perceive motion speed and that response latency was not different from that for the longer stimulus durations [10] using the light spot continuous motion. Although the study revealed the significantly smaller amplitude for the 10 ms presentation than that for the longer durations, the difference may be due to the stimulus presentation area. That is, the previous study used just one small light spot, but the present study used a random dot pattern over a larger area, which resulted in amplitudes similar to those for the longer stimulus presentation of coherent motion.
Consistent with our previous coherent motion study, the peak response latency and amplitude did not significantly vary with motion directions. The results were apparently inconsistent with the previous EEG study that showed the response amplitude for the N170 component was significantly varied with coherent motion directions [7]. This discrepancy could be due to the difference in the stimulus presentation conditions and the response measurement methods (EEG or MEG). It is well-known that the response waveforms for MEG tend to vary between subjects much more than those for EEG [16]. In the MEG study, the effect of motion direction on the response amplitude might have been obscured by the subjective difference of the response waveform.
The maximum mutual information entropy (IE) increased after the stimulus onset (frame change) (Figure 4). The mean latency relative to the peak response latency (delay) was 35.5 (±49.7) ms for IE > 2.14, which was similar to our previous finding for coherent motions [8]. The delay, however, was significantly larger for the apparent motion in this study than that seen for the coherent motion in our previous study [8] when the data for the subjects who participated in both studies were compared (Figure 5). The larger delay found for the apparent motion would not simply be due to the difference in the response properties (latency, amplitude, and signal to noise ratio of the response). The maximum IE was related to the response amplitude probably due to the signal to noise ratio [8]. Generally, lower response amplitude indicates lower stimulus intensity, which could cause slower direction information calculation. On the contrary, the mean response amplitude for the apparent motion was larger than that for the coherent motion (Figure 5). Further, the mean maximum IE for the apparent motion was similar to that for the coherent motions. These results suggest that the longer delay was not due to the lower stimulus intensity or signal to noise ratio of the response for the apparent motion.
It should be noted that the mean response latency for the apparent motion was similar to that for coherent motion, indicating that the time to reach maximum IE after the stimulus onset was actually increased for the apparent motion. There are two possible reasons for this delay: one is that the lower stimulus intensity due to the short presentation time for the apparent motion compared to the longer presentation time for the coherent motion. The other reason is that the neural process for the apparent motion perception is different from that for the continuous apparent motion. The former possibility may be negated because of the finding of higher response amplitude for the apparent motion as discussed above. We consider the latter possibility to be more plausible than the former possibility. This is because the previous MEG studies using different apparent motion stimuli suggested that the neural process for the perception of apparent motion and the process for the perception of non-motion (blink of the dot pattern in this study) occur at the same time [1,9,17]. After the random dot pattern shift, the process for the integration of the local motions has to interact or compete with the process for the integration of the non-motion blinks for the final perception image during the calculation of the correspondence noise between two possible dots [6]. Such a competitive process might be negligible for the perception of coherent motions because low correspondence noise information is available continuously. However, such information is provided instantaneously in an apparent motion stimulus even though the correspondence noise level for the apparent motion used in this study (shift of 0.17˚) might be similar to that for the coherent motion.
5. ACKNOWLEDGEMENTS
The authors thank Mr. Y. Takeshima for his technical assistance in the MEG experiment and Dr. A. Hashizume of Hiroshima University for providing the file transfer program.
REFERENCES
- Muckli, L., Kriegeskorte, N., Lanfermann, H., Zanella, F.E., Singer, W. and Goebel, R. (2002) Apparent motion: Event-related functional magnetic resonance imaging of perceptual switches and States. Journal of Neuroscience, 22, RC219.
- Muckli, L., Kohler, A., Kriegeskorte, N. and Singer, W. (2005) Primary visual cortex activity along the apparent-motion trace reflects illusory perception. PLoS Biology, 3, e265. doi:10.1371/journal.pbio.0030265
- Sterzer, P., Haynes, J.D. and Rees, G. (2006) Primary visual cortex activation on the path of apparent motion is mediated by feedback from hMT+/V5. NeuroImage, 32, 1308-1316. doi:10.1016/j.neuroimage.2006.05.029
- Braddick, O. (1974) A short-range process in apparent motion. Vision Research, 14, 519-527. doi:10.1016/0042-6989(74)90041-8
- Chang, J.J. and Julesz, B. (1983) Displacement limits for spatial frequency filtered random-dot cinematograms in apparent motion. Vision Research, 23, 1379-1385. doi:10.1016/0042-6989(83)90149-9
- Barlow, H. and Tripathy, S.P. (1997) Correspondence noise and signal pooling in the detection of coherent visual motion. Journal of Neuroscience, 17, 7954-7966.
- Mercier, M., Schwartz, S., Michel, C.M. and Blanke, O. (2009) Motion direction tuning in human visual cortex. European Journal of Neuroscience, 29, 424-434. doi:10.1111/j.1460-9568.2008.06583.x
- Kaneoke, Y., Urakawa, T. and Kakigi, R. (2009) Visual motion direction is represented in population-level neural response as measured by magnetoencephalography. Neuroscience, 160, 676-687. doi:10.1016/j.neuroscience.2009.02.081
- Kubota, T., Kaneoke, Y., Maruyama, K., Watanabe, K. and Kakigi, R. (2004) Temporal structure of the apparent motion perception: A magnetoencephalographic study. Neuroscience Research, 48, 111-118. doi:10.1016/j.neures.2003.10.006
- Kawakami, O., Kaneoke, Y., Maruyama, K., Kakigi, R., Okada, T., Sadato, N. and Yonekura, Y. (2002) Visual detection of motion speed in humans: Spatiotemporal analysis by fMRI and MEG. Human Brain Mapping, 16, 104-118. doi:10.1002/hbm.10033
- Maruyama, K., Kaneoke, Y., Watanabe, K. and Kakigi, R. (2002) Human cortical responses to coherent and incoherent motion as measured by magnetoencephalography. Neuroscience Research, 44, 195-205. doi:10.1016/S0168-0102(02)00129-3
- Wang, L., Kaneoke, Y. and Kakigi, R. (2003) Spatiotemporal separability in the human cortical response to visual motion speed: A magnetoencephalography study. Neuroscience Research, 47, 109-116. doi:10.1016/S0168-0102(03)00191-3
- Schlogl, A., Kemp, B., Penzel, T., Kunz, D., Himanen, S.L., Varri, A., Dorffner, G. and Pfurtscheller, G. (1999) Quality control of polysomnographic sleep data by histogram and entropy analysis. Clinical Neurophysiology, 110, 2165-2170. doi:10.1016/S1388-2457(99)00172-8
- Baddeley, R., Hancock, P. and Foldiak, P. (2000) Information theory and the brain. Cambridge University Press, Cambridge. doi:10.1017/CBO9780511665516
- Osborne, L.C., Bialek, W. and Lisberger, S.G. (2004) Time course of information about motion direction in visual area MT of macaque monkeys. Journal of Neuroscience, 24, 3210-3222. doi:10.1523/JNEUROSCI.5305-03.2004
- Kaneoke, Y. (2006) Magnetoencephalography: In search of neural processes for visual motion information. Progress in neurobiology, 80, 219-240. doi:10.1016/j.pneurobio.2006.10.001
- Kawakami, O., Kaneoke, Y. and Kakigi, R. (2000) Perception of apparent motion is related to the neural activity in the human extrastriate cortex as measured by magnetoencephalography. Neuroscience Letters, 285, 135-138. doi:10.1016/S0304-3940(00)01050-8