Open Journal of Internal Medicine
Vol.2 No.4(2012), Article ID:25583,4 pages DOI:10.4236/ojim.2012.24031
Prediction of maximal heart rate percent during constant intensity efforts on trained subjects
![]()
1Research Laboratory, “Sports Performance Optimization” National Center of Medicine and Science in Sports (CNMSS), Tunis, Tunisia
2Higher Institute of Sports and Physical Education, Kef, Tunisia
3Department of Physiology, Faculty of Medicine, Sousse, Tunisia
4Research Unit, High Institute of Sport and Physical Education, University of Sfax, Sfax, Tunisia
Email: *s_abedelmalek@yahoo.fr
Received 15 September 2012; revised 20 October 2012; accepted 18 November 2012
Keywords: Heart Rate Percent; Treadmill Exercise; Prediction; Triangular Test
ABSTRACT
The purpose of this study is to evaluate the relationship between %HRmax and %vVO2max at constant efforts made at different intensities. In randomized order, males healthy subjects (Age: 25 ± 7 years, Weight: 70 ± 11 kg, VO2max: 55 ± 8 ml·kg–1·min–1) were divided into two groups, a trained one with more than 3 training sessions per week (n = 10) a moderately trained one with 3 drives or less per week (n = 15). The difference between the two groups corresponds to a time to exhaustion above and below 40 min at 80% vVO2max. All subjects performed 5 tests with a gradual increase in speed of 1 km·h–1 every 2 min and 4 constant speed tests at 60%, 70%, 80% and 90% VO2max. All test were performed at the same time of day (i.e., 18:00 h). The results of this study showed that eighteen collective regressions including different independent variables were developed to predict %HRmax. The individual equations developed, have r values between 0.974 and 0.993 and Syx, between 1.2 and 1.9 ml·kg–1·min–1, they are more accurate than the collective equations (one equation for all subjects) with r values between 0.81 to 0.89 and Syx, between 4.1 and 5.3 ml·kg–1·min–1. In conclusion, this study has demonstrated that the model of predictions of %HRmax from %vVO2max in triangular tests were not appropriate for rectangular efforts. From the equations developed, we find that the time to exhaustion at 90% vVO2max is the best predictor of level of endurance then the time limit to 80% vVO2max.
1. INTRODUCTION
Recent technological advances have made heart rate (HR) monitoring during training highly accurate and inexpensive [1], and it is, therefore, a tool easily applied to regulating training intensities in various groups of subjects. The percent of maximal heart rate (%HRmax) method is widely used to describe training intensities in athletes, healthy sedentary subjects, and patients [2]. Training intensity is the key factor to improve VO2max, and several recommendations have been made on a %HRmax basis. Referring to Pollock et al. 1998 the American college of sports medicine [2] has recommended training intensity between 55% and 65% to 90% of maximal heart rate (HRmax), or between 40% and 50% to 85% of oxygen uptake reserve (VO2rest), or HR reserve. The prediction of HRmax equation (i.e., 220 – age [3]) is commonly used as a basis for prescribing exercise programs, as a criterion for achieving maximal exertion and as a clinical guide during diagnostic exercise testing. Despite its importance and widespread use, the validity of the HRmax equation has never been established in a sample that included a sufficient number of athletes. On the other hand, the determination of exercise intensity is essential for standardization and optimization training effort. For predominantly cardiovascular and aerobics exercises, the percentage of maximal oxygen uptake (%VO2max) which the physical effort runs, is probably the most specific way to express the high intensity exercises. However, this approach is impractical in the context of monitoring daily load training because of the complexity and the frequency of measurements to be made.
Contrary, heart rate or the %HRmax has long been recognized as a best tool that indicates the intensity of training. Indeed, the ratio of HRmax and HRrest is proportional to maximal oxygen uptake [4]. On the other hand, the HR may be influenced by several factors among which we can mention the training level, degree of hydration [5,6], relative humidity, and ambient temperature [7]. Moreover, the equations %HRmax vs. %VO2max reported in the literature [8,9] were compiled from multistage efforts (or “triangular”). However, general training used exercise at constant intensity (or “rectangular”) and for low and high intensity exercises specific to different sports practices [10]. Although we know that there is a cardiovascular drift depending on the duration of the effort and the magnitude of it depends on the intensity of effort, Verschuren et al. [11] state that we can consider whether standard curve %HR vs. VO2max during an established protocol of progressive high intensity is consistent with the values that prevail during types of long term intensity. Therefore, the relationship between %HRmax and %vVO2max at constant efforts made at different intensities were not yet more defined.
Therefore it is critical to verify whether a general model based on all individuals can give a realistic idea of %HRmax versus time and %VO2max during prolonged exercise at constant intensity and quantify the loss of accuracy compared to standard individual models. We can also calculate the loss of accuracy of these models to predict %HRmax if one uses the true HRmax of subjects or a prediction form the equation of Astrand and Rodhal [3] (HRmax = 220 – age).
2. MATERIALS AND METHODS
2.1. Subjects
25 males healthy subjects, were divided into two groups i.e., a trained one with more than 3 training sessions per week (n = 10) a moderately trained one with 3 drives or less per week (n = 15) participated in this study after having a thorough explanation of the protocol and signing a consent document. Participants gave their written consent to participate in this study. (Mean ± (SD); Age: 25.4 ± 7.25 years; Height: 174.6 ± 10.4 cm; Weight: 70.8 ± 11.5 kg and VO2max = 55.6 8.1 ml·kg·min–1). Subjects were non-smokers, do not consume caffeine or any alcoholic beverages and none of them was taking any medication. The study protocol complied with the Helsinki declaration for human experimentation and was approved by the University Ethics Committee.
2.2. Experimental Design
Before the start of the experimental period, the subjects performed 5 tests on treadmill preceded by a familiarization session to minimize the learning effects throughout the study [12-14]. All tests were separated by at least one rest day [15-17]. Subjects were asked not to make any workout or any physical effort, during the 24-h before the testing. After running for 2 min at 8 km·h–1 on a treadmill (0% slope), the speed was increased by 1 km·h–1 each 2 min until exhaustion. Then, we calculate the speed corresponding to 60%, 70%, 80%, and 90% VO2max using individual regressions vs. %VO2max speed.
After that, in a random order, 4 constant speed tests at 60%, 70%, 80%, and 90% vVO2max have subsequently been made. At 80% and 90%, subjects were run to exhaustion (t to exhaustion 80 and t to exhaustion 90) while for the tests at 70% and 60% vVO2max, tests were stopped after 60 min or, where appropriate, to exhaustion. At 60% and 70% vVO2max, the subject was disconnected from the system measuring expired gases between the 10th and 20th minute and between the 30th and 40th minute effort to minimize discomfort. All tests were performed at the same time of day (18:00 h).
For gas analysis, we used the system Moxus (Applied Electrochemistry AEI Technologies 300 William Pitt Way, Pittsburgh (Pennsylvania USA). The expired gases pass through an open circuit and they are analyzed in near real time while the results were averaged every 30 seconds. The VO2 and HR were measured continuously to determine VO2max and HRmax and plotted HR/VO2. Body weight was measured to the nearest of 0.1 kg using a Tanita digital scale (Tanita, Tokyo, Japan).
2.3. Statistical Analysis
All data are processed using Statistic 6.0 software (StatSoft, Tulsa, USA). Data were analysed by the multiple regression. The multiple regressions stepwise was used to develop models to predict %HRmax versus time and intensity (%vVO2max) during prolonged exercise at constant intensity and depending on whether other complementary variables as the standard curve %HR vs %VO2max obtained in a triangle test, VO2max, and t to exhaustion 80% vVO2max. Different regression models were established for all subjects (group models) and for each individual separately (individual models). As we were interested in modelling the phenomena of cardiovascular drift after the linear phase of rapid cardiovascular adjustment, only the values observed after the fifth minute effort were selected for this study.
3. RESULTS
Eighteen collective regressions including different independent variables were developed to predict %HRmax (Table 1). Whatever the model (regression individual or group) or the dependent variable is (% of maximum heart rate based on actual or predicted maximum heart rate), the same number of regression refers to the same set of independent variables. For reasons of brevity, only the most relevant regressions are presented starting from the individual models followed by collective models.
3.1. Individual Approach
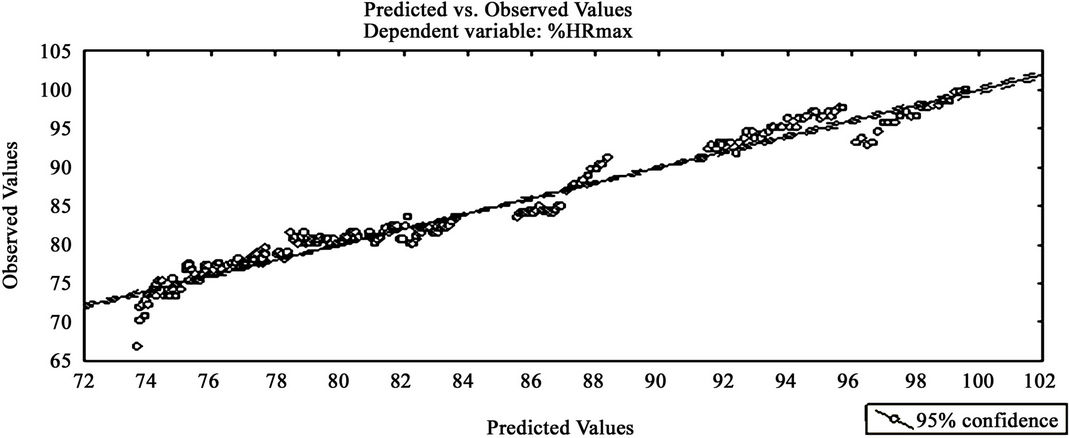
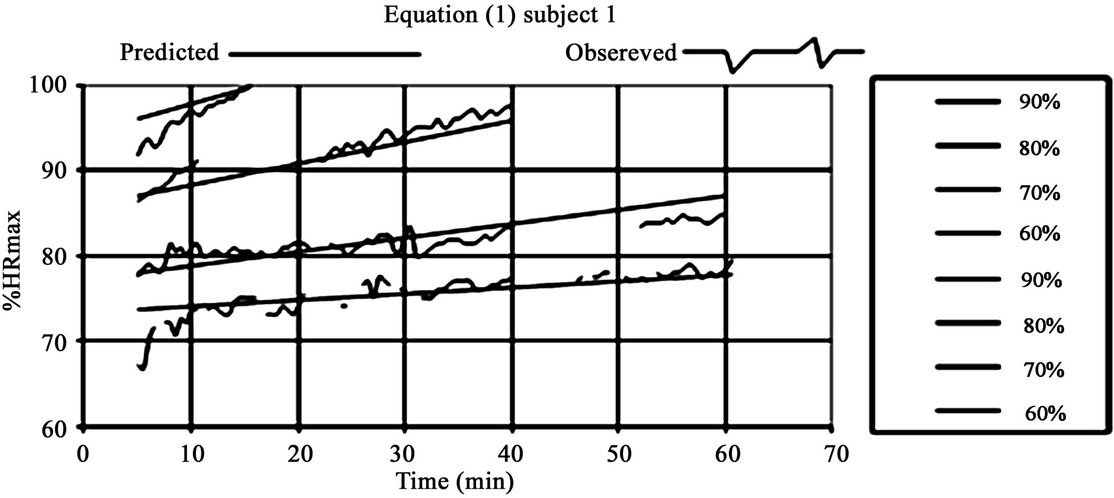
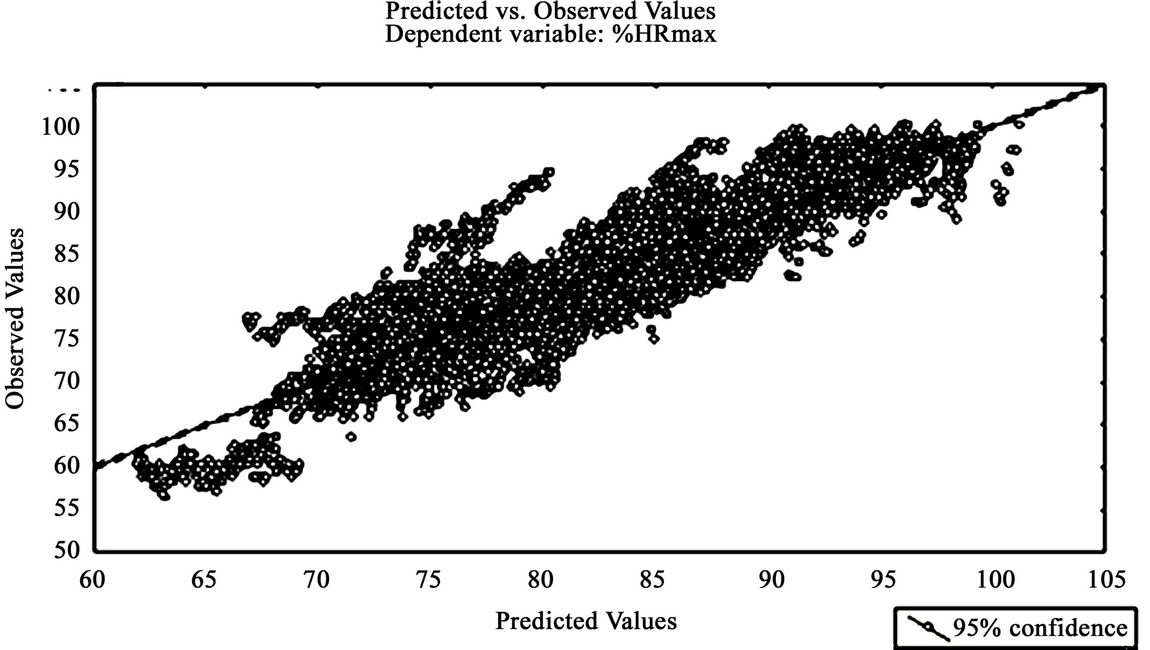
For individual regressions, the independent variables VO2max and tlim had no reason to be, only regressions 1 and 18 are presented. In addition to the basic variables (time and vVO2max%), regression 1 also takes account of the %HRmax observed on multistage test as same as %vVO2max while the equation 18 did not take account. The Figure 1 allow to assess the magnitude of random errors associated with individual regressions 1 and 18, while the comparison of real and predicted values versus time for each intensity (Figure 2) shows the magnitude of systematic errors for one individual.
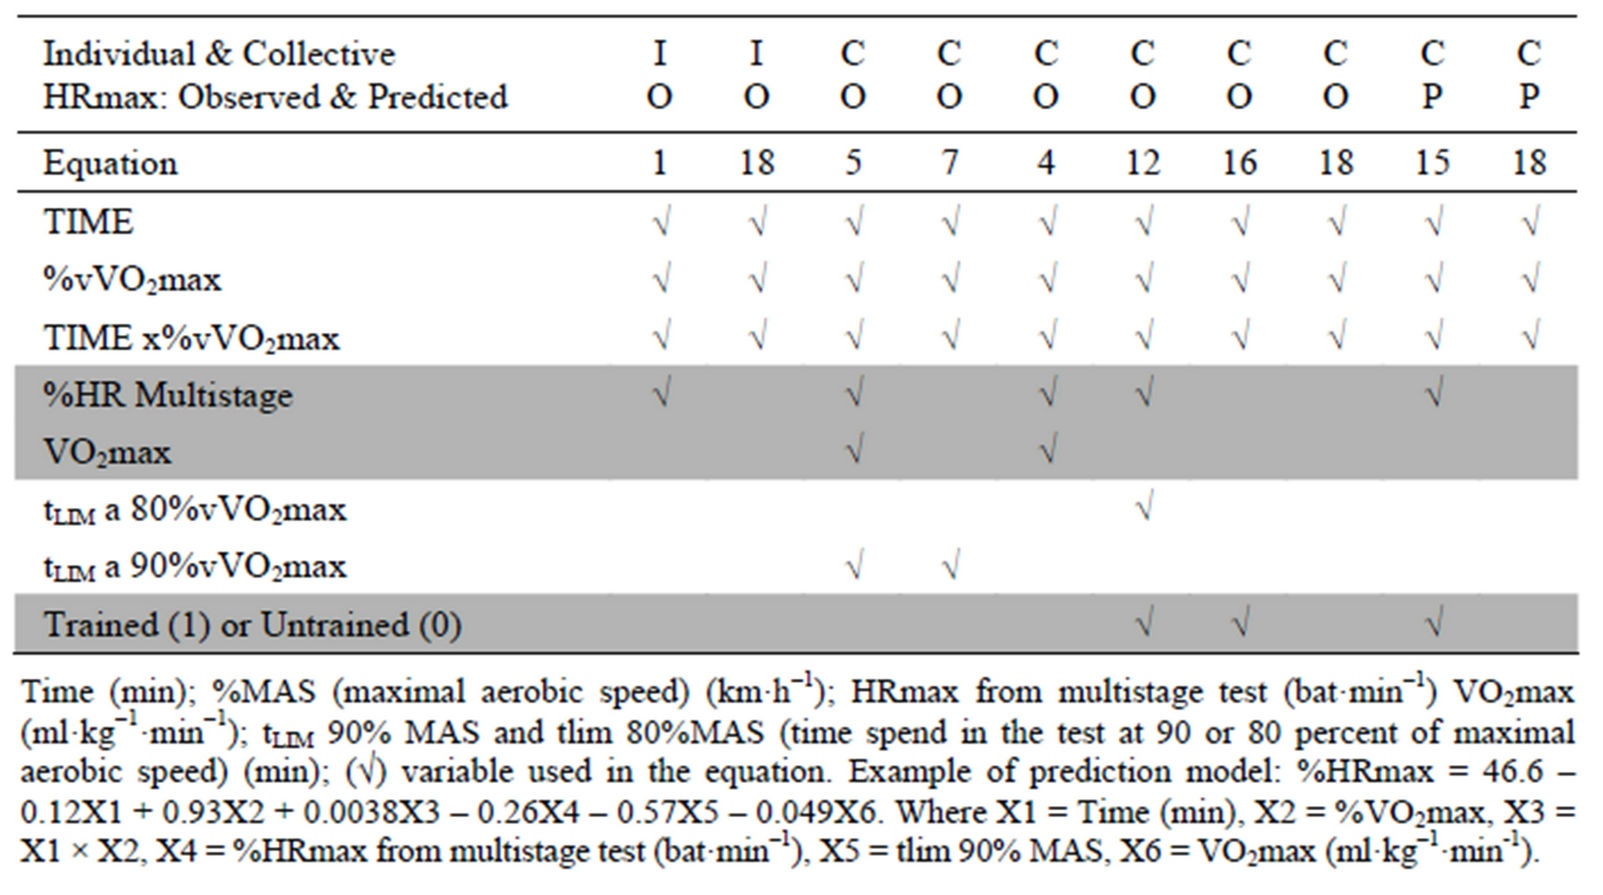
Table 1. Prediction models for %HRmax while running at constant speed at different speeds.
 (a)
(a)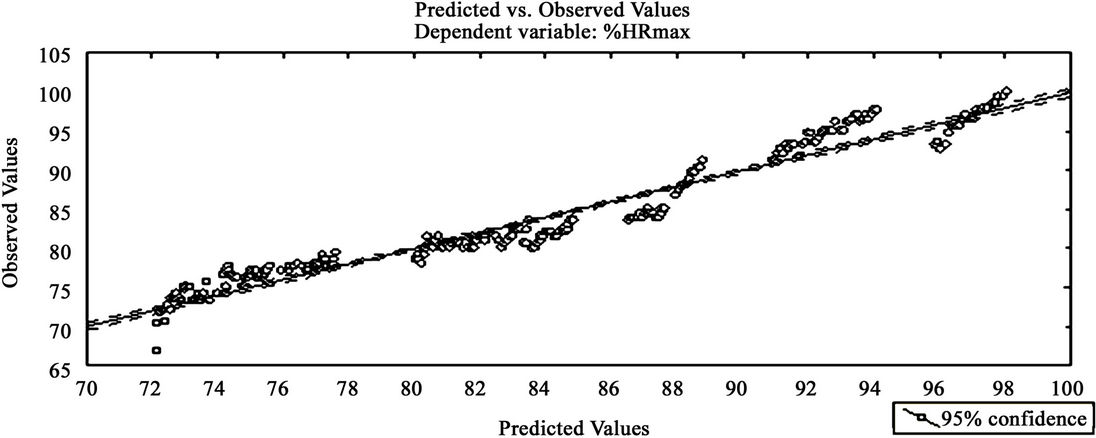 (b)
(b)
Figure 1. Relation of predicted and observed values for individual (a) Equation (1) Subject 1 (r = 0.984 and Syx = 1.426) EQ #1 predictors: Time, %vVO2max, Time x% vVO2max and %HRmax at same %vVO2max, (b) Equation (18) Subject 1 (r = 0.973 and Syx = 1.853) EQ #18 predictors: Time, %MAS, and Time x% MAS during the multistage test.
 (a)
(a) (b)
(b)
Figure 2. Evolution %HR predicted and observed at 60%, 70%, 80% and 90% MAS for individual Equation (1) (a), subject 1 EQ #1 predictors: Time, %MAS, Time x%vVO2max and %HRmax at same %MAS during the multistage test and (b) Equation (18) EQ #18 predictors: Time, %vVO2max, and Time x% vVO2max.
Even if these two regression models globally stick to reality, there are different slopes (more pronounced in this case) especially at 90% vVO2max, it is the same in other subjects in both groups (data not reported). We also note that taking account %HRmax through multistage standard test in the prediction of %HRmax during prolonged exercise at constant intensity, slightly improves the accuracy of the prediction (Figures 1 and 2).
3.2. Collective Approach
This section presents a selection of collective equations to show the influence of independent variables selected on the accuracy of predicted values. Furthermore, to be more concise and selective when two equations have similar correlations, we retained only those who had fewer independent variables (Equations (5), (7), (4), (12), (16) and (18)). Figure 3 show the best and worst equations (Equations (5) and (18), respectively). We immediately observe much more variation or inaccuracy for collective equations than for individuals ones.
Adding predicted %HRmax (= 220 – AGE) instead of true %HRmax as an independent variable in a collective equation to predict %HRmax during constant speed training considerably reduces the accuracy of the prediction.
General summary of results and for a better overview on the validity of the models, we can compare the correlation of different models (Figure 4) to see the clear superiority of individual models. The validity of collective models is inadequate on an individual basis and very greatly depending on the independent variables considered.
4. DISCUSSION
At the time of efforts, we showed that %HRmax in constant intensity does not depend only on the intensity of the effort (%vVO2max), but also on its duration as well as on the endurance (t to exhaustion with 80% or 90%vVO2max) and VO2max of the subjects. Since our first concern was to determine %HRmax at a constant intensity effort that is typically used in high intensity exercises, we chose to observe %HRmax as the dependent variable and %vVO2max as the independent variable. In order to predict %HRmax during rectangular effort, we tested several regression models. The simplest model includes only %vVO2max and the time effort of constant speed test (Equation (18)). Then in order to improve the accuracy of prediction, we tried to add other predicted variables such as VO2max and/or endurance of the subject measured by t to exhaustion 80% or 90% vVO2max or %HRmax predicted from %vVO2max standard individual multistage tests. This last variable and VO2max are readily available following a conventional multistage test, but t to exhaustion values require additional testing. Similarly if HRmax is not available, %HRmax was expressed as a percentage of maximum heart rate predicted by the classical formula “HRmax = 220 – age”. As expected, these collective approaches to predict %HRmax during constant speed effort did not all have the same degree of accuracy. Regarding random errors, express %HRmax from the formula “HRmax = 220 – age” causes more mistakes than from the maximum heart rate measured in the laboratory. In fact HRmax depends not only on age [18] but also physical fitness, exercise mode [19] and the continent of belonging [20,21] which increase the error of prediction of %HRmax during constant speed effort if HR is expressed in terms of predicted maximum heart rate rather than real HRmax. On the other hand, the accuracy of prediction improves gradually when added to %vVO2max, time, t to exhaustion, VO2mx and %HRmax
 (a)
(a)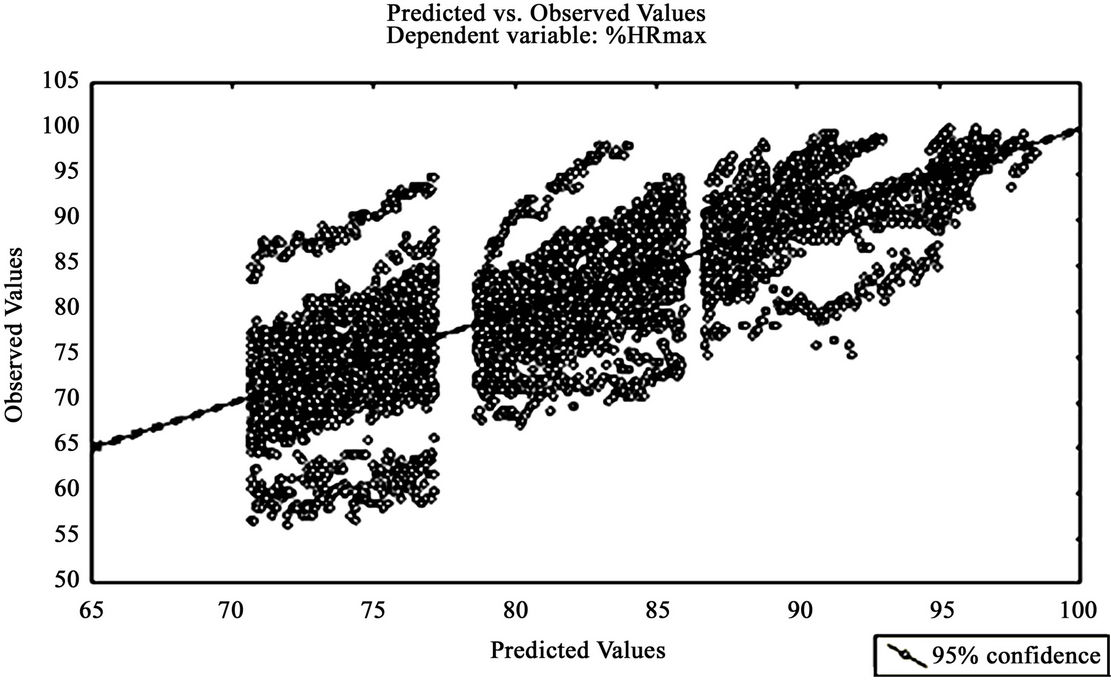 (b)
(b)
Figure 3. Relation of predicted and observed values for the best collective Equation (5) (r = 0.98 and Syx = 4.11) (a) and Equation (18) (r = 0.81 and Syx = 5.27)(b).

Figure 4. Values of the correlation of some representative equations (2 Individual first from the left, 6 Collective observed on the middle, Collective predicted the 2 last on the right).
predicted from the standard curve individual %HRmax/%v VO2max at the multistage test. In addition, t to exhaustion 90% vVO2max seems more accurate than t to exhaustion 80%vVO2max and also t to exhaustion is more accurate than %VO2max to predict maximum heart rate during rectangular effort. We know no other study attempting to describe and model systematically %HRmax based at %vVO2max and the time of constant effort. Many others [22-25] have studied the drift of HR in constant and prolonged efforts. Thus, previous studies [22, 26-28] also observed that training was associated with a drift less pronounced at lower %HRmax. The best collective model of this study gives an acceptable idea of the average evolution of %HRmax versus time and %vVO2max. But the main problem with the collective equations is that it translates into a slope of drift and vertical positions of %HRmax same for all so individually. The collective models to predict %HRmax are inadequate on an individual basis, we examined individual models. With these models, we can take into account the values of VO2max or t to exhaustion to improve the prediction since these values remain constant for a given individual. We have therefore chosen two models. Regarding random errors, there are not many differences between the two models studied and they are both excellent. Adding the values of %HRmax corresponding to %vVO2max observed in multistage test improves very little the prediction of %HRmax during constant effort on assessment. Nevertheless, individual models are clearly superior to collective models and appear sufficiently accurate to predict the values of %HRmax depending on the intensity (% vVO2max) and time at constant effort with estimated errors type below 2% HRmax. The model used provides a linear increase of %HRmax on depending of time with regular increases in slope between the intensities, which is not always the case. Thus we see especially at 90% vVO2max, significant differences between theoretical %HRmax and real %HRmax. On the other hand, if one relies on data from Figures 3 and 4, it seems that Equation (1) is also less prone to systematic errors than Equation (18), but analysis of data from 5 other subjects not shown shows in this respect, the two equations are equally good. We may question the interest of an individual model, as it must do all necessary tests to each subject to obtain it, in other words it cannot be experimentally a priori defined as the collective models. On the other hand, although it should be measured on at least 3 intensities, %HRmax can subsequently be predicted at other intensities without having to measure the subjects again. Moreover, if t to exhaustion or VO2max topics change, a new %HRmax can be estimated without having to redo the model.
5. CONCLUSION
The interest of this study was to develop equations that will allow calculating the %HR in function of different settings (time, strength, VO2max, 80% t to exhaustion vVO2max ...) in order to better adjust the intensity of training. The main idea is to take into account the data measured at efforts made at constant load to calculate the parameters for training qualitative. Overall the tests used to determine the intensity levels are of multistage type (steady increase of intensity) while training efforts are mainly constant. This study has demonstrated that model predictions of %HRmax from %vVO2max in multistage tests were not suitable for constant efforts. From equations developed, we have find among the indicators of level of endurance, the time limit to 90% vVO2max is a better predictor of %HRmax than the time limit to 80% vVO2max. The application of these relations on real data showed that only the use of individual equations on individual data gives consistent and acceptable results on an individual basis while collective models rather give an average description of the evolution of %HRmax as a function of time, vVO2max% of t to exhaustion, VO2max and a result of conventional multistage test. Additional research is needed to verify the applicability of the % HR max, %HRrest, %VO2max and %VO2 rest relationships within the context of actual aerobic training, in different populations and for high intensity intermittent exercise of different sports practices.
6. ACKNOWLEDGEMENTS
This study was supported by the Ministry of Higher Teaching and Scientific Research, Tunisia. We are grateful to all of the players who participated so willingly in the study.
REFERENCES
- Godsen, R., Carrol, T. and Stone, S. (1991) How well does the Polar Vantage XL Heart Rate Monitor estimate actual heart rate? Medicine & Science in Sports & Exercise, 23, 14.
- American College of Sports Medicine (2000) ACSM’s guidelines for exercise testing and prescription. Lippincott Williams & Wilkins, Philadelphia, 145-147.
- Astrand, P.O. and Rodhal, K. (1970) Textbook of work physiology. McGraw-Hill, New York.
- Uth, N. (2005) Gender difference in the proportionality factor between the mass specific VO2max and the ratio between HRmax and HRrest. International Journal of Sport Medecine, 837, 443.
- Monod, H., Saint-Saens, M., Scherrer, J. and Soula, C. (1958) Oxygen content of efferent blood from a muscle performing dynamic work. Journal of Physiology, 50, 417-420.
- Rowell, L.B., Taylor, H.L. and Wang, Y. (1964) Limitations to prediction of maximal oxygen intake. Journal of Applied Physiology, 19, 919-927.
- Nimmerichter, A., Williams, C., Bachl, N. and Eston, R. (2010) Evaluation of a field test to assess performance in elite cyclists. International Journal of Sports Medicine, 31, 160-166. doi:10.1055/s-0029-1243222
- Londeree, B.R. and Ames, S.A. (1976). Trend analysis of the %VO2max-HR regression. Medicine Sciences Sports, 8, 123-125.
- Leger, L., Gutierrez, A., Choinière, D. and Ricart, R.M. (1991) La relation %FCmax-%VO2 max en fonction de l’âge. du sexe et de l’ergomètre. Science et Sports, 6, 65.
- Hiilloskorpi, H.K., Pasanen, M.E., Fogelholm, M.G., et al. (2003) Use of heart rate to predict energy expenditure from low to high activity levels. International Journal of Sports Medecine, 24, 332-336. doi:10.1055/s-2003-40701
- Verschuren, O., Maltais, D.B. and Takken, T. (2011) The 220-age equation does not predict maximum heart rate in children and adolescents. Developmental Medicine & Child Neurology, 53, 861-864. doi:10.1111/j.1469-8749.2011.03989.x
- Chtourou, H., Zarrouk, N., Chaouachi, A., Dogui, M., et al. (2011) Diurnal variation in Wingate-test performance and associated electromyographic parameters. Chronobiology International, 28, 706-713. doi:10.3109/07420528.2011.596295
- Chtourou, H., Chaouachi, A., Driss, T., Dogui, M., et al. (2012) The effect of training at the same time of day and tapering period on the diurnal variation of short exercise performances. Journal of Strength and Conditioning Research, 26, 697-708.
- Chtourou, H., Chaouachi, A., Hammouda, O., Chamari, K., et al. (2012) Listening to music affects diurnal variation in muscle power output. International Journal of Sports Medicine, 33, 43-47. doi:10.1055/s-0031-1284398
- Chtourou, H., Driss, T., Souissi, S., et al. (2012) The effect of strength training at the same time of the day on the diurnal fluctuations of muscular anaerobic performances. Journal of Strength and Conditioning Research, 26, 217- 225. doi:10.1519/JSC.0b013e31821d5e8d
- Chtourou, H., Hammouda, O., Chaouachi, A., et al. (2012) The effect of time-of-day and Ramadan fasting on anaerobic performances. International Journal of Sports Medicine, 33, 142-147. doi:10.1055/s-0031-1286251
- Horne, J.A. and Östberg, O. (1976) A self-assessment questionnaire to determine morningness-eveningness in human circadian rhythms. Chronobiology International, 4, 97-110.
- Whaley, M.H., Kaminsky, L.A., Dwyer, G.B., et al., (1992) Predictors of overand underachievement of agepredicted maximal heart rate. Medicine & Science in Sports & Exercise, 24, 1173-1179.
- Tanaka, H., Monahan, K.D. and Seals, D.R. (2001) Agepredicted maximal heart rate revisited. Journal of the American College of Cardiology, 37, 153-156. doi:10.1016/S0735-1097(00)01054-8
- Londeree, B.R. and Moeschberger, M.L. (1984) Influence of age and other factors on maximal haert rate. Journal of Cardiopulmonary Rehabilitation, 4, 44-49.
- Vidalin, H., Fellmann, N., Leymonie, R., et al. (1989) Consommation maximale d’oxygène directe et indirecte. Fréquence cardiaque maximale réelle et théorique. Sciences et Sports, 4, 71-77. doi:10.1016/S0765-1597(89)80009-7
- Ekelund, L.G. (1967) Circulatory and respiratory adaptation during prolonged exercise. Acta Physiologica Scandinavica, 292, 1-38.
- Casaburi, R., Storer, T.W. and Wasserman, K. (1987) Mediation of reduced ventilatory response to exercise after endurance training. Journal of Applied Physiology, 63, 1533-1538.
- Laurencelle, L., Lajoie, C. and Trudeau, F. (2000) Physiological responses to cycling for 60 minutes at maximal lactate steady state. Canadian Journal of Applied Physiology, 25, 250-261. doi:10.1139/h00-019
- Coyle, E.F. and Gonzalez-Alonso, J. (2001) Cardiovascular drift during prolonged exercise: New perspectives. Exercise and Sport Sciences Reviews, 29, 88-92. doi:10.1097/00003677-200104000-00009
- Rowell, L.B., Murray, J.A., Brengelmann, G.L. and Kraning, K.K. (1969) Human cardiovascular adjustments to rapid changes in skin temperature during exercise. Circadian Research, 24, 711-724. doi:10.1161/01.RES.24.5.711
- Mullin, W.J., Herrick, R.E., Valdez, V. and Baldwin, K.M. (1984) Adaptive responses of rats trained with reductions in exercise heart rate. Journal of Applied Physiology, 56, 1378-1382.
- Grant, S.M., Green, H.J., Phillips, S.M. and Sutton, J.R. (1997) Effects of acute expansion of plasma volume on cardiovascular and thermal function during prolonged exercise. European Journal of Applied Physiology Occupational Physiology, 76, 356-362. doi:10.1007/s004210050261
NOTES
*Corresponding author.