Open Journal of Antennas and Propagation
Vol.05 No.02(2017), Article ID:77274,20 pages
10.4236/ojapr.2017.52006
Enslavement of Wireless Sensor Network to an RF Energy Harvesting System
Alex Mouapi, Nadir Hakem
Underground Communication Research Laboratory, University of Québec in Abitibi-Témiscamingue, Val d’Or, Canada

Copyright © 2017 by authors and Scientific Research Publishing Inc.
This work is licensed under the Creative Commons Attribution International License (CC BY 4.0).
http://creativecommons.org/licenses/by/4.0/


Received: May 31, 2017; Accepted: June 25, 2017; Published: June 28, 2017
ABSTRACT
The abundance of telecommunications systems makes it possible to have somewhat significant quantity of radiofrequency energy in the environment. This energy can be recycled to power ultra-low-power devices such as Wireless Sensor Network (WSN). In this paper, the performance of a miniature RF/DC converter is evaluated in order to enslave a WSN’s performance to the amount of the recovered energy. More precisely, a highly sensitive and efficient rectifier is designed to achieve optimum performance in the GSM band. The design method relies on a judicious choice of the rectifying diode which is the basis of most losses in a rectifying antenna (rectenna). Optimum performance is achieved by using the gradient method search proposed in the Advanced Design System (ADS) software. A rectifier based on Schottky diodes HSMS 2850 used in a voltage doubler topology is thus obtained. A maximum RF/DC conversion efficiency of 36% is reached for an RF input power level of 10 dBm. An energy budget of a sensor node in a WSN having an equitable distribution of network loads is then defined and used to evaluate the performance of the WSN regarding the distance at which the Base Station (BS) can be located. The Low Energy Adaptive Clustering Hierarchy (LEACH) protocol is used for this purpose. The distance separating the WSN from the BS is used as the enslavement parameter. Our analysis shows that increasing the duration of each round results in an increase in the range of the WSN. As an example, a network with 100 nodes distributed over an area of  may be located at 1.3 km from the base station when each node of the WSN must perform measurements every 1 min.
Keywords:
WSN, Rectenna, HSMS 2850 Diode, RF/DC Efficiency, Leach Protocol

1. Introduction
The need to control the environment in order to prevent natural disasters has accelerated in recent years the development of sensor nodes [1] . These are miniature devices capable of performing simple measurements in their immediate environment. The deployment of several of them for the purpose of collecting and transmitting data via radio waves constitutes a Wireless Sensors Network (WSN). Unlike wired networks, a WSN has the advantage of providing network mobility, thus offering more flexibility. Moreover, the absence of wired connections is a great advantage because a wired system encompassing numerous nodes can be troublesome for some applications such as structural monitoring [2] . For example, an application like the Internet of Things (IoT) envisages incorporating hundreds or thousands of sensor nodes into the same building, for monitoring people present, light, heating and other environmental conditions with an excellent resolution [3] [4] . On the other hand, it should be noted that the popularity of the WSNs has also been facilitated by recent advances in the development of miniature rechargeable batteries [5] which provide to the sensor node a lifetime closely related to the capacity of the battery. This heavy reliance on the battery has become over time a limitation in the deployment of WSNs because maintenance operations that involve recharging or replacing batteries can be costly when the WSN is located in a hard-to-reach location. The solution envisaged to overcome this limitation is the recycling of any form of ambient energy (wind, sun, light, vibration, electromagnetic wave, heat, etc.) located in the immediate environment of the sensor node. This research area is known as Energy Harvesting [6] .
An Energy Harvesting process consists of converting one of the above-men- tioned primary energy sources into DC electric power. Energy Harvesting techniques thus differ from one to another by the nature of the used primary source. Sources such as the wind, vibrations, and the sun are now well known and have demonstrated through the various used transduction mechanisms, to be able to generate significant amounts of energy [6] [7] [8] . However, it is clear that these sources are intermittent because they depend on for some of the seasons (wind, Sun), for others on temperature (heat) and others still, the functioning or not of a mechanical engine (vibration). It is for this reason that in this paper, the choice is focused on radio frequency energy that although at a lower level compared to other primary energy sources, shows a more constant presence due to the number of radiation sources (Figure 1).
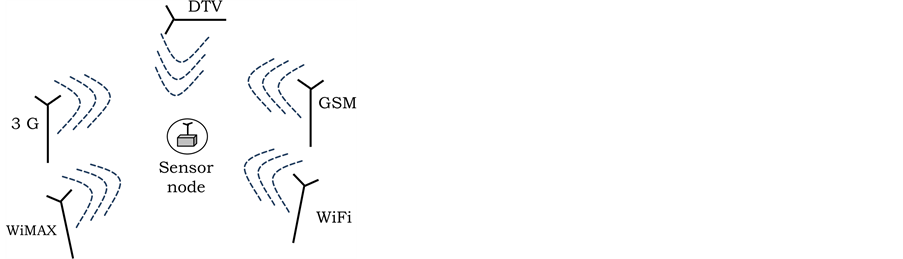
Figure 1. Some radio wave radiations sources.
In its environmental control function, the main tasks of a WSN are monitoring (which involves the capture of environmental data and their recording) and the transmission of information [10] . Thus, if the nodes of a WSN are considered to be supplied from the ambient RF energy, it is necessary to ensure the system's operability, to define the specifications of the WSN based on the amount of recoverable energy. Note that the optimal operation of such combination is related to a maximization of the performance of the RF micro generator associated with a minimization of energy consumption of the sensor node. Also, to ensure the efficient operation of the sensor node in a ‘‘deploy and forget’’ mode, it is important to enslave it to the amount of recovered energy. In this work, the enslavement consists in defining the operating limits of the autonomous node regarding the maximum data sizes, the duty cycle, and the WSN range. For this reason, in the first part of this work, the quantification of the energy dissipated in a WSN with an equitable distribution of loads is proposed. In the second part of this paper, the design of a highly sensitive and efficient rectifier will be addressed. The GSM band known to demonstrate a high power density [11] according to the ambient measurements reported in the literature is considered. Finally, from the amount of the recovered energy, the distance between the base station and the WSN will then be used as the enslavement parameter of the WSN. The different results obtained in this work will be presented in the following order. A brief state of the art of previous works is proposed in section 2. Section 3 evaluates the amount of energy dissipated by a sensor node in a WSN with fairly distributed loads. Section 4 will discuss the design of a miniature, highly sensitive and efficient rectifier. In section 5, it will address the performance of a stand-alone WSN based on the recovered energy. Finally, a conclusion introducing some avenues to improve this work will be presented in section 6.
2. Previous Works and Main Contributions
In order to feed a WSN from a rectenna, it is important to define the WSN specification, to take into account both the progress made in the past years in the maximization of the performance of the rectennas and those carried out in the minimization of the consumption of the sensor nodes. For a rectenna, the various components that constitute it are shown in Figure 2. An antenna captures the ambient RF signals, and a rectifier is then used to convert the RF signals to

Figure 2. Main function blocks of the rectenna circuit [9] .
DC signals. An HF filter is used to perform the impedance matching between the antenna and the rectifier circuit [9] .
Obviously, the aim of designing a rectenna is maximizing its RF/DC conversion efficiency given the randomness of the amount of recoverable power. For this, some research proposes solutions allowing to increase the power captured by the antenna; this through the design of higher gain omnidirectional antennas [12] [13] . Other research focuses on the design of HF filters that allow matching between the antenna and the RF/DC converter [14] . Most published research papers do not pay particular attention to losses due to the internal elements constituting the rectifying diode. This work then addresses an optimization of the performance of a rectenna under the basis of a judicious choice of the rectifying diode (section 4).
Regarding the measurement and the transmission of environmental data such as humidity, temperature, pressure, etc., the different steps shown in Figure 3 must be integrated [15] .
The sensor’s role is to convert the physical quantity under control into an electrical AC signal. After processing the data by the processor, it sends them to the transmitter whose role is to transfer the information to the base station or another sensor node, depending on the network configuration. It is then necessary to take into account all these dissipation sources present in the process of capture of environmental data. It should be noted that the energy budget of a sensor node is influenced by its function in the network which itself depends on the network topology. Several topologies exist for WSNs; the main ones being, star, mesh and clustered network (Figure 4). Star topology (Figure 4(a)) is composed of a central node called coordinator or sink of the network and multiple sensor nodes. In this topology, all nodes capture and transmit the data directly to the sink. In the mesh topology (Figure 4(b)), the nodes are identical, and the information is routed gradually to the base station. Some nodes in the network must then be a gateway. In the cluster topology (Figure 4(c)), local processing is performed before transmission to the base station. Clustering is the grouping of sensor nodes into clusters based on some criteria and selecting the most efficient node as Cluster Head (CH) from each cluster.
As shown in Figure 4, depending on the network topology, the sensor nodes have different levels (simple node, a gateway node, sink node, CH node). Assuming that the network area is subject to the same amount of recoverable energy, it is important to choose a network topology in which nodes will have
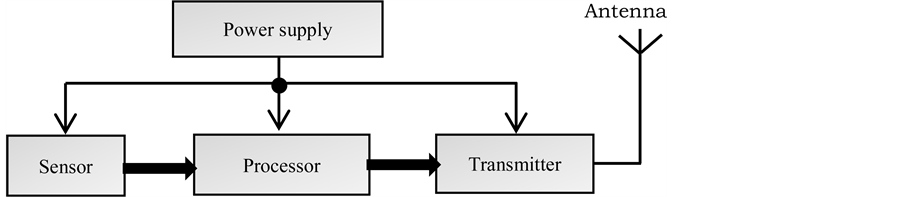
Figure 3. Hardware diagram of sensor node [13] .

Figure 4. Main topologies of WSN.
the same activity (i.e. a more equitable distribution of network load to different nodes that comprise it). Thus, any optimization of the harvester system (rectenna) helps to increase the capacity of the entire network. For example, in our previous research [15] , a piezoelectric energy harvesting system was considered to power the sensor nodes in a star topology. Loads of the sink, being higher than those of the ordinary node, the amount of recovered energy allowed to operate ordinary node in the network with a packet size up to 105.5 kbits. However, the sink could not operate if an optimization of the recovery system was not considered. The same problem would occur in a mesh topology network where gateway nodes have higher loads than ordinary node. The cluster topology in its original form allows distributing the network loads between the various clusters by decentralizing the aggregation of data. Note that, more than the topology, consumption of a node is also influenced by the algorithm that governs communications between the different nodes in the network. From the perspective of equitable loads distribution between the different nodes of the WSN, the Low-Energy Adaptive Clustering Hierarchy (LEACH) protocol is best suited [16] . This work then proposes to quantify the energy consumption of a sensor node in a CH WSN with LEACH protocol (section 3). Once this quantification has been made, the energy need will be compared to the energy recovered by a rectenna in section 5.
3. Energetic Budget of a Sensor Node in a Leach WSN
The basic concept developed in Leach WSN is to divide the operation of the WSN into a round, and in each round there is a CH change, thus avoiding the depletion of the energy of a node [17] . At the beginning of each round, some sensor nodes are designated as CH, this by their energy level which itself depends on the number of times the node has been selected as CH in the previous rounds. It forms a cluster with its neighboring nodes; these will transmit to his the data collected from environment under surveillance. To avoid collisions, the BS schedules transmission time based on Time Division Multiple Access (TDMA). In this paper, we assume that all sensor nodes within a CH also use the TDMA to access their CH. Each round is divided into two phases; that of the cluster formation known as the setup phase and that of the data collection referred to as the steady phase. When the clusters were created during the setup phase, each node in the cluster decides whether or not to be the CH for the current round. The decision is made by the comparison of a threshold  with a random number between 0 and 1 taken by the node. The decision threshold is defined as [18] :
 (1)
(1)
where  is the predetermined percentage of cluster heads,
  is the current round and
  is the set of nodes that have not been cluster heads in the last
  rounds. If the choosing number by the node
  is less than a threshold
 , the node
  becomes a cluster-head for the current round. By using the threshold
 , each node will be a CH at some round within
  rounds. After
  rounds, all nodes are once again eligible to become CH.
To quantify the energy dissipated during a round by a node, the radio model presented in [17] is used (Figure 5). Since the energy of the setup phase is negligible [17] [18] [19] , only the energy consumed during the steady phase for transmission and reception of data will be considered in this study. The other following reasonable assumptions are also made:
・ the WSN is assumed homogeneous; the sensor nodes are identical and measure the same physical data;
・ the sensor nodes measure the same amount of data and are all located at an average distance  from the CH;
・ the fixed BS is located far from the sensor field. Thus all CH are approximately at the same distance  from the BS;
・ the clusters are circular in shape and are all the same size: the WSN includes  uniformly distributed sensors in a region of surface
 . Each cluster includes
  nodes on a surface
 .
.
・ the Friis space model is considered for communication inside the cluster while the multipath fading model will be used for communication between the CH and the BS [20] ;
・ a perfect aggregation of data is made in the CH [17] .
At each round, two types of nodes coexist in the WSN; the ordinary node (ON) and the Cluster Head (CH). The ON sense data and transmit to CH; while the CH have to collect data from ONs, aggregate the data and send it to the BS. The behavior of the two types of nodes is illustrated by diagrams shown in Figure 6.

Figure 5. Simple energy dissipation model.

Figure 6. (a) ON behavior (b) CH behavior.
If  is the probability of being elected CH during a round, then the energy consumed by any node can be defined as:
 (2)
(2)
where  is the energy consumed by the CH and
  the energy consumed by an ordinary node during a round. The energy dissipated in the entire WSN during a round can be defined as:
 (3)
(3)
with  representing the number of cluster and
  is the energy dissipated in a cluster defined as follows:
 (4)
(4)
 is the total number of nodes in the WSN. Once collected measures the ON just have to transmit them to the CH as shown in Figure 6. Then the dissipated energy per round in ON is expressed as:
 (5)
(5)
The CHs nodes have to collect data from ONs, aggregate the data and send it to the BS. Thus, the energy budget of the CH is defined by:
 (6)
(6)
where  is the number of bits per packet,
  is the energy consumption per bit in the transmitter and receiver circuitry,
  is the multiple attenuation model amplifier energy consumptions for free space propagation model used for short link,
  is the covered area by the WSN,
  is the transmit amplifier for two rays and
  is the energy for data aggregation.
If the CH is assumed to be the center of mass of the cluster, the expected squared distance from the nodes to the cluster head  is defined as:
 (7)
(7)
where  is the joint probability density function. Since the sensor nodes are distributed uniformly on a circular surface,
  with
with . Thus,
 (8)
(8)
Substituting Equation (8) into Equation (5) gives:
 (9)
(9)
By substituting Equation (9) and Equation (6) into Equation (3), a simulation of the consumption of a WSN of size  comprising
The Figure shows that the number of heads is a very important parameter. By
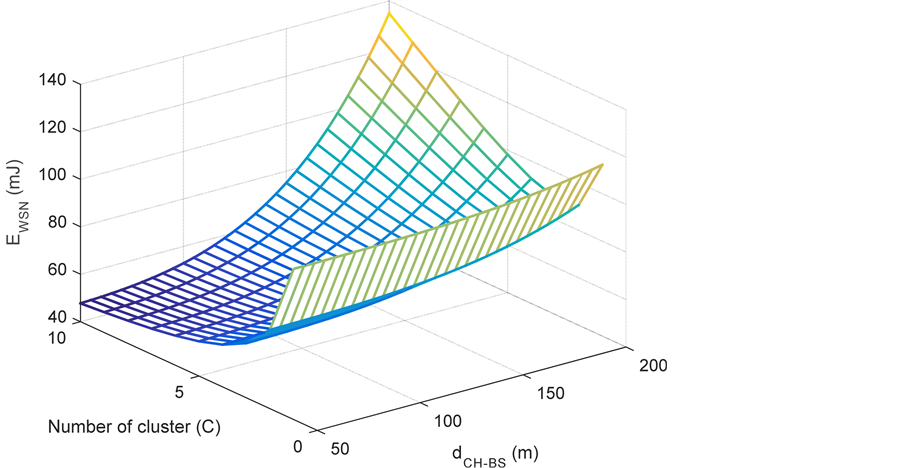
Figure 7. Node energy dissipation versus the number of head and the distance to BS.

Table 1. Simulation parameters.
differentiating,  with respect to
  and equating to zero, the optimal number of clusters is given by:
 (10)
(10)
The optimal probability of a node to become a cluster head can be defined as follows:
 (11)
(11)
The minimum energy consumed by a node will then be defined by:
 (12)
(12)
Subsequently, the amount of recoverable energy from the electromagnetic waves is compared with the energy requirement of the sensor node. The distance between the base station and the WSN is used as an enslavement parameter of the WSN.
4. High-Efficiency RF/DC Converter for Ambient Power Harvesting in GSM Band
One of the objectives of this work is to propose a miniature circuit that allows converting the ambient RF energy in the most efficient way possible. The GSM band known for having a good power density [11] is considered. The miniaturization of the circuit will go through a judicious choice of the rectifying diode. The selected diode can then be placed in a voltage doubler rectifier, (Schenkel voltage doubler in this paper) as shown in Figure 8. The circuit delivers at its output a DC voltage equal to twice the amplitude of the input AC signal.
4.1. Rectifying Diode Selection
The used rectifying diode is an essential element of the rectenna since it forms the basis of the shaping of RF signals picked up by the antenna. Considering the high frequency of the signals and given the very low received power density, it is important to design a high-sensitivity rectifier circuit to have an amount of usable DC power. A list of most recently used diodes in the rectenna design, as well as the maximum conversion efficiencies reached, is shown in Table 2.
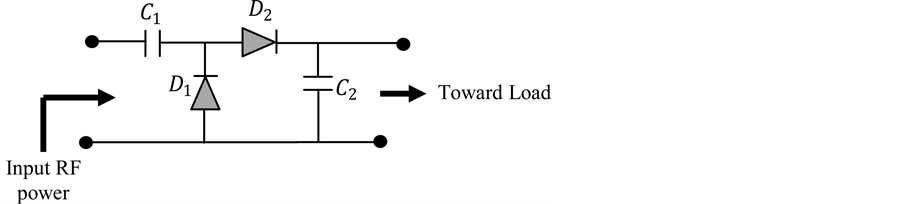
Figure 8. Schenkel voltage doubler rectifier.
Table 2. Recently used rectifying diode.
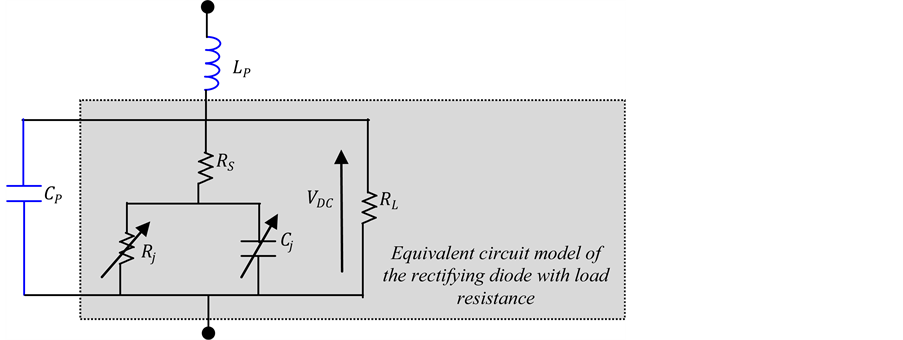
Figure 9. Small signal model of a Schottky diode with parasitic elements.
The results recalled in Table 1 shows that the conversion efficiency depends on the type of the used rectifying diode. The conversion efficiency is obtained from the small signal model of the Schottky diode shown in Figure 9.
In this Figure,  is the series resistance;
  is the junction capacitance,
  the junction resistance and
  the voltage across the semiconductor-metal junction. The junction capacitance
  depends on the voltage applied across the junction according to the following equation [25] :
 (13)
(13)
where  is the output DC voltage across the resistive load, and
  is the diode’s zero bias junction capacitance.
  and
and  materialize imperfections introduced by the housing of the component.The series inductance
  is associated with the external terminals which connect the internal component to the external circuit. The capacitance
  models the fact that all the solid materials of the housing have related dielectric constants [26] .
The RF/DC transformation goes through the four stages characterized by the different conversion efficiencies shown in Figure 10.
 represents the matching efficiency. It characterizes the losses due to the insertion of the matching filter between the antenna and the rectifier circuit. These losses are more detrimental at high frequency, and for a single stage matching network [28] . The maximization of the matching efficiency

Figure 10. Efficiency link of a rectifying circuit, from RF power to dc power [27] .
requires a minimization of the reflection coefficient  which is defined in [29] as:
 (14)
(14)
where  is the impedance of the diode view of the source and
  is the source impedance set at 50 Ω. Depending on the internal diode elements (Figure 9), the reflection coefficient can be written as follows:
 (15)
(15)
where  is the angular frequency. At high frequency, the product
 , thus minimizing the matching losses is to choose
  as close as possible to 50 Ω.
 (Figure 10) is the RF/DC conversion efficiency of the diode. By applying the Kirchoff’s voltage law, a closed-form equation has been derived in [25] as follows:
 (16)
(16)
with:
 (17)
(17)
where  is the forward-bias turn-angle. It is a dynamic variable that depends on the input power of the diode (and thus of the output DC voltage) as follows [25] :
 (18)
(18)
 is the DC power transfer efficiency. A Maximum Power Point Transfer (MPPT) circuit allows maximizing this efficiency by keep track of the maximum efficiency operating condition. This issue is not discussed here since the MPPT is now a classical function [30] . Table 3 below represents the characteristics of the most recently used rectifying diodes in the rectennas design. Based on these different characteristics, a comparison of the RF-to-DC con-
Table 3. Electrical parameters of the recently used diodes.
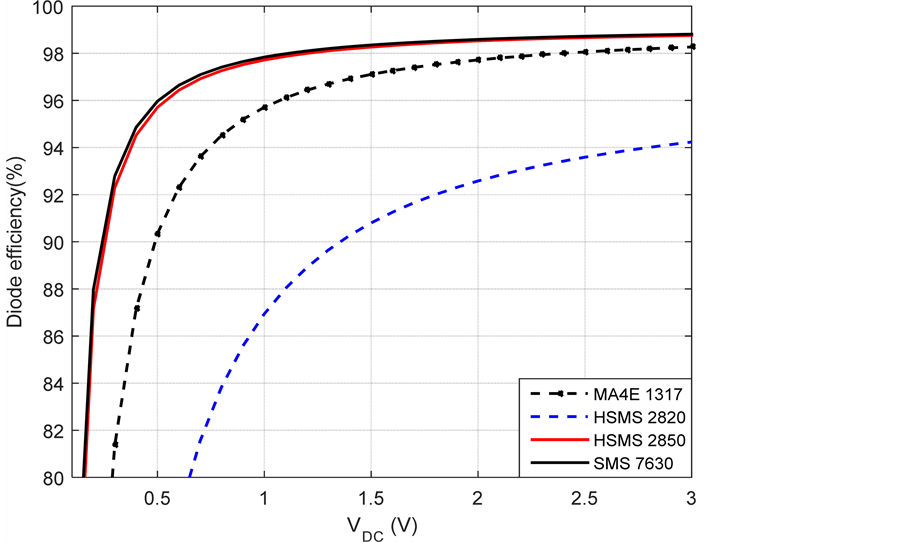
Figure 11. RF/DC conversion efficiencies comparison .
.
version efficiency of the diodes under study is shown in Figure 11.
The result in Figure 11 shows that the diodes which offer the best performance are the diode HSMS 2850 of Avago and the SMS 7630 diode of Skyworks. It should be noted that, of these two diodes, the HSMS 2850 diode is that which has its series resistance nearest to 50 Ω. Recall that this helps to significantly reduce the insertions loss (Equation (15)). Moreover, regarding sensitivity, this diode is capable of detecting signals up to −50 dBm [31] .
4.2. Simulated and Experimental Results
The selected diode HSMS 2850 is used in a Schenkel-type voltage doubler. The simulated and realized circuit in this work, as well as the values of the used components, are shown in Figure 12. A Sub Miniature version A (SMA) connector is used to connect the rectifier to the microwave source.
For the manufacture of the circuit, the substrate RO35B having the characteristics reported in Table 4 is used. The ADS software is used to design the circuit. The capacitor values are initially set at 4.7 nF; then the optimum load resistance is calculated for −10 dBm of input power. The obtained result is shown in Figure 13. The result shows that the designed circuit in such condi-

Figure 12. Simulated and manufactured rectifier circuit.
Table 4. Characteristics of the RO35B substrate.

Figure 13. Optimum load resistance of the circuit.
tions can recover a maximum power of −22.5 dBm, reached on an optimum load of 1.23 kΩ.
By setting the load resistance at 1.2 kΩ, a characterization of the manufactured circuit is shown in Figure 15. A photograph of the measurement environment is shown in Figure 14. In this Figure, a microwave source is used. The circuit under test and a digital voltmeter are also shown.
The used microwave source is the MG 3700A manufactured by Anritsu. It transmits signals up to 6 GHz. The delivered output power reaches a maximum of 13 dBm and a minimum of −140 dBm. The internal impedance of the source is 50 Ω. Figure 15 shows a good agreement between experimental and simulated results. More precisely, maximum conversion efficiency of 36% is achieved at 10 dBm input power in simulation case, while 30% is observed in experimental measurements. The voltage levels up to 2 V is reached.
5. Wireless Sensor Network Performance Based on the RF Recovered Energy
By setting  as the time duration of a round, the maximum harvested energy per round can be defined as:
 (19)
(19)
where  is defined by:

Figure 14. Setup environment.
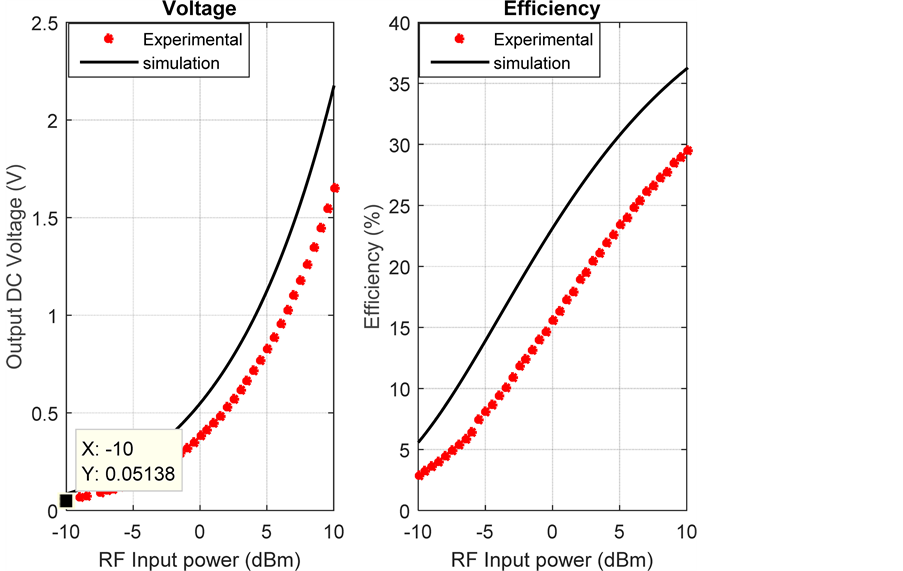
Figure 15. Rectifier measurement results.
 (20)
(20)
 is the time taken by an ON to measure and transmit data to the CH, and
  is the time required for each CH to receive, aggregate and transmits data to the BS.
 in Equation (19) is the maximum harvester power defined as :
 (21)
(21)
Assuming that the designed rectifier receives −10 dBm of input RF power, an output DC voltage of 51.4 mV is experimentally obtained (Figure 15). This level of voltage corresponds to a dissipated power of 2.2 μW. We then deduce the minimally required condition of operability of a sensor node based on the recovered energy as:
 (22)
(22)
With  defined by Equation (12). Considering the maximum recoverable power, the deployment of the WSN regarding the distance at which the base station can be located as well as the duration of a round is shown in Figures 16-18.
The results show that by increasing the duration of each round, the distance separating the base station from the WSN increases. More precisely:
・ for rounds with a duration of 1 s, (representing physical phenomena varying very rapidly), the accumulated energy is less than the required ener-

Figure 16. Performance of the WSN as a function of its distance from the BS . NE is the Needed Energy and AV the Available Energy.

Figure 17. Performance of the WSN as a function of its distance from the BS .
.
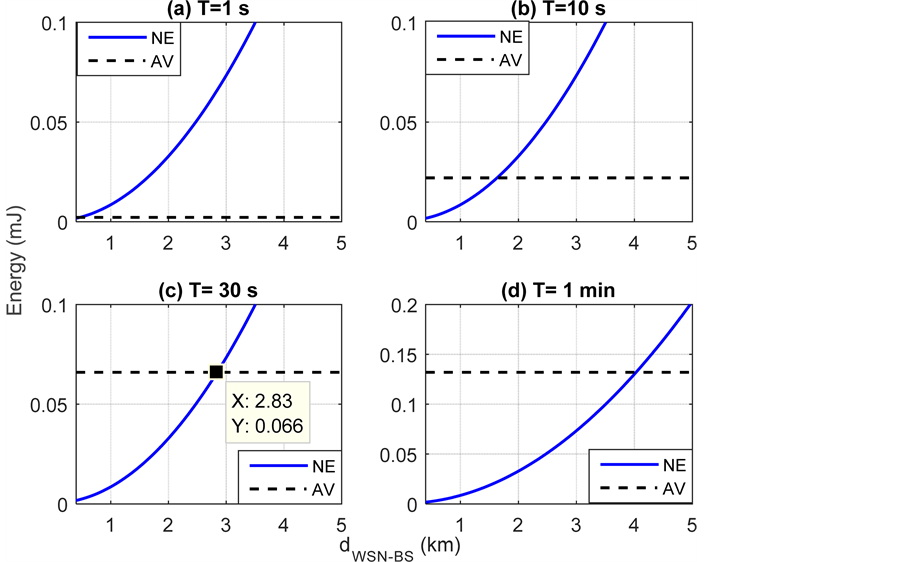
Figure 18. Performance of the WSN as a function of its distance from the BS .
.
gy even for a base station located only at 300 m from the WSN (Figure 16(a)). This configuration could be used to detect the presence of people in large buildings in the case of IoTs.
・ in the case of physical quantities to be taken every 10 s, the base station may be located at 2.4 km (Figure 16(b)) from the WSN to allow network nodes to operate,
・ if each round lasts 30 s (Figure 16(c)), the base station may be located beyond 4.17 km from the WSN location,
・ in many applications of WSN, the physical phenomena measured vary slowly; this is the case, for example of temperature variations due to thermal inertia, for which it is not necessary to take measure every second, but every minute. In this case, the BS may be located beyond 5 km (Figure 16(d)).
In Figure 17, a wider area with the same number of sensor nodes is considered; this has the effect of increasing the distance separating each ON from its CH. The energy demand of each node is increasing, and the result obtained validates this fact by showing that the BS should be located at a shorter distance than those achieved in Figure 16.
In Figure 18, it is observed that an increase in the number of nodes makes it possible to extend the range of the WSN. The distances to which the BS is to be located from the WSN are slightly larger than those obtained in Figure 17. However, it is obvious that a denser network is subject to interference between neighboring clusters. This limitation is not dealt with in this work.
6. Conclusion
In this paper, a new design of an Energy Harvesting-WSN based relied on the recovery of ambient electromagnetic energy has been proposed. First, an estimate of the energy budget of a sensor node in a LEACH protocol WSN is made. Then a miniature rectenna designed to achieve good performance in the GSM band is realized. The miniature consists of the use of a simple rectifier circuit for the shaping of ambient RF signals. From the various losses that occur during the RF/DC conversion, a comparison of the commonly used diodes is made and it is shown that the HSMS 2850 diode of Avago is the one which minimizes the losses occurring in the conversion chain. A characterization of the rectifier allows obtaining that at −10 dBm of input RF power, an output DC power of 2.2 μW is dissipated in the optimum load resistance of 1.2 kΩ. The recovered energy is then used to define the physical constraints to be imposed on a WSN (with an equitable distribution of charges) so that it can operate quasi indefinitely. The energy budget of a sensor node in a LEACH protocol WSN is compared to the energy recovered. The distance between the WSN and the BS is used as the enslavement parameter. It has been found that for rapidly changing phenomena, the BS should be located too close or inside the WSN. However, for rounds lasting one minute, the base station can be located beyond 3 km from the covered area by the WSN. This for a WSN with 100 nodes equitably spreads over an area of when each round last 1 min. Although the results obtained in this work are satisfactory, it would be interesting to evaluate the interferences due to the simultaneous communications of the nodes located in different clusters.
Cite this paper
Mouapi, A. and Hakem, N. (2017) Enslavement of Wireless Sensor Network to an RF Energy Harvesting System. Open Journal of Antennas and Propagation, 5, 63-82. https://doi.org/10.4236/ojapr.2017.52006
References
- 1. x Mouapi, A. (2015) Conception et réalisation d’une alimentation autonome pour un réseau de capteur sans fil appliqué dans les transports ferroviaires. Master Thesis, University of Québec in Abitibi-Témiscamingue, Val d’Or.
http://depositum.uqat.ca/id/eprint/639 - 2. Kottapalli, V.A., Kiremidjian, A.S., Lynch, J.P., Carryer, E.D., Kenny, T.W., Law, K.H. and Lei, Y. (2003) Two-Tiered Wireless Sensor Network Architecture for Structural Health Monitoring. Proceedings of SPIE, 5057.
https://doi.org/10.1117/12.482717 - 3. Visser, H.J. (2017) Miniature Rectenna Design. IEEE International Applied Computational Electromagnetics Society Symposium-Italy, Florence, 26-30 March 2017, 1-2.
https://doi.org/10.23919/ROPACES.2017.7916326 - 4. Atzori, L., Iera, A. and Morabito, G. (2010) The Internet of Things: A Survey. Computer Networks, 54, 2787-2805.
- 5. Ilic, D., Kilb, M., Holl, K., Praas, H.W. and Pytlik, E. (1999) Recent Progress in Rechargeable Nickel/Metal Hydride and Lithium-Ion Miniature Rechargeable Batteries. Journal of Power Sources, 80, 112-115.
- 6. Chalasani, S. and Conrad, J.M. (2008) A Survey of Energy Harvesting Sources for Embedded Systems. IEEE Southeastcon, Huntsville, AL, 3-6 April 2008, 442-447.
- 7. Tan, Y.K. and Panda, S.K. (2011) Optimized Wind Energy Harvesting System Using Resistance Emulator and Active Rectifier for Wireless Sensor Nodes. IEEE Transactions on Power Electronics, 26, 38-50.
https://doi.org/10.1109/TPEL.2010.2056700 - 8. Mouapi, A., Hakem, N., Kandil, N. and Kamani, G.V. (2016) Energy Harvesting Design for Autonomous Wireless Sensors Network Applied to Trains. IEEE International Ultrasonics Symposium, Tours, 18-21 September 2016, 1-4.
https://doi.org/10.1109/ULTSYM.2016.7728636 - 9. Mouapi, A., and Hakem, N. (2016) Performance Evaluation of Wireless Sensor Node Powered by RF Energy Harvesting. 16th IEEE Mediterranean Microwave Symposium (MMS), Abu Dhabi, 14-16 November 2016, 1-4.
https://doi.org/10.1109/MMS.2016.7803793 - 10. Oliveira, L.M. and Rodrigues, J.J. (2011) Wireless Sensor Networks: A Survey on Environmental Monitoring. Journal of Communications, 6, 143-151.
https://www.it.pt/Publications/PaperJournal/7658
https://doi.org/10.4304/jcm.6.2.143-151 - 11. Pinuela, M., Mitcheson, P.D. and Lucyszyn, S. (2013) Ambient RF Energy Harvesting in Urban and Semi-Urban Environments. IEEE Transactions on Microwave Theory and Techniques, 61, 2715-2726.
https://doi.org/10.1109/TMTT.2013.2262687 - 12. Malakar, K., Nandi, J., Mitra, S., Gorai, P.K., Chattopadhyay, S. and Banerjee, S. (2011) Rectangular Microstrip Antenna with Air Cavity for High Gain and Improved Front to Back Ratio. Journal of Electromagnetic Analysis and Applications, 3, 368-372.
https://doi.org/10.4236/jemaa.2011.39058 - 13. Kaur, M. and Sivia, J.S. (2016) On the Design of Plus Slotted Fractal Antenna Array. Open Journal of Antennas and Propagation, 4, 128-137.
https://doi.org/10.4236/ojapr.2016.43010 - 14. Slavova, A. and Omar, A.S. (2003) Wideband Rectenna for Energy Recycling. Antennas and Propagation Society International Symposium, 3, 954-957.
https://doi.org/10.1109/aps.2003.1220068 - 15. Mouapi, A., Hakem, N. and Delisle, G.Y. (2016) Autonomous Wireless Sensors Network Based on Piezoelectric Energy Harvesting. Open Journal of Antennas and Propagation, 4, 138-157.
https://doi.org/10.4236/ojapr.2016.43011 - 16. Singh, S.K., Kumar, P. and Singh, J.P. (2017) A Survey on Successors of LEACH Protocol. IEEE Access, 5, 4298-4328.
https://doi.org/10.1109/ACCESS.2017.2666082 - 17. Heinzelman, W.B., Chandrakasan, A.P. and Balakrishnan, H. (2002) An Application-Specific Protocol Architecture for Wireless Microsensor Networks. IEEE Transactions on Wireless Communications, 1, 660-670.
https://doi.org/10.1109/TWC.2002.804190 - 18. Heinzelman, W.R., Chandrakasan, A. and Balakrishnan, H. (2000) Energy-Efficient Communication Protocol for Wireless Microsensor Networks. Proceedings of the 33rd Annual Hawaii International Conference on System Sciences, 7 January 2000, 1-10.
https://doi.org/10.1109/hicss.2000.926982 - 19. Lazarou, G.Y., Li, J. and Picone, J. (2007) A Cluster-Based Power-Efficient MAC Scheme for Event-Driven Sensing Applications. Ad Hoc Networks, 5, 1017-1030.
- 20. Rappaport, T.S. (1996) Wireless Communications: Principles and Practice. 2nd Edition, Prentice Hall, Upper Saddle River.
- 21. Suh, Y.H. and Chang, K. (2002) A High-Efficiency Dual-Frequency Rectenna for 2.45- and 5.8-GHz Wireless Power Transmission. IEEE Transactions on Microwave Theory and Techniques, 50, 1784-1789.
https://doi.org/10.1109/TMTT.2002.800430 - 22. Takhedmit, H., Merabet, B., Cirio, L., Allard, B., Costa, F., Vollaire, C. and Picon, O. (2010) A 2.45-GHz Dual-Diode RF-to-DC Rectifier for Rectenna Applications. European Microwave Conference (EuMC), Paris, 28-30 September 2010, 37-40.
- 23. Merabet, B., Cirio, L., Takhedmit, H., Costa, F., Vollaire, C., Allard, B. and Picon, O. (2009) Low-Cost Converter for Harvesting of Microwave Electromagnetic Energy. IEEE Energy Conversion Congress and Exposition, San Jose, CA, 20-24 September 2009, 2592-2599.
https://doi.org/10.1109/ecce.2009.5316093 - 24. Meneses Ghiglino, C. (2010) Ultra-Wideband (UWB) Rectenna Design for Electromagnetic Energy Harvesting. Masters Theses, Dept. Teoria del Senyal i Comun, Escola Técnica Superior d’Enginyeria de Telecomun.
http://hdl.handle.net/2099.1/10835 - 25. McSpadden, J.O., Fan, L. and Chang, K. (1998) Design and Experiments of a High-Conversion-Efficiency 5.8-GHz Rectenna. IEEE Transactions on Microwave Theory and Techniques, 46, 2053-2060.
https://doi.org/10.1109/22.739282 - 26. Ghiglino, C.M. (2010) Ultra-Wideband (UWB) Rectenna Design for Electromagnetic Energy Harvesting. Unisitat Politecnica De Catalunya.
- 27. Hemour, S., Zhao, Y., Lorenz, C.H.P., Houssameddine, D., Gui, Y., Hu, C.M. and Wu, K. (2014) Towards Low-Power High-Efficiency RF and Microwave Energy Harvesting. IEEE Transactions on Microwave Theory and Techniques, 62, 965-976.
https://doi.org/10.1109/TMTT.2014.2305134 - 28. Niknejad, A.M. (2007) Electromagnetics for High-Speed Analog And Digital Communication Circuits. Cambridge University Press, Cambridge.
https://doi.org/10.1017/CBO9780511805738 - 29. Pozar, D.M. (2009) Microwave Engineering. John Wiley & Sons, Hoboken.
- 30. Li, X., Wen, H. and Hu, Y. (2016) Evaluation of Different Maximum Power Point Tracking (MPPT) Techniques Based on Practical Meteorological Data. 2016 IEEE International Conference on Renewable Energy Research and Applications, Birmingham, 20-23 November 2016, 696-701.
https://doi.org/10.1109/ICRERA.2016.7884423 - 31. http://www.alldatasheet.com/view.jsp?Searchword=HSMS-2850&sField=4
- 32. https://cdn.macom.com/datasheets/MA4Exxxx%20Series.pdf
- 33. http://pdf1.alldatasheet.com/datasheet-pdf/view/257770/AVAGO/HSMS-2820.html
- 34. http://www.skyworksinc.com/uploads/documents/SMS7630_061_201295H.pdf