Journal of Building Construction and Planning Research
Vol.03 No.03(2015), Article ID:59538,8 pages
10.4236/jbcpr.2015.33013
Quality Study of Rice Husk Ash (RHA) Brick Using Neutron Radiography Technique
Md. Khurshed Alam1*, Md. Moniruz Zaman2, Md. Al Amin3
1Scientific Information Division, Bangladesh Atomic Energy Commission, Dhaka, Bangladesh
2Institute of Glass and Ceramic Research and Testing (IGCRT), Bangladesh Council of Scientific and Industrial Research (BCSIR), Dhaka, Bangladesh
3Department of Physic, Jahangirnagar University, Dhaka, Bangladesh
Email: *alammk1964@yahoo.co.in
Copyright © 2015 by authors and Scientific Research Publishing Inc.
This work is licensed under the Creative Commons Attribution International License (CC BY).
http://creativecommons.org/licenses/by/4.0/


Received 6 August 2015; accepted 8 September 2015; published 11 September 2015
ABSTRACT
A powerful non-destructive testing (NDT) technique is adopted to study the quality of RHA brick-1 and RHA brick-2. In that case, rice husk ash has been utilized for the preparation of bricks in full replacement of clay. In these studies, homogeneity of elemental distribution, water absorption and size and shape of the pores have been observed. From the studies, it was observed that elemental distribution is very good at various level, large number of porosity is presented with little bit size, initial rate of absorption (IRA) due to first five minutes immersion of water is higher compared to other immersion time (>5 minute), incremental water intrusion area increases very slowly with the increasing immersion time and the water absorption for RHA brick-2 becomes saturated very early than that of the RHA brick-1.
Keywords:
Neutron Radiography, RHA, IRA and Water Absorption Behavior

1. Introduction
Rice husks are the hard protecting coverings of grains to protect rice at the ripening period. A large number of ashes is produced at the burning time which is used as a waste and pollute environment and it is also a great environment threat causing damage to land and stored/dumped area. On average 20% of the rice paddy is husk, giving an annual total production of 120 million tones [1] . Because of its low density, it is very difficult to transfer from one place to another place for cleaning residential area. Carbon which is produced due to burning of the hush, is one of the greatest threats to the environment. From this point of view, it is necessary to proper manage the rise husk as a socio economic use. The ash itself (87 - 97)% is silica [2] , highly porous and light weight, with a very high external surface area. Various factors which influence ash properties are incinerating conditions (temperature and duration), rate of heating, burning technique, crop variety and fertilizer used [3] . Apart from its use as a fuel in power plant, formation of produced carbon [4] , a source of silica and silicon compounds [5] [6] and also for internal decorative bricks (which is quite newly vision).
The neutron radiography method/technique is a simple process of exposing some objects to an X-ray, gamma-ray, neutron beam and some other types of radiation and then attenuated out going beam from the object is passing through a special type of photographic film to form images of the objects on the radiographic film or detector. This method is also used for different research purposes such as study of water absorption and internal defects in jute reinforced biopol composite [7] ; internal structure, internal defects in automated machine made environmentally friendly brick and conventionally made brick samples [8] -[10] , different ceramic samples [11] , different tiles [12] , different building materials [13] ; internal defects in electronic components [14] ; water uptake and internal defects of jute reinforced polymer composite [15] ; water absorption behavior in biopol and jute reinforced biopol composite [16] etc. It is a technique of making a picture of the internal details of the test object. Because of high penetrating power of neutron beam, neutron radiography technique is the best to measure any homogeneity, internal voids, cracks in the sample than the X-ray and gamma ray radiography. In this paper we have analysis the internal homogeneity, voids, cracks and water uptake behavior and uses of rice husk ash (RHA) brick, and also attempt has been made to collect data and information from various research work related to RHA using neutron radiography method.
2. Experimental Details
2.1. Sample Preparation
Rice husk ash is obtained by burning rice husk. Firstly rice husk ash is collected from the local rice production industry. After that rice husk ash and gum/one type of resin mixed together with optimum proportion of water. This mixer is inserted into water for a day to make solution. The next day to make sand-gum-husk ash-water solution a certain proportion of sand is mixed with this solution and stir homogeneously. Now, this solution stores into the same container for another one day. Now transfer and store this solution into respective mold and press by the weight of 10 ton. Now put out from the mold and dry another 28 days into normal ambient temperature or in an open air and obtained special type of rice husk ash (RHA) bricks. The elemental ratio of gum: water: husk ash: sand into the RHA brick is 1:3:9:110.
2.2. Loading Converter Foil and Film in to the NR-Cassette
A thin converter (gadolinium metal foil of 25 µm thickness) was placed at close contact with the emulsion surface of the X-ray industrial film. The loading of the X-ray industrial film (Agfa structurix D4DW) into the NR cassette (18 cm × 24 cm) is a simple procedure [17] which requires a darkroom.
2.3. Placing of Sample and the NR-Cassette in the Experimental Facility
The RHA brick is placed in close contact with the NR cassette (shown in Figure 1) on the sample holder table. The NR cassette is placed on the cassette holder table.
2.4. Determination of Exposure Time
Exposure means passing of neutron beam through a sample and holding it onto a special film (Structurix, D4DW industrial film) in order to create a latent internal image of an object in the emulsion layers of that film. Exposure time differs for different samples, depending on the intensity of the neutron beam, neutron cross-section, density and thickness of the sample. The optimum exposure time of the dry RHA brick was determined by taking a series of neutron radiographs with different exposure time, while the reactor was operated at constant power 2.4 MW. In the present experiment the optimum exposure time is found 08 minutes for each RHA bricks. The samples were then irradiated for that optimum exposure time to obtain good neutron radiographic images of each RHA bricks one by one.
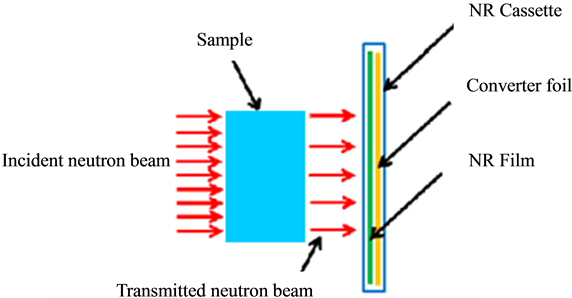
Figure 1. Diagram of showing neutron beam direction, placing of sample, NR film and converter foil inside the NR cassette.
2.5. Immersion Procedure of the RHA Brick Sample
The RHA brick is placed in a plastic pan and a constant 1.0 cm height of water level is maintained. The water level is observed very carefully and adds extra water to maintain water level during the immersion time. After 1, 3, 5 and 8 minutes immersion time the RHA brick sample taken off from the pan and extra water of outer surface of the RHA sample is removed by the tissue paper properly.
2.6. Obtained Radiographic Images
To obtain the neutron radiographic images of the dry and wet bricks the following procedures are completed.
1) Irradiation: After putting the RHA brick on the sample holder table the neutron beam was disclosed for 8 minutes by removing the wooden plug, lead plug and beam stopper from the front side of the beam collimator.
2) Developing: Developing is an image processing technique by which the latent image is converted into a metallic silver image [18] . Developing process is completed at 20˚C - 22˚C solution temperature for 7 minutes.
3) Fixing: The fixation solution will dissolve the unexposed silver-halide crystals leaving only the silver grains in the gelatin of the exposed film. The fixing is completed within a 5 minutes and control the fixture temperature at 20˚C - 22˚C.
4) Washing: Between the process of developing and fixing this radiographic film is washed for 1 minute at flowing tap water.
5) Final washing: The silver compound was formed during the fixing stage must be removed, since they can affect the silver image at the latter stage. For this reason the exposed film must be washed thoroughly in flowing tap water for 15 minutes after completion of fixing process of the exposed film. In that case water temperature is maintained at 20˚C - 22˚C also.
6) Drying: After final washing, the imaging films were dried by clipping in a hanger at fresh air/or in a drying cabinet to obtain final radiographic images of the dry and wet RHA bricks.
3. Mathematical Formulation
The neutron radiographic image represents the attenuating behavior of thermal neutron beam due to dry and wet RHA bricks. Attenuation of thermal neutron beam is mainly due to scattering and absorption interactions of neutrons with atomic nuclei. This attenuating response for dry RHA bricks can be written [19] as:
 (1)
(1)
Here I and
 are the attenuated and incident neutron intensities (n/cm2/sec) respectively,
 is the neutron attenuation coefficient (cm−1) of the dry RHA bricks and ts is the corresponding thickness (cm).
In case of wet RHA bricks the above equation can be written as follows:
 (2)
(2)
where
 is the attenuated neutron intensity of wet RHA brick,
 is the neutron attenuation coefficient of water and
 is the thickness of the water absorbed by the RHA bricks.
From Equation (1) and Equation (2) the thickness of the absorbed water by the bricks can be calculated as follows:
 (3)
(3)
The gray value/neutron intensity of the radiographic images of the sample is changed with the increase of water absorbed by the samples. The attenuated neutrons beam enters the detector that resists the fraction of initial radiation intensity that has been transmitted by each point of the object and is then recorded by the radiographic film i.e. image detector.
The neutron intensity before reaching the RHA brick sample (object) is different from the intensity of the neutron after passing through the samples. The relationship between these two intensities is expressed through Equation (1). On the other side of the film, a light sensor (photocell) converts the penetrated light into an electrical signal. Actually, optical density is the darkness or opaqueness of a transparency film and is produced by film exposure and chemical processing. An image contains areas with different densities that are viewed as various shades of gray.
4. Gray Value
The visual appearance of an image is generally characterized by two properties such as brightness and contrast. Brightness refers to the overall intensity level and is therefore influenced by the individual gray-level (intensity) values of all the pixels within an image. Since a bright image (or sub image) has more pixel gray-level values closer to the higher end of the intensity scale, it is likely to have a higher average intensity value. Contrast in an image is indicated by the ability of the observer to distinguish separate neighboring parts within an image. This ability to see small details around an individual pixel and larger variations within a neighborhood is provided by the spatial intensity variations of adjacent pixels, between two neighboring sub images or within the entire image. Thus, an image may be bright (due to, for example, overexposure or too much illumination) with poor contrast if the individual target objects in the image have optical characteristics similar to the background. At the other end of the scale, a dark image may have high contrast if the background is significantly different from the individual objects within the image, or if separate areas within the image have very different reflectance properties.
An image that contains pixels with brightness values spread over the entire intensity scale is likely to have better contrast than the image with pixel gray-level values located within a narrow range. The relationship between the intensity spread at the pixel level and the overall appearance of an image provides the basis for image enhancement by gray-level transformation. The terms gray value and intensity are used synonymously to describe pixel brightness.
5. Image Detector
Silver chloride, bromide and iodide are collectively known as silver halides. These are used in various proportions in the radiographic film emulsions. In the manufacture of the radiographic emulsion the silver halide is formed as a dispersion of extremely small particles (microcrystal) in gelatin. When coated on a glass or film base and allowed to dry, this becomes a thin, tough, transparent layer which is very sensitive to short wavelengths of light. During the neutron exposure time electron is allowed to fall on the emulsion surface and its energy is absorbed by silver halide particles, causing local disruptions of some bonds that hold the crystalline structure together and release free silver atoms within the body of the crystal. Above a certain critical energy enough silver atoms are released to form a metallic silver or latent image. The developer is used to turn the latent image into a visible photographic image in metallic silver. This solution containing a reducing agent is capable of reducing silver halide to silver, but only in the case of those crystals which bear a latent image. The silver halide emulsion radiographic film is used as an image detector.
6. Results and Discussion
6.1. Porosity/Voids and Homogeneity Measurement
The quality of a HRA brick samples depends on the proper distribution of the contents, porosity, water absorption behavior etc. in the sample. The porosity, elemental distribution of the samples has been studied by measuring gray value/intensity ratio from the neutron radiographic images of each sample. Figure 2 and Figure 3 show the intensity variation with corresponding pixel distance at different levels (L1 to L6) of the HRA brick 1 and HRA brick 2, respectively. Variation of intensity ratio of the radiographic images indicates the elemental distribution of the contents and the porosity of the sample. This shows that elements are distributed homogeneously at every level compare to one another but each level shows slightly variation of intensity. In case of sample 2 it shows more regular than that of brick-1.
The gray value has been obtained by drawing line profile of 465 × 5 pixel area on the radiographic images of an object. Because of poor irregularity of intensity ratio of each level, little porosity is found in both the case inside the sample.
6.2. Water Penetrating Height and Behavior Measurement at Different Immersion Time
Water penetrating/rising behavior of the RHA brick-1 at different immersion time such as 1, 3, 5, 8 minutes is shown in Figure 4. From this figure it is observed that at 5 to 8 minutes immersion water rises in upward direction almost equally through the all space but at 1 minutes immersion this behavior is slightly different which shows wavy shape. On the other hand in case of RHA brick-2 for 1 minute immersion it shows capillary shape and rests of other immersion time it shows straight line shape, which is shown in Figure 5. The height of water absorption for RHA brick-1 at immersion time 1, 3, 5 and 8 minute is 1.8 - 2.5 cm, 3.2 - 3.4 cm, 3.6 - 3.8 cm (Figure 4) and 4.5 - 4.7 cm, respectively. At the same immersion time for the RHA brick-2 it looks slightly different (Figure 5). From the above investigation it shows that at first 1 minute immersion the water absorption through the RHA brick-1 and brick-2 is very higher than that of 3, 5 and 8 minutes immersion time. From this observation it is pointed out that water penetrating/rising due to 1 and 3 minutes immersion for RHA brick-1 is very poorer than that of the RHA brick-2.
6.3. Determination of Initial Rate of Absorption (IRA)
The absorption rate that water is absorbed by a porous solid is defined as IRA. It is related to the durability, porosity, pore size distribution and water absorption. It is sometimes called rising damp. The quantity, sizes and

Figure 2. Homogeneity curve of RHA brick-1 at different levels.

Figure 3. Homogeneity curve of RHA brick-2 at different levels.

Figure 4. Water absorption/penetration at different immersion time (RHA brick-1).

Figure 5. Water absorption/penetration at different immersion time (RHA brick-2).

Figure 6. Water absorption/penetration at different immersion time (RHA brick-1 and brick-2).
connection of pores influence the absorption rate of the brick. The IRA is reported in units of gm/(30in2min) [20] . In the present case IRA is measured in units of (gm/cm3min). The results of IRA measurement for RHA brick samples are shown in Figure 6. Initially the rate of water absorption is very fast (1 to 3 minutes immersion) and very similar after this stage (up to 25 minutes water absorption and so on). This investigation is also shows that the water absorption for RHA brick-2 becomes saturated very early than that of the RHA brick-1.
6.4. Observation of Incremental Water Intrusion Area
The incremental intrusion area means the unexpected water absorbed area during immersion period of any respective sample. Figures 7(a)-(d) and Figures 8(a)-(d) show the neutron radiographic images for 1 min., 3 min., 5 min. and 8 min. immersion into water of the RHA brick-1 and RHA brick-2, respectively. The blue straight line is the separator of immersion area and the incremental water immersion area. The lower portion (1 cm × 5 cm)) indicates the immersed area and the upper portion indicates the incremental water intrusion area. Figure 7 and Figure 8 show that growing of incremental intrusion area with immersion time varies very slowly. In that case the water rising due to first 1 min is very faster than that of the next 5 - 8 minutes in both the cases. The relation of incremental intrusion area of the RHA bricks at different immersion time is directly related to the IRA (Figure 6).
(a) (b)
(c) (d)
Figure 7. NR images of wet RHA brick-1 at different immersion time. (a) Tw= 1 min; (b) Tw = 5 min; (c) Tw =3 min; (d) Tw = 8 min.
(a) (b)
(c) (d)
Figure 8. NR images of RHA brick-2 at different immersion time. (a) Tw =1 min; (b) Tw = 5 min; (c) Tw = 3 min; (d) Tw = 8 min.
A typical analysis [21] of rice husk is as ash (22 - 29)%, carbon ≈ 35%, hydrogen (4 - 5)%, oxygen (31 - 37)%, Nitrogen (0.23 - 0.32)%, sulphur (0.04 - 0.08)%. The content of each of them depends on rice variety, soil chemistry, climatic conditions, and even the geographic localization of the culture.
The increasing need for stronger and durable building materials has been to some extent fulfilled by a new concept i.e., blended cement. Blending of reactive rice husk ash in cement has become a common recommendation almost in all the international building codes. Extensive research has been carried out on application of RHA as mineral additive to improve performance of concrete. Reports indicated RHA as a highly reactive pozzolan [22] and is mainly used a replacement of silica fume or as an admixture in manufacturing of low cost concrete block [23] [24] . Other uses of RH are in control of insect pests in stored food stuffs, in the water purification, in vulcanizing rubber, as flue gas desulphurization absorbents. RHA has been found to be effective as an oil spill absorbent, and for use in waterproofing chemicals, flame retardants, and as a carrier for pesticides and insecticides. Its absorbent and insulating properties are useful to many industrial applications. Despite having high potential and suitability in so many well established uses, use of rice husk has been limited. In the competitive market, proper utilization of rice husk and its ash will benefit industrial sectors. The use of rice husk as fuel/electricity generation in efficient manner is likely to transform this agricultural waste material in to a valuable fuel for industrial sectors. A systematic approach to this material can give birth to a new industrial sector of rice husk [23] . It is non-polluting manufacturing process, does not exude gases such as SOx, NOx, etc. The use of fly ash and other industrial wastes for making bricks is ecologically advantageous since apart from saving precious top agriculture soil, it meets the social objective of disposing Industrial wastes otherwise are pollutants and nuisance. There are various advantages [25] of RHA bricks in building construction such it can be of good quality with sharp edges, controlled dimensions and offer a plain and even finish. They are resistant to wear and tear which makes them suitable for the internal and external uses. Plastering over brick can be avoided thus achieving further economy; the bonding with mortar and plaster is much greater or better in the case of RHA bricks; this type of bricks can be made in different sizes or shapes, so these can be used in building construction; bulk utilization of RHA helps in solving the pollution problem; these are very easy to produce as they manufacturing, process is simple and machinery required is easily available.
7. Conclusion
RHA brick is very useful brick as a good interior materials of building construction because of its light weight as compare to any other conventional brick, it is easily collected from the rice producing industries with very low price in rice producing countries, elemental distribution is very good at various level, large number of porosity is present with little bit size, and incremental water intrusion area increases very slowly with the increasing immersion time. The information of this study will also be helpful to further study of this type of brick. On the other hand, the NDT technique is the only method to measure the internal voids, cracks, homogeneity and water penetrating through the RHA brick.
Cite this paper
Md. KhurshedAlam,Md. MoniruzZaman,Md. AlAmin, (2015) Quality Study of Rice Husk Ash (RHA) Brick Using Neutron Radiography Technique. Journal of Building Construction and Planning Research,03,127-135. doi: 10.4236/jbcpr.2015.33013
References
- 1. Giddel, M.R. and Jivan, A.P. (2007) Waste to Wealth, Potential of Rice Husk in India a Literature Review. International Conference on Cleaner Technologies and Environmental Management PEC, Pondicherry, January 4-6 2007, 586-590.
- 2. Rozainee, M., Ngo, S.P. and Salema, A.A. (2008) Effect of Fluidising Velocity on the Combustion of Rice Husk in a Bench-Scale Fluidised Bed Combustor for the Production of Amorphous Rice Husk Ash. Bioresource Technology, 99, 703-713. http://dx.doi.org/10.1016/j.biortech.2007.01.049
- 3. Mansaray, K.G. and Ghaly, A.E. (1999) Thermal Degradation of Rice Husks in an Oxygen Atmosphere, Energy Sources, Part A: Recovery. Utilization and Environmental Effects, 21, 453-466.
- 4. Granados, C.D. and Venturini, R. (2008) Assureira Estela, Rice Husk—An Alternative Fuel in Peru Universtaria Cuadra, 18 Lima 32 Peru. Activated Carbons Obtained from Rice Husk: Influence of Leaching on Textural Parameters. Industrial & Engineering Chemistry Research, 47, 4754-4757. http://dx.doi.org/10.1021/ie071657x
- 5. Matori, K.A. and Haslinawati, M.M. (2009) Producing Amorphous White Silica from Rice Husk. Masaum Journal of Basic and Applied Sciences, 1, 512.
- 6. Adylov, G.T., Faiziev, S.A. and Paizullakhanov, M.S. (2003) Silicon Carbide Materials Obtained from Rice Husk. Technical Physics Letters, 29, 221-223. http://dx.doi.org/10.1134/1.1565639
- 7. Alam, M.K. and Khan, M.A. (2006) Study of Water Absorption and Internal Defects in Jute Reinforced Biopol Composite Using Digital Neutron Radiography Technique. Journal of Bangladesh Academy of Sciences, 30, 29.
- 8. Alam, M.K., Islam, M.R., Saha, S., Islam, M.N. and Islam, S.M.A. (2013) Quality Study of Automated Machine Made Environmentally Friendly Brick (KAB) Sample Using Film Neutron Radiography Technique. Journal of Building Construction and Planning Research, 1, 141-152. http://dx.doi.org/10.4236/jbcpr.2013.14015
- 9. Alam, M.K., Islam, M.R., Saha, S., Islam, M.N. and Islam, S.M.A. (2013) Quality Study of Hand Made Brick-DK Using Neutron Radiography Technique. Bangladesh Journal of the Scientific and Industrial Research, 48, 237-246.
- 10. Alam, M.K., Islam, M.R., Saha, S., Islam, M.N. and Islam, S.M.A. (2014) Internal Defects and Water Absorption Behavior of Environmentally Friendly Brick-MAB Using Film Neutron Radiography Technique. Journal of Bangladesh Academy of Sciences, 38, 1-6. http://dx.doi.org/10.3329/jbas.v38i1.20197
- 11. Alam, M.K. (2005) Comparative Study of Internal Defects in Ceramic Products Using CCD-Camera Based Digital Neutron Radiography Detector. Bangladesh Journal of Scientific and Industrial Research, 40, 169.
- 12. Alam, M.K., Islam, M.N. and Zaman, M.A. (2000) Study of Internal Defects and Water Absorption Behavior of Single Layer Italian Tiles Using Neutron Radiography Facility of 3 MW TRIGA MARK II Research Reactor. Journal of Bangladesh Academy of Sciences, 31, 213-222.
- 13. Islam, M.N., Alam, M.K., Zaman, M.A., Ahsan, M.H. and Molla, N.I. (2000) Application of Neutron Radiography to Building Industries. Indian Journal of Pure and Applied Physics, 38, 348-354.
- 14. Mia, S., Rahman, M.H., Saha, S., Khan, M.A.T., Islam, M.A., Islam, M.N., Alam, M.K. and Ahsan, M.H. (2013) Study of the Internal Structure of Electronic Components RAM DDR-2 and Motherboard of Nokia-3120 by Using Neutron Radiography Technique. International Journal of Modern Engineering Research (IJMER), 3, 3429-3432.
- 15. Alam, M.K., Khan, M.A., Lehmann, E.H. and Vontobel, P. (2007) Study of Water Uptake and Internal Defects of Jute Reinforced Polymer Composites Using Digital Neutron Radiography Technique. Journal of Applied Polymer Science, 105, 1958-1963. http://dx.doi.org/10.1002/app.26358
- 16. Alam, M.K., Khan, M.A. and Lehmann, E.H. (2006) Comparative Study of Water Absorption Behavior in Biopol®; and Jute-Reinforced Biopol®; Composite Using Neutron Radiography Technique. Journal of Reinforced Plastics and Composites, 25, 1179-1187. http://dx.doi.org/10.1177/0731684406066365
- 17. Bouma, A.H. (1969) Methods for the Study of Sedimentary Structures. John Wiley and Sons, New York, 140.
- 18. Bjelkhagen, H.I. (1993) Silver-Halide Recording Materials. Springer Verlag, Berlin, 128-151. http://dx.doi.org/10.1007/978-3-540-47593-4
- 19. Norris, P.M., Brenizer, J.S., Paine, D.A. and Bostain, D.A. (1996) Measurements of Water Deposition in Aerogel by Neutron Radiography. Proceedings of the 5th World Conference on Neutron Radiography, Berlin, 17-20 June 1996, 602.
- 20. Sanders, J. and Frederic, J. (2011) Capillary—A New Way to Report IRA (Initial Rate of Absorption). Proceedings of the Structural Clay Products Division Meeting, Gettysburg, 2-4 May 2011, 1-24.
- 21. Muntohar, A.S. (2002) Utilization of Uncontrolled Burnt Rice Husk Ash in Soil Improvement. Dimensi Teknik Sipil, 4, 100-105.
- 22. Faiziev, S. (2003) Synthesis of Ceramic Compounds Utilizing Woody Waste Materials and Rice Husk Construction and Building Materials Science Forum. International Journal of Emerging Technology and Advanced Engineering, 437-438, 411-414. www.ijetae.com
- 23. Kumar, A., Mohanta, K., Kumar, D. and Parkash, O. (2012) Properties and Industrial Applications of Rice Husk. International Journal of Emerging Technology and Advanced Engineering, 2, 86. www.ijetae.com
- 24. Siriwandena, S., Ismail, H. and Ishakiaku, U.S. (2001) A Comparison of White Rice Hushes Ash and Silica as Filler in Ethylene-Propylene-Diene Terpolymer Vulcanizates. Polymer International, 50, 707-713. http://dx.doi.org/10.1002/pi.691
- 25. Mohan, N.V.P., Satyanarayana, V.V. and Rao, K.S. (2012) Performance of Rice Husk Ash Bricks. International Journal of Engineering Research and Application (IJERA), 2, 1906-1910. www.ijera.com
NOTES

*Corresponding author.