Journal of Building Construction and Planning Research
Vol.2 No.1(2014), Article ID:43860,18 pages DOI:10.4236/jbcpr.2014.21002
Evaluation of Thermal Effect of PCM Wallboards by Coupling Simplified Phase Change Model with Design Tool
Alain Guiavarch1, Denis Bruneau2, Bruno Peuportier1*
1Centre Energétique et Procédés, MINES Paris Tech, Paris, France
2Département TREFLE, Institut de Mécanique et d’Ingénierie de Bordeaux, Talence, France
Email: *bruno.peuportier@mines-paristech.fr
Copyright © 2014 by authors and Scientific Research Publishing Inc.
This work is licensed under the Creative Commons Attribution International License (CC BY).
http://creativecommons.org/licenses/by/4.0/


Received 12 December 2013; revised 22 January 2014; accepted 19 February 2014
ABSTRACT
A simplified PCM wallboard model is coupled to an existing design-oriented model of multi-zone buildings. Using a reference model and a basic simulation configuration, the accuracy of the resulting PCM wallboard-building thermal design tool is evaluated. A new performance indicator, called PCM utilization factor, is then proposed in order to estimate the thermal efficiency of using PCM wallboards in buildings. Using this PCM Utilization factor and a degrees-hours indicator, the ability of the PCM wallboard-building thermal design tool to evaluate the effect of PCM wallboards on heating loads and summer thermal comfort in the early design phase of a project is examined in two real case studies: a family house project and an existing office building. The user-friendliness of this design tool, and the short calculation times it leads to when performing a year-long simulation using a standard office computer, make it a well-adapted tool for sensibility studies or multi-criterion optimization for buildings that contain PCM wallboards.
Keywords:Phase Change Material; Wallboard; Thermal Model; Dynamic Simulation; Summer Comfort; Design Tools

1. Introduction
Phase Change Materials (PCM) have been widely studied in building applications [1] . They are able to influence the thermal comfort and the energy performance of buildings [2] -[4] . They lead to alternative and passive ways to store energy in buildings: a PCM material captures or releases heat (more specifically latent heat) when it undergoes a phase change from solid to liquid, liquid to gas or vice versa. The phase change occurs at a constant temperature (or over a limited range of temperature values), which is the temperature that corresponds to the phase transition temperature of the material. This latent heat storage is attractive since it provides a high energy storage density. Any material can potentially achieve a change phase. Concerning the industrial applications, one can distinguish inorganic PCMs (salthydrates for instance) and organic (parafines for instance). The order of magnitude of the melting latent heat of parafines is about 200 kJ/kg.
Many authors have studied the thermal effect of PCM in specific systems, for instance PCM integrated in a storage tank [5] , PCM integrated in ventilation systems [6] or in active walls [7] . This paper focuses on PCM wallboards used as internal building finishes. Such kinds of industrial products have recently been developed, but it is likely that they will be widely used in the near future [8] . This use of PCM has already been adopted by several architects as a promising solution to balancing the lack of thermal inertia in lightweight constructions. Professionals (architects and engineers) therefore need appropriate tools to evaluate the actual benefits of this material, especially in the early design phase of projects.
The integration of PCM wallboards into simulation tools has mainly been carried out in two kinds of building thermal model. Several studies deal with thermal models solved by the finite difference method [9] -[11] . However, as explained by Ibanez et al. [12] or Schranzhofer et al. [13] , it is also possible to couple a PCM model with a thermal model based on the transfer functions method.
As noted by Dutil et al. [14] , the enthalpy method and the heat capacity method are the two main approaches when modelling heat transfers with phase change. The enthalpy method has been used by Dauvergne [15] and Dauvergne and Palomo Del Barrio [16] to model plasterboards with micro-encapsulated PCM. Some authors have used the effective heat capacity method, assuming that this heat capacity is temperature dependent: Borreguero et al. [17] fitted the heat capacity model according to the experiment, and Chen et al. [18] or Ahmad et al. [19] chose a rectangular function. In the case of research by Athienitis et al. [20] , the approach is different again: the heat flux due to phase change is modelled by a triangular function, and is injected as a source term in the heat balance equation.
The aforementioned studies concentrated for the most part on the accuracy of the calculations, but did not necessarily target the application to the real needs of architects and engineers. For instance, whether or not PCM wallboards are suitable to ensure a satisfying level of comfort in summer is a question that has to be considered at the early design phase, because the answer can strongly influence the design of the building. Indeed, professionals need simulation tools which are accurate, but quick and easy to use, and able to help them during the whole building design process, especially in the early phase.
This paper proposes a consistent response to this professional requirement. The basic principle consists in coupling a straightforward model of PCM wallboards with an existing thermal model of buildings (implemented in professional software) reduced by modal analysis, the aim being to ensure both fairly good accuracy and short computation times. First, both models are described, then the coupling methodology is explained. The simulation tool is then applied to two real case studies to illustrate the ability of the methodology and the resulting coupled models simulation tool to evaluate easily the performance of PCM wallboards: a project for a timber frame family house, and an existing lightweight office building.
2. Modelling
Adding the possibility of taking PCM wallboards into account in thermal simulation tools for buildings requires a specific methodological and numerical treatment. One of the main reasons is that integrating the phase change phenomenon into the heat balance equation necessarily leads to a non-linear differential equation. It is generally assumed that heat conduction occurs in materials with isotropic, homogeneous and constant properties. With the phase change phenomenon, the last assumption must be revised as the thermo-physical properties of the PCM are temperature-dependent.
This section describes the existing building thermal design tools used in this paper (COMFIE), then the PCM wallboards model adopted, and finally the coupling of these two models to obtain a PCM wallboard-building thermal design tool.
2.1. Building Thermal Model and Calculation Algorithm
This section gives a brief description of the model and the whole calculation algorithm which has been developed and applied in the thermal simulation tool for multi-zone buildings. This simulation tool is called COMFIE and is linked to the Pleiades professional interface, widely used in France by architects and engineers, which gives fast and accurate results on heating and cooling loads and thermal comfort [21] . It focuses on the preliminary design of buildings, and uses a standard (or user-defined) library containing different physical objects (e.g. materials, walls or windows).
In this model, a wall is made of different material layers, with constant and homogeneous physical properties (e.g. conductivity or heat capacity). Surface heat transfer coefficients (convection and long wave radiation) are also assumed to be time independent. Convection heat transfer coefficients depend on the inclination of the wall and, for external surfaces, a mean building wind exposure. Long wave radiation heat transfer coefficients depend on surface emissivity.
This model is a finite volume model. It is especially useful for building designers, who have to perform simulations within a short computation time. For this reason, heat transfer in walls is assumed to be one-dimensional. The building is decomposed into small volumes, or “nodes”, assumed to be at a uniform temperature. Actually, the smaller the nodes are, the more realistic is this assumption of uniform temperature. Nevertheless, a limited number of nodes are imposed. The chosen compromise consists in placing this limited number of nodes so that temperature uniformity is maximal in each one. This strategy leads to a simulation tool which is able to perform year-long simulations within a computation time of between 10 s and few minutes, depending on the number of thermal zones and the CPU [21] .
For example, Figure 1 illustrates the discretization procedure on a wall composed of an 11.5 cm concrete wall and a 1.5 cm plasterboard placed on its internal surface. The wall is divided into n nodes, whose thicknesses follow a geometrical sequence with a common ratio r. The internal layer (finite volume) is the thinnest because this side of the wall has more influence on the indoor temperature than the external side of the wall.
The discretization method creates thermal building models with varying degrees of accuracy, depending on the values of n and r. Several values of n and r have been tested, for various types of walls and simple building configurations. Simulation results, performed on real case studies of buildings with simple geometries, showed that three nodes are sufficient to obtain discrepancies of less than 0.1˚C on zone temperatures, when compared to results obtained with twenty nodes reference simulations; furthermore, the effect of the r value on these discrepancies was very small (less than 10% of the aforementioned discrepancy). Thus three was finally chosen as a default value for both n and r.
Because the numbers and positions of nodes in a wall is a consequence of the n and r values, (see Figure 1, where n = 3 and r = 3), the model layers (bounded by dotted lines in Figure 1) do not necessarily match the material layers. As a result, the thermo-physical properties of the materials that constitute a layer are combined

Figure 1. Example of the spatial discretization of a multi-layer wall (composed of an 11.5 cm concrete wall and a 1.5 cm plasterboard placed on its internal surface). Number of nodes: n = 3; common ratio of the geometrical sequence of the node thicknesses: r = 3.
(thermal masses and thermal resistances are added together). This discretization methodology is applicable to all types of wall. The complete methodology is described by Peuportier [21] .
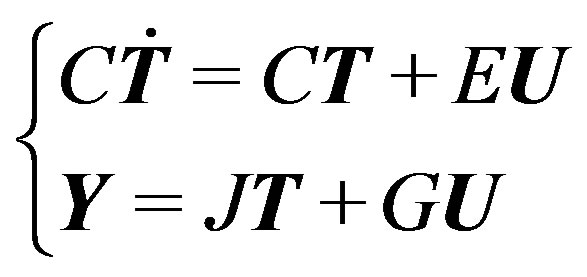
An energy balance is written for each node. The building is divided into thermal zones, and for each zone a matrix equation system is built:
 (1)
(1)
in which T is the discrete temperature field vector, U is a vector made of the driving forces (external temperature, solar irradiation, internal heat source), Y is the output vector, C is the diagonal matrix of the capacities of the discrete elements of the node grid, A is the matrix containing all exchange terms between the nodes, E is the matrix containing the exchange terms between the nodes and the driving forces, J is the matrix relating the outputs to the nodes , and G is the matrix relating the outputs to the driving forces. A particular output within the vector Y is the zone temperature Tz of a given thermal zone, which is an equivalent temperature taking into account the air temperature and the surface temperature of the different walls [21] .
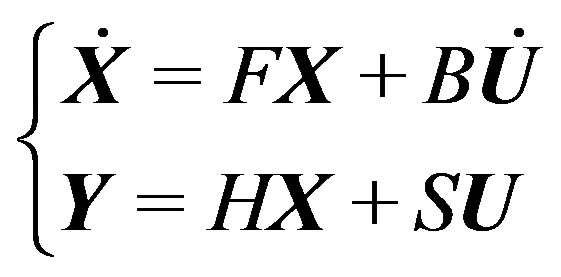
The temperature vector T is divided into a steady and a dynamic term, and a diagonalization step transforms the system into the equivalent in the eigenbase, composed of the eigenvectors:
 (2)
(2)
in which X is the modal state vector, F is the diagonal matrix of the eigenvalues of the system.
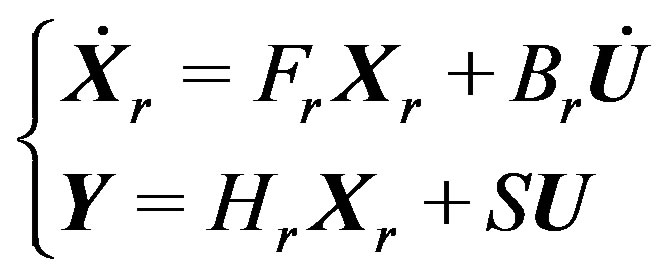
A reduction step selects the preponderant eigenvectors: only the largest time constants are considered, and multiple eigenvalues are eliminated (this happens if a zone has several identical walls). Only a few eigenvectors are kept, and therefore the order of the model is reduced.
The modal models of the different zones are combined, in order to build the global reduced matrix system of the multi-zone building:
 (3)
(3)
The simulation algorithm includes a controller which calculates the heating power in each zone, according to the temporal scenario concerning the set point temperatures. The time step is typically half an hour, with the possibility of reducing it to a few minutes.
The complete modelling and simulation procedure is described by Peuportier [21] . The reliability of the model and of the resulting simulation tool has been demonstrated in several validation procedures [22] [23] .
The aim of this work is to integrate a PCM wallboard model into the existing building thermal design tool described briefly in this section. As pointed out above, in order to ensure short computation times, this building thermal design tool considers restrictive assumptions, for example constant and homogeneous values for thermo-physical properties. For this reason, the PCM wallboard model proposed in the next sub-section has been developed to be associated with this existing building thermal design tool, but without producing any major modifications in this software solver. Thus, an enthalpy method has been chosen and the PCM phase change thermal effect is described as an external heat source term for the heat balance equations that takes place in the building thermal design tool.
2.2. PCM Wallboard Model
In this sub-section, a simple expression of the PCM wallboard enthalpy is proposed, assuming the usual restrictions retained in the literature: one-dimensional heat transfer, isotropic and homogeneous material properties and negligible natural convection of the PCM liquid phase [11] [12] , identical thermo-physical properties for PCM liquid and solid phases [9] [20] , no consideration of a possible hysteresis and sub-cooling phenomena for the PCM [10] [17] [18] . Note that the last assumption is in accordance with the level of precision of the usual PCM wallboard manufacturers’ commercial data, as used by architects and engineers.
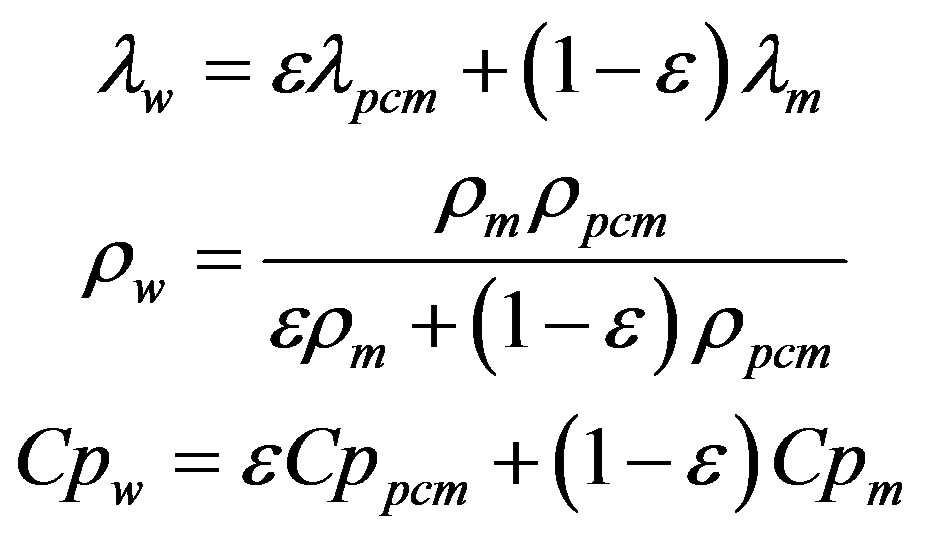
The PCM is associated with a structuring material to enhance its mechanical properties (e.g. plaster). The resulting product is considered to be a homogeneous medium, namely the PCM wallboard, whose thermal conductivity, mass density and heat capacity can be written as follows:
 (4)
(4)
where e is the ratio between the mass of PCM and the total mass of the PCM wallboard. In the previous equation, the subscripts “m”, “pcm”, and “w” refer respectively to “structuring material”, “Phase Change Material (PCM)” and “PCM wallboard”.
The main characteristics of the PCM are its latent heat of fusion L, and its enthalpy variation on its melting temperature range (PCM temperature range over which the phase change occurs); this range may reduce to a single temperature if the PCM is pure or eutectic. These characteristics are commonly obtained by using a DSC (Differential Scanning Calorimeter). Given these experimental data, the PCM wallboard mass enthalpy is then written as follows:
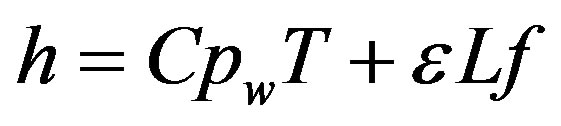 (5)
(5)
where f is the mass fraction of the melted PCM over the total PCM mass. As already mentioned above, for impure materials, the phase change takes place over a given temperature range; the melted PCM mass fraction versus PCM temperature curves usually have the same shape as the one shown in Figure 2. As suggested by Ahmad et al. [19] , for instance, these curves can be approximated by a linear function (Figure 2) and expressed as follows:
 (6)
(6)
where Tlow and Tup are the limit temperatures of the PCM phase change temperature range.
2.3. Coupling the PCM Wallboard Model and the Building Thermal Model
A simple and efficient coupling methodology is used to integrate a non-linearity (the PCM wallboard enthalpy model described above) into the existing thermal simulation tool (the building thermal model described above) without modifying its intrinsic calculation algorithm. The thermal effect of the PCM wallboard enthalpy modification (due to the PCM phase change) is considered as an external heat source term in the heat balance equation. This integration strategy, using a heat source term, has already been considered by Athienitis et al. [20] . Note that a method based on the enthalpy formulation is well adapted to this context, compared to the variable

Figure 2. Mass fraction of melted PCM (paraffin) versus temperature (experimental data: square dots; linear approximation: solid line).
heat capacity formulation. In the present paper, the modelling originality lies in the fact that this heat source term is not calculated by the building thermal model, but is calculated independently and then injected into the building thermal model.
As pointed out earlier, the building thermal model is one-dimensional. Thus, the heat balance equation in a wall is written as follows:
 (7)
(7)
where Δ is the Laplace operator and H is the enthalpy of the wall. If this wall is made of PCM wallboards, the enthalpy expression is that proposed in Equations (5) and (6). In this case, the heat balance is:
 (8)
(8)
where q , the rate of energy generation per unit volume, expresses the heat stored or released due to PCM melting or solidification:
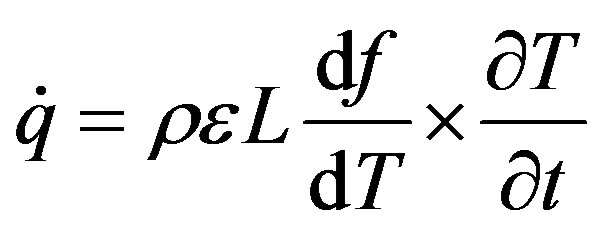 (9)
(9)
Thus, the heat transfer generated by the PCM phase change can be considered as a heat source in the heat balance equation. Here, the resolution of this equation is performed by coupling a PCM model that calculates the rate of energy generation  given the local temperature T in the PCM wallboard, with the existing building thermal model which calculates the temperature T according to this local rate of energy
 ; this iterative procedure is illustrated in Figure 3. According to this algorithm, the interaction between the PCM phase change and the building thermal evolution is dynamically taken into account: at each time step, given the discrete temperature field vector in the building at the beginning of this time step Tn, an iterative procedure that couples the PCM model and the Building model leads to a convergence at the temperature vector at the end of this time step Tn+1. This algorithm has been implemented using an object oriented approach (in a Delphi language environment): both PCM and building thermal models are objects that exchange variables (vectors
  and Tn) during the iteration procedure. For a traditional building thermal simulation, a half hour time step is often sufficient to ensure the convergence of this iterative procedure.
3. Numerical Comparisons between the PCM Wallboard-Building Coupled Model and a Reference Model
The aim of this section is to verify the reliability of the PCM wallboard-building model resulting from the coupling presented in Figure 3. Numerical results from the PCM wallboard-building coupled model are compared with numerical results from a reference model which has recently been experimentally validated by Dauvergne [15] and Dauvergne and Palomo Del Barrio [16] . This reference model assumes unidirectional heat transfers, constant thermo-physical properties, no convection in the liquid PCM and no hysteresis or sub-cooling effect.
A simple configuration is considered: a wall made of 15 cm gypsum (the matrix), in which PCM (paraffin) is homogeneously mixed. The PCM mass fraction is ε = 0.15 and its latent heat of fusion is L = 112 kJ/kg. The phase change temperature range is defined from Tlow = 17˚C to Tup = 28˚C (see Figure 2). Other material thermo-physical parameters are given in Table 1. Newton boundary conditions are considered on each side of the wall. The air temperature on the interior side is 24˚C, and the external side is subjected to climatic driving forces corresponding to a meteorological station located in the south of France (city of Agen). The simulation time step is 1 hour, and the simulation is run for a whole year.
In order to compare numerical results from these two models, a mean wall temperature is considered. Note that the interior surface wall temperature would probably have been more appropriate for making this comparison, because this surface exchanges both with the thermal zone and with the PCM wallboard; however, as pointed out in Section 2.1 (see Figure 1), this interior wall surface temperature is not calculated directly by the building simulation tool. As a consequence, instead of extrapolating node temperatures to obtain an internal wall surface temperature, the spatial averaged wall temperature has been considered as a reasonable quantity to compare those model outputs.

Table 1. Thermo-physical properties of materials used to compare the coupled PCM-Building model with the reference model developed by Dauvergne [15] .
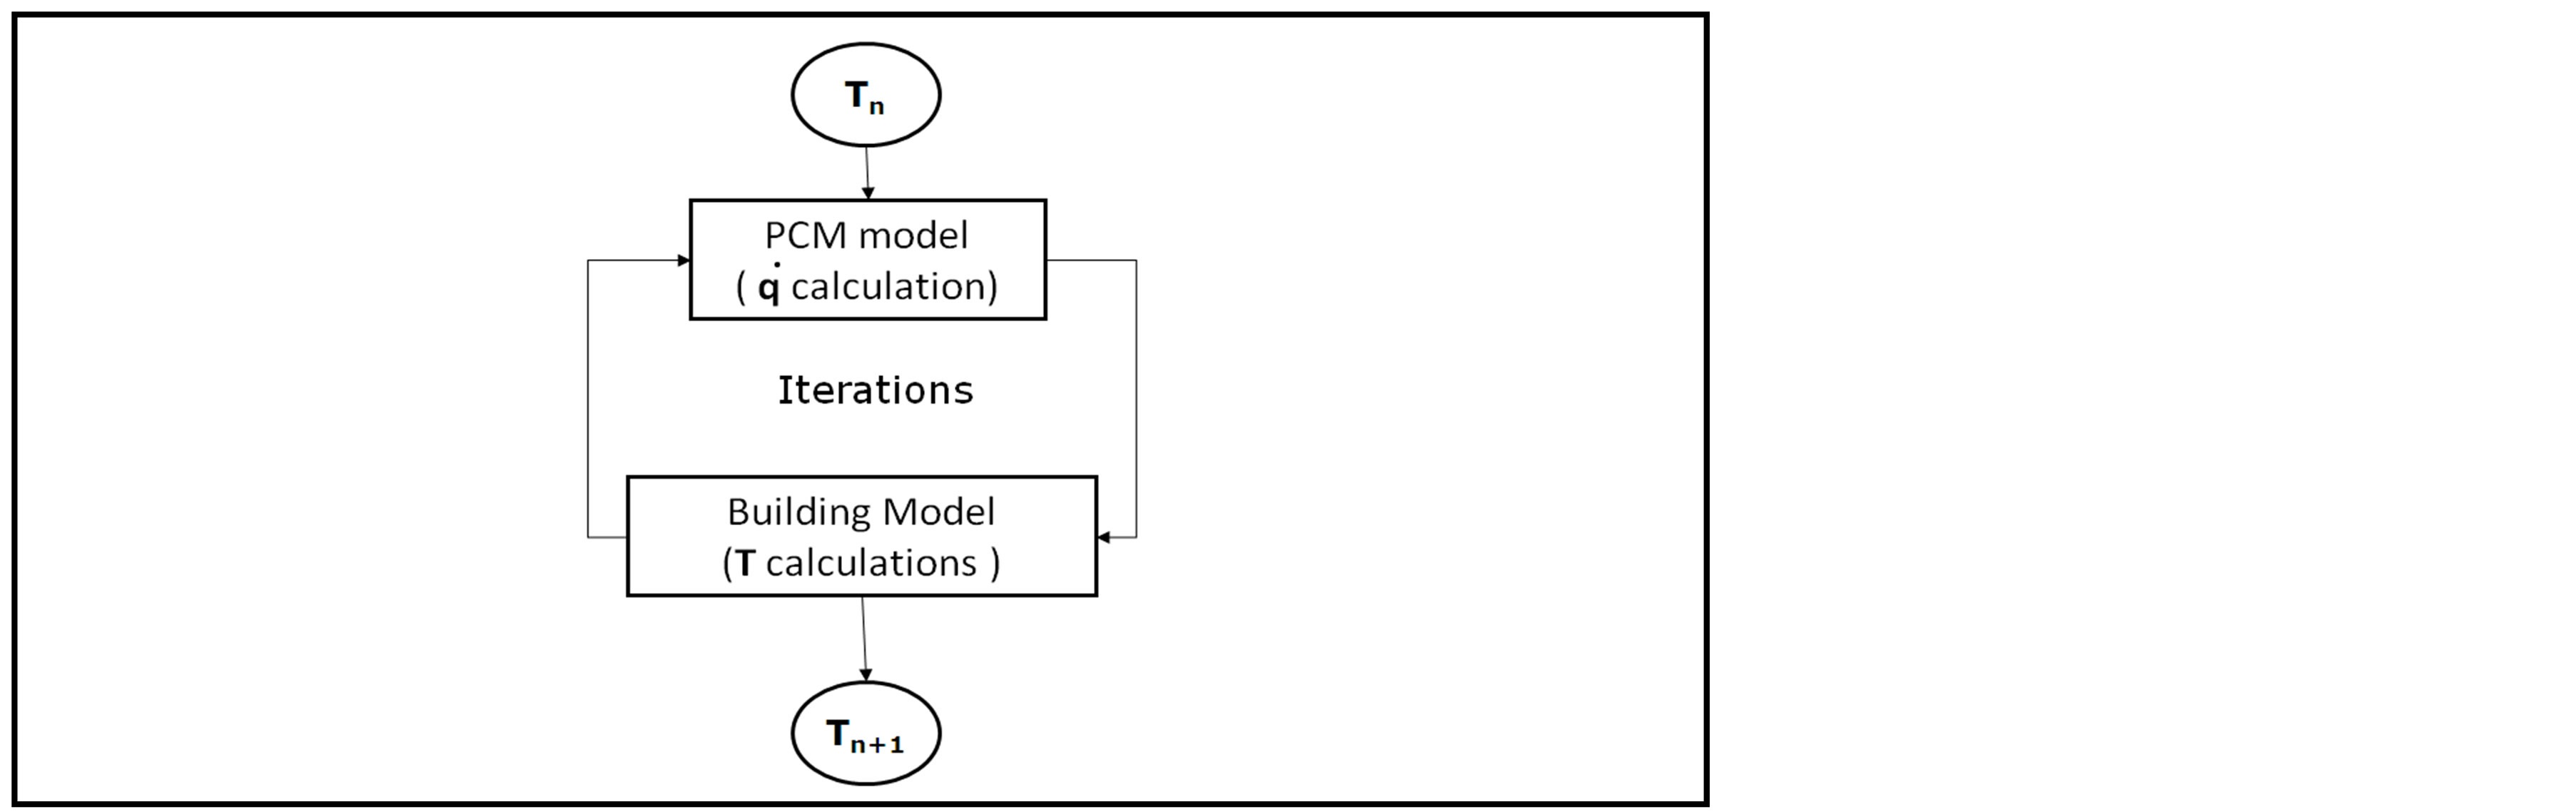
Figure 3. PCM model—Building model coupling procedure.
Figure 4 deals with the influence of the number of nodes retained for the simulations with the PCM wallboard-building coupled model on the reliability of the corresponding simulated results. Results obtained with three nodes appear to be quite close to those obtained with the reference model from Dauvergne and Palomo Del Barrio [16] . This number of nodes requires a compromise between accuracy and computation time, in accordance with building design objectives and with the level of precision of the usual PCM wallboard manufacturer commercial data: the mean discrepancy between the 3-node model and the reference model is 0.08˚C for the whole period (1 year), with a maximum discrepancy of 0.48˚C. This difference may be in part a consequence of the approximation, using a linear function, of the PCM enthalpy-temperature curve (see Figure 2). Simulations for the simplified model with fifteen nodes have also been performed, and the temperature results in this case are quite close to those obtained with the 3-node model [24] . As a consequence, the PCM wallboard-building coupled model, which contains the discretization procedure described in Section 2.1, is considered to be a reliable model.
One objective of this paper is to point out that using a building-PCM wallboard coupled design tool of this kind, architects and engineers will be able to evaluate the thermal performance (or non-performance) of PCM wallboards (through the professional interface Pleiades) in the early design phase of building projects. Such an evaluation is performed next using two indicators: a PCM Utilization Factor UF defined specifically in this paper, and degrees∙hours of discomfort DH. Consideration is mainly given to thermal comfort in summer, but some focuses on winter heating load are also briefly considered. With this objective in mind, the PCM wallboard-building simulation tool is applied in the next section to two real case studies to illustrate this evaluation procedure for using PCM wallboard in buildings.
4. PCM Wallboards Performance Indicators
To evaluate quantitatively the influence of the PCM on thermal comfort, two indicators are used. The first, commonly used to evaluate the summer comfort in buildings, is the degrees hours of discomfort DH: this is the sum, over a given simulation period (July and August in this paper) and for each hour h in this period, of the hourly average value of the over-temperature in a considered building zone, relative to a reference temperature Tref (26˚C in our case).
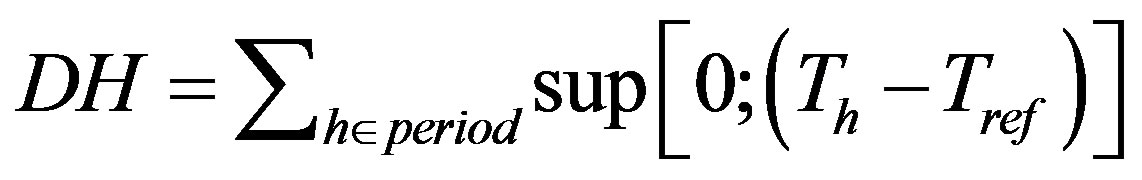 (10)
(10)
The second indicator is the PCM utilization factor UF. It is proposed and defined in this paper in order to
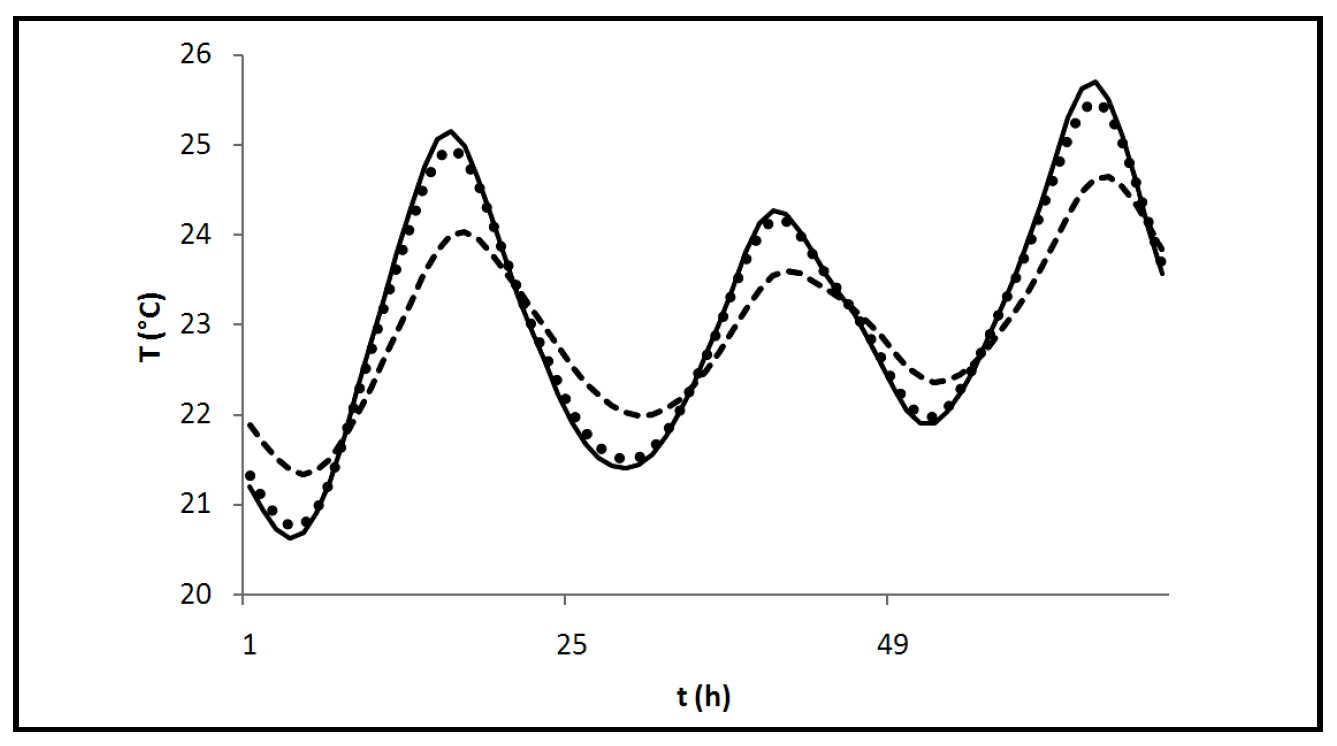
Figure 4. Mean wall temperature versus time. Dashed line: PCM wallboardbuilding coupled model with one node, dotted line: PCM wallboard-building coupled model with three nodes, body line: reference model [15] .
evaluate the performance of the melting/solidification process. It is the ratio between the energy stored and released by the PCM over a given simulation period (July and August in this paper), and the maximum energy which would have been stored and released by the PCM if it had completely melted and solidified each day during this period:
 (11)
(11)
In the preceding equation  is the number of days over the considered period. This indicator has been proposed to help to assess the efficiency of the PCM wallboards and their interaction with the building envelope: a unit value for the UF indicator means that the PCM melts and solidifies completely every day (24 hours), which gives a maximum thermal storage performance. If UF is lower than unity, either the sizing (for instance the area covered with PCM wallboards, or the number of layers) or the management of the building (windows opening during the night) is not appropriate.
5. Using PCM Wallboard-Building Coupled Model on Two Case Studies
Two different and complementary case studies are considered: a timber frame family house project and an existing office building. The PCM wallboard characteristics which are considered in both cases are given in Table 2. In order not to overload the present paper, the descriptions of the building envelopes are concise and focus on the main significant parameters.
5.1. Case Studies: A Short Description
The first case study is a timber frame family house project (see Figures 5 and 6). This is a two-storey building with a useful area of 84 m2, and a south oriented main facade. The external walls and the first floor are timber framed. The ground floor, made of concrete, is the main contributor to the thermal mass of the house. The external envelope is well insulated: 23 cm insulation on the external walls, 8 cm on the floor, and 35 cm on the ceiling (all insulation layers are placed in the external side of the walls). The thermal bridges are treated, and the double glazed windows are filled with argon and coated with a low emissivity surface.
This timber frame house is occupied by a single family (4 persons). The heating set point temperature is constant at 20˚C. The house is empty from 9 am to 6 pm from Monday to Friday. The air change rate acr (given by the ratio between the ventilation flow rate and the volume of the zone) during the day is fixed at 0.5 h−1 and the nominal efficiency of the heat recovery ventilation system is 80%. During summer, the air change rate is supposed to be 6 h−1 at night (when family members are sleeping), achieved by appropriately opening the windows; furthermore, it is assumed that during the day the occupants use the external manual roller blinds, that 75% of the window areas are covered by these blinds, and that these blinds are completely opaque to solar radiation
Table 2. PCM wallboard thermo-physical properties considered for both case studies.
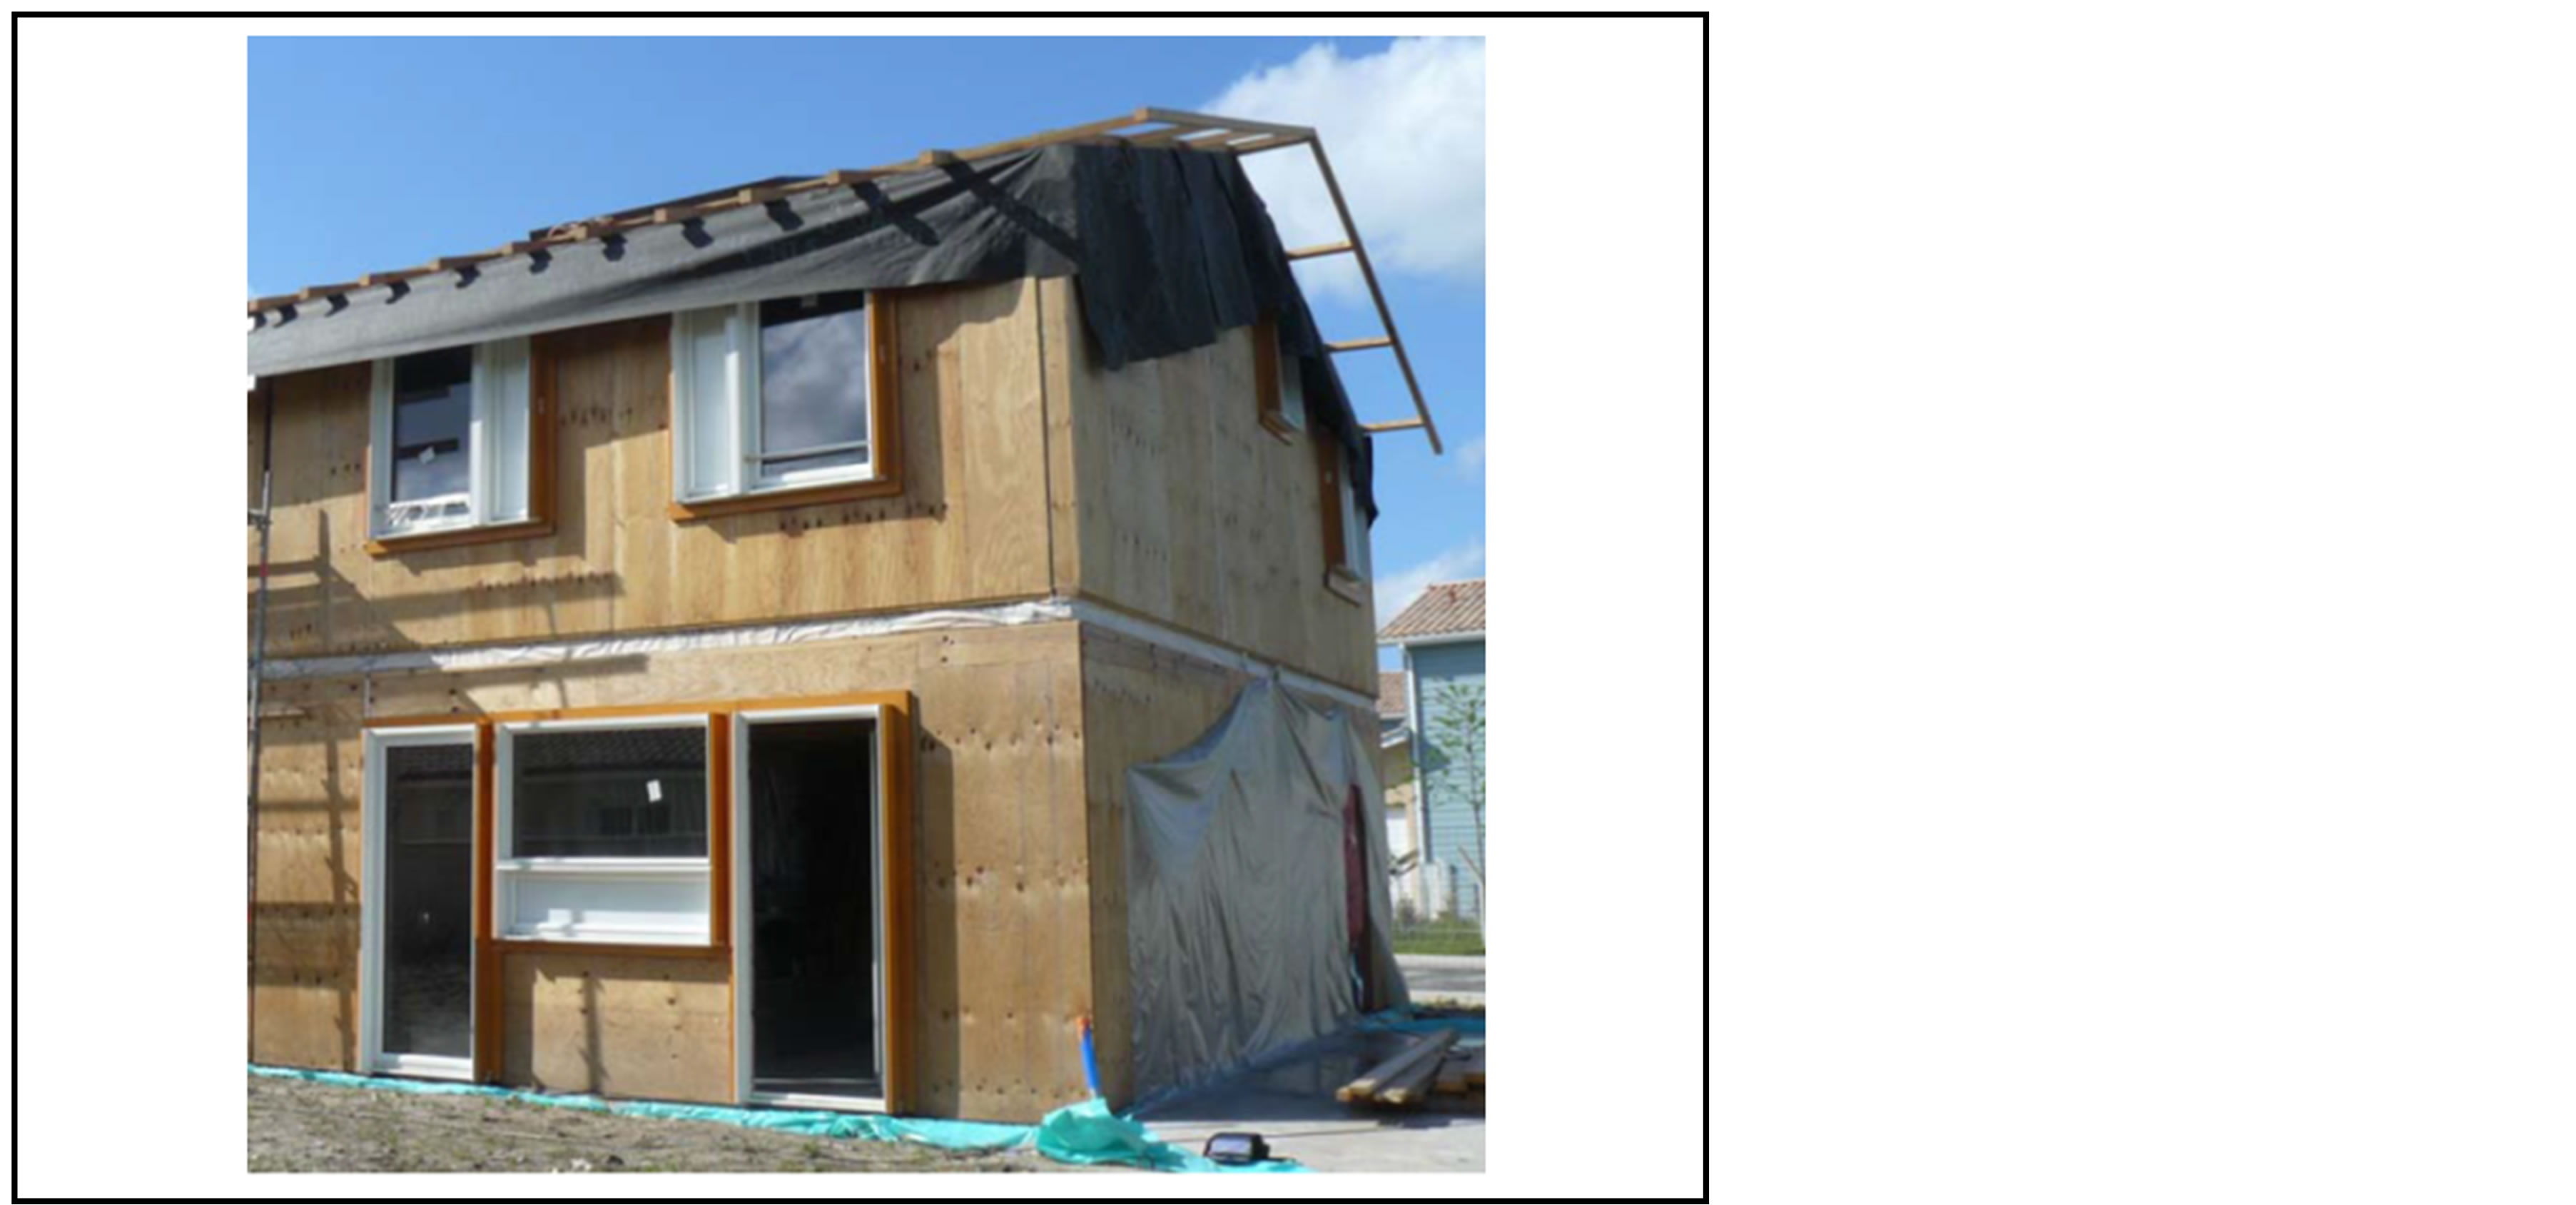
Figure 5. Photograph of the family house project (south facade) under construction.
(solar factor equal to 0). The building is situated in an oceanic and hot climate (Agen, south of France). According to the simulation results, the annual heating load of this building, with no PCM use, is 1686 kWh (18 kWh/m2).
In this timber frame house, PCM wallboards are incorporated into the internal finishes in order to lower the heating load and improve thermal comfort in summer. The PCM wallboards are integrated into the ceiling (47 m2) and one wall (20.5 m2) of both floors, replacing plasterboards without PCM. The PCM wallboard area ratio (ar), i.e. the ratio between the PCM wallboards surface area and the useful surface area (floor area) of the considered thermal zone, is 1.6 and the latent heat per unit useful surface area is 147 Wh/m2.
The second case study is an existing office building. As illustrated in Figure 7, this is a two-storey building, with a useful area of 1700 m2. The envelope structure is made of steel, and the ground and first floor slabs are 20 cm thick concrete paving. The level of insulation is rather low: 5 cm of mineral wool in the external walls and 8 cm in the roof.
The offices are occupied from 9 am to 6 pm from Monday to Friday. The heating set point temperature is 20˚C during occupation and 15˚C the remaining time. The air change rate during the day is fixed at 1 h−1 during occupation, and 0.1 h−1 at other times. During summer, at night, it is assumed that it can reach 8 h−1 by natural ventilation (low and high window openings). As with the house project, the meteorological location for the reference case is an oceanic and hot climate (Agen, south of France). Because of a need of some natural lighting, it is assumed that in summer external blinds shade a fixed percentage of the surface of the windows during the day (50%). According to the simulation, the annual heating load for the whole building is 63 kWh/m2 with no PCM use.
In this office building, PCM wallboards are only installed in the south oriented office, as shown in Figure 8. This thermal zone covers a useful area of 170 m2.

Figure 6. Ground floor plan of the timber frame house project.
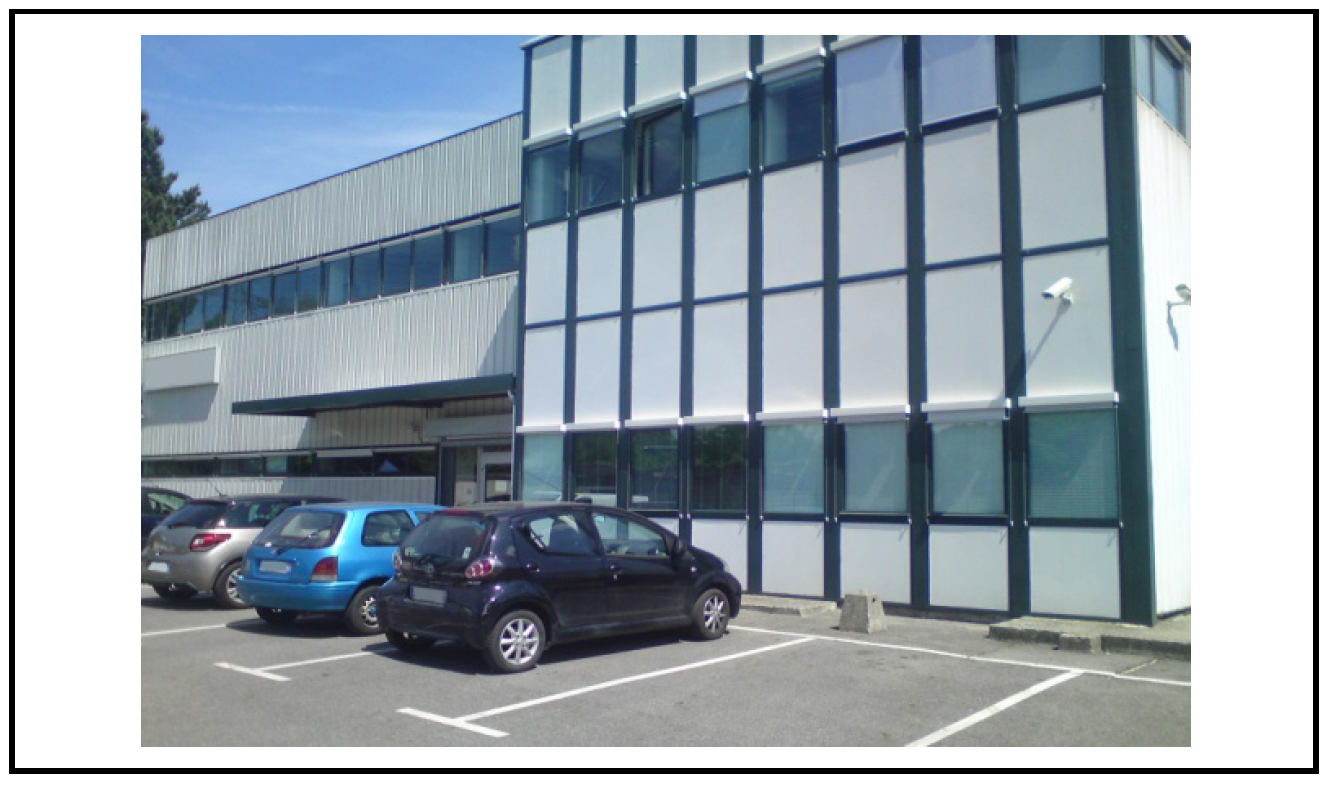
Figure 7. Photograph of existing office building (west facade).
The thermal behaviour of the two cases is studied according to the following main parameters: the windows shading coefficient, the air change rate at night in summer (acr) and the PCM wallboard area ratio (ar).
5.2. Case Studies Simulation: Results and Discussion
5.2.1. Timber Frame House
In the first case study (timber frame family house), the PCM plasterboard reduces the annual heating load (1406 kWh) by 17%: the use of PCM wallboard leads to more solar energy storage during the day and energy release during the evening and the night to heat the house. Thermal comfort is also improved: according to Figure 9, the peak temperature on the first floor during the afternoon in summer is reduced by approximately 2˚C when PCM plasterboards are used. Note that in this figure, no time lag occurs between zone temperature curves obtained

Figure 8. Multi-zone partitioning of the existing office building. Dashed surface: zone with wallboards (south facing office).

Figure 9. Zone temperature on the first floor of the timber frame house, for a few summer days. Meteorological location: Agen (south of France). Dashed line: without PCM wallboards. Solid line: with PCM wallboards.
with or without the use of PCM wallboards. This established fact is a consequence of the high air change rate (6 h−1 at night) which strongly influences the zone temperature: this temperature decreases considerably after opening the windows at night. In order to point out an existing time lag between simulations with and without PCM wallboards, the temperature evolution inside one PCM wallboard is shown in Figure 10: here, a shift in time is noticeable as is to be expected between two buildings with different thermal masses.
Simulation results in terms of degrees∙hours of discomfort and PCM utilization factor are summarised in Table 3. DH values, for the house with or without PCM, and UF values are presented for low and high air change rates and for low and high daytime window shading.
Note that the influence of the PCM on summer comfort depends heavily on the occupants’ behaviour. For instance, in the case of high night ventilation, the PCM has a greater influence on the DH of discomfort if the blinds are not used: with 75% window shading, DH drops from 26˚C∙hours without PCM to 0˚C∙hours with PCM, whereas with 0% window shading, DH falls from 215˚C∙hours to 25˚C∙hours. The main reason for this is that with 75% shading and high night ventilation, thermal comfort is intrinsically rather good, and the use of PCM is not entirely appropriate. On the other hand, if the occupants do not use the external blinds, the PCM becomes more useful: in this case the UF value of the PCM is 0.29, meaning that the PCM operates at 29% of its potentiality (it is 0.15 with 75% shading).
Table 3. Degrees∙hours of discomfort (DH) and PCM utilization factor (UF) for the timber frame house (first floor) in terms of the night air change rate and the day window shading.
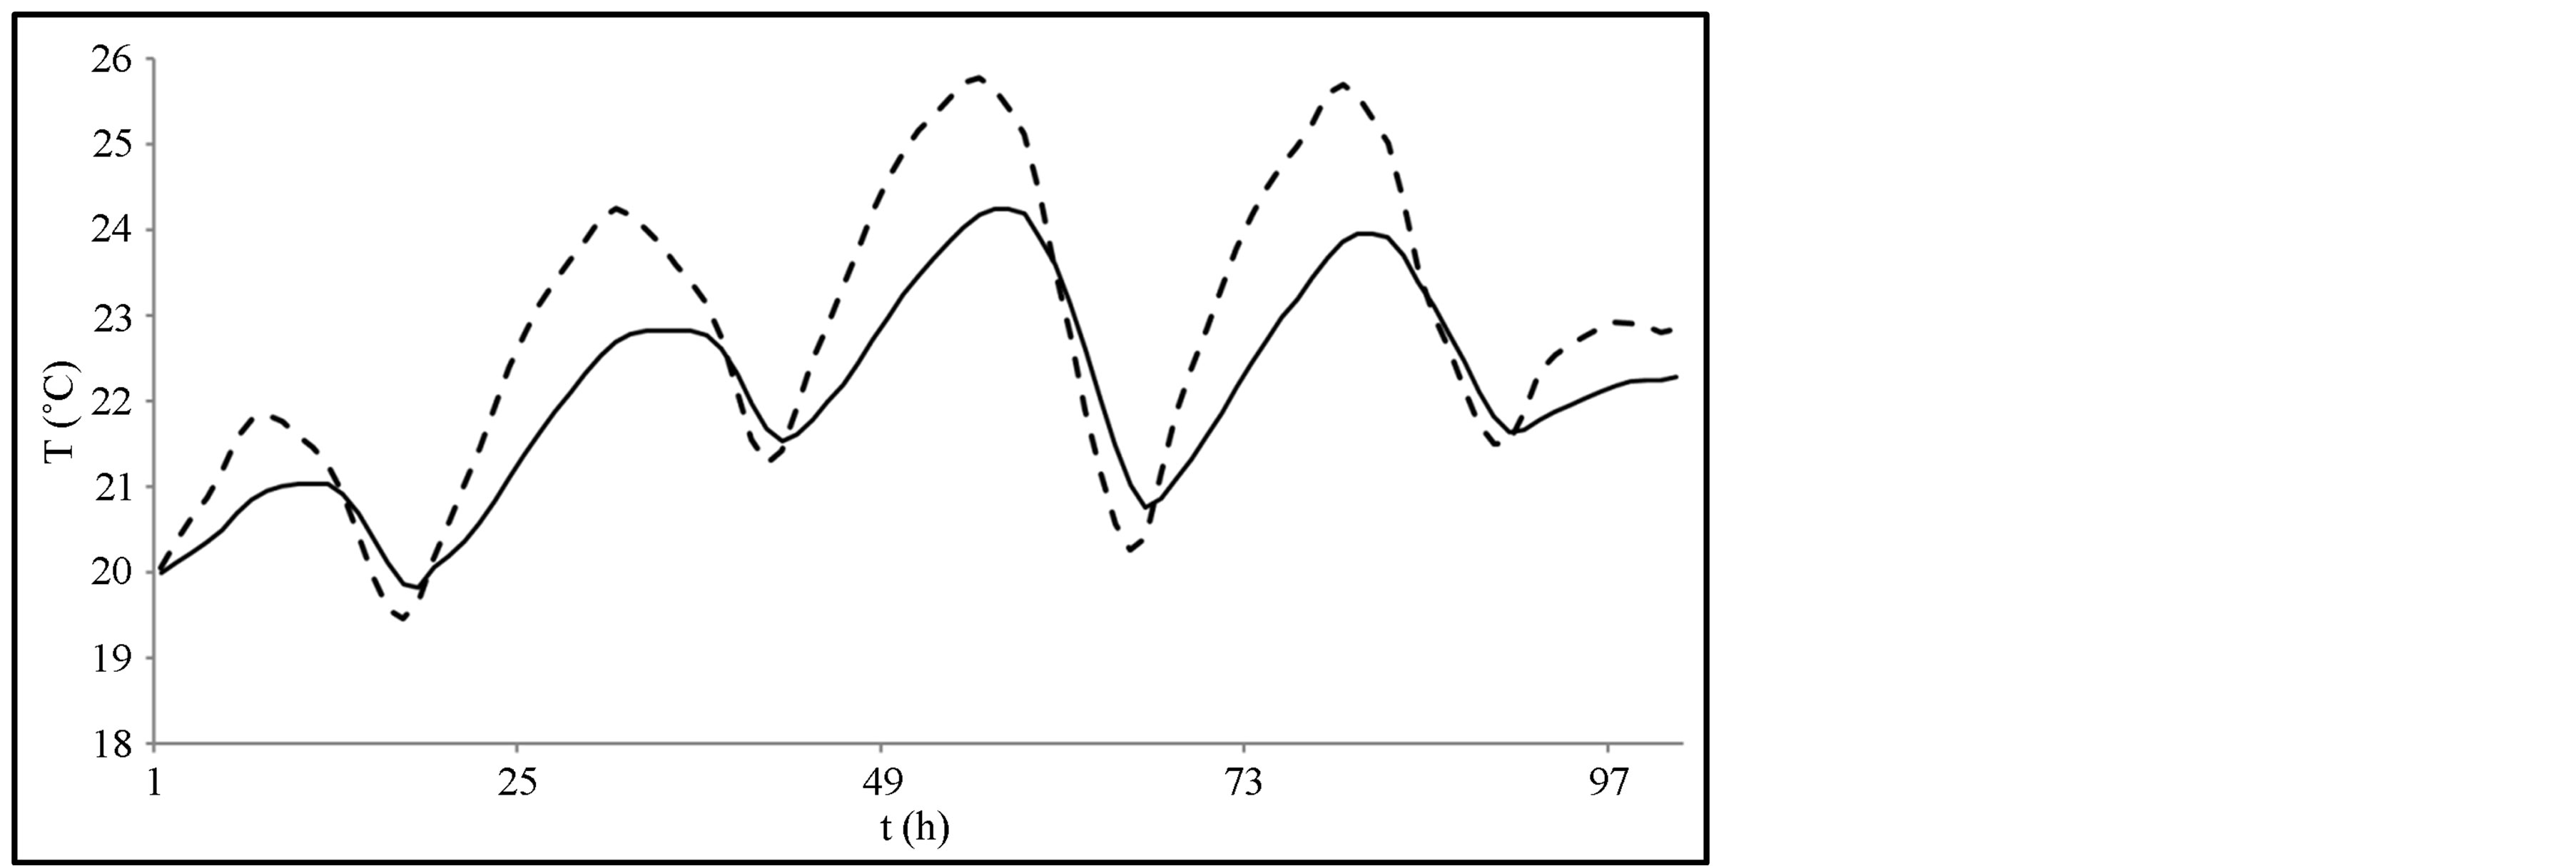
Figure 10. Temperature inside one wallboard on the first floor of the timber frame house, for a few summer days. Meteorological location: Agen (south of France). Dashed line: wallboards without PCM. Solid line: wallboards with PCM.
In addition, it can be noted that the PCM is really ineffective when there is no night ventilation or when this is low: both for low and high window shading, the influence of the PCM wallboards on DH is not significant, and UF for this material is low. This is mainly a consequence of the low PCM regeneration during the night because of this low air renewal and circulation. This non-regeneration is more pronounced if the windows are not shaded: the temperature during the whole 24 h cycle is then often too high to allow any PCM regeneration.
5.2.2. Office Building
Concerning the second case study (office building), the PCM wallboards do not significantly reduce the heating load. For instance, if the PCM wallboards are installed on the ceiling and the external wall of the south-facing office, the heating load of this thermal zone is 8066 kWh without PCM and 7898 kWh with PCM: as the heating set point temperature drops to 15˚C at 6 pm, the solar energy that could have been stored during the day is not used during the evening.
One thermal zone of the building has been selected for analysis of summer comfort, the south-facing office (see Figure 8). Simulation results in terms of degrees∙hours of discomfort DH and PCM utilization factor UF are shown in Figure 11 plotted against the PCM wallboard area ratio ar (the ratio between the surface area of the installed PCM wallboards and the surface of the selected office). Each PCM wallboard that has been installed replaces plasterboard without PCM. The surface covered with PCM wallboards is, from partial to total coverage, 1) the ceiling, 2) the ceiling and the external walls, 3) the ceiling, the external walls and the internal walls, 4) the ceiling, the external walls and the internal walls with 2 layers of PCM wallboards. In Figure 11, vertical dashed lines define the transitions between these different configurations. Figure 12 shows the time evolution of the zone temperature in the office for the following configurations: plasterboards without PCM, and 1 or 2 layers of PCM plasterboard on the ceiling, on the external and internal walls, and Figure 13 shows the time evolution of the temperature inside one of the first wallboard layer (from inside) for the same configurations. Figure 14 shows the degrees∙hours of discomfort DH and the PCM utilization factor UF versus the night air change rate acr, for 1 layer of PCM plasterboard on the ceiling and on the external walls.

Figure 11. Degrees∙hours of discomfort (diamond dots) and PCM utilization factor (square dots) versus PCM wallboard area ratio, for the south-facing zone of the office building. Meteorological location: Agen (south of France). Night air change rate: 5 h−1.
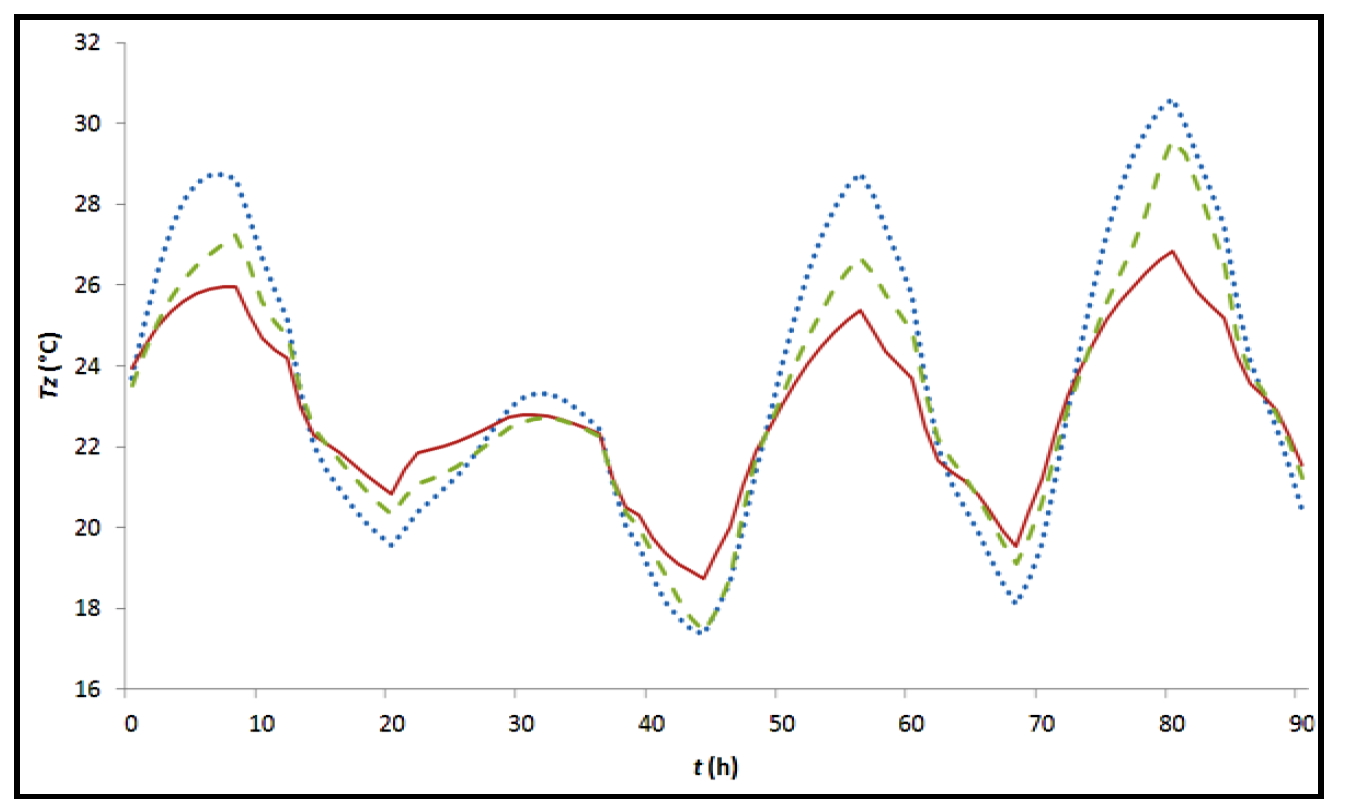
Figure 12. Zone temperature of the south-facing zone of the office building for four consecutive summer days (meteorological location: Agen, south of France). Dotted line: without PCM; dashed line: one layer of PCM wallboard; Body line: two layers of PCM wallboard. The PCM wallboards cover the ceiling and the external and internal walls.
In Figure 11, one can see that DH decreases linearly with the PCM wallboard area ratio ar, from almost 2000˚C∙h to around 700˚C∙h, until the ceiling and the external and internal walls are covered with 1 PCM wallboard layer. It then decreases more slowly when a second layer of PCM wallboard is added (from 700˚C∙h to 300˚C∙h approximately). UF decreases from almost 0.85 to 0.72 for the first PCM wallboard layer, and from 0.72 to almost 0.45 for the second layer. The second layer of PCM is indeed useful, but because it covers the first one and reduces its thermal accessibility, it contributes strongly to the decrease in PCM wallboard utilization factor UF.
In order to illustrate the ability of PCM wallboards to reduce the temperature peaks in the office, Figure 12 shows the time evolution, over 4 summer days, of the zone temperature for the whole available surface (ceiling, external and internal walls) covered by 1 layer and 2 layers of PCM wallboard respectively. The simulation results without PCM use are also given. Note that the influence of the number of layers depends on the change in
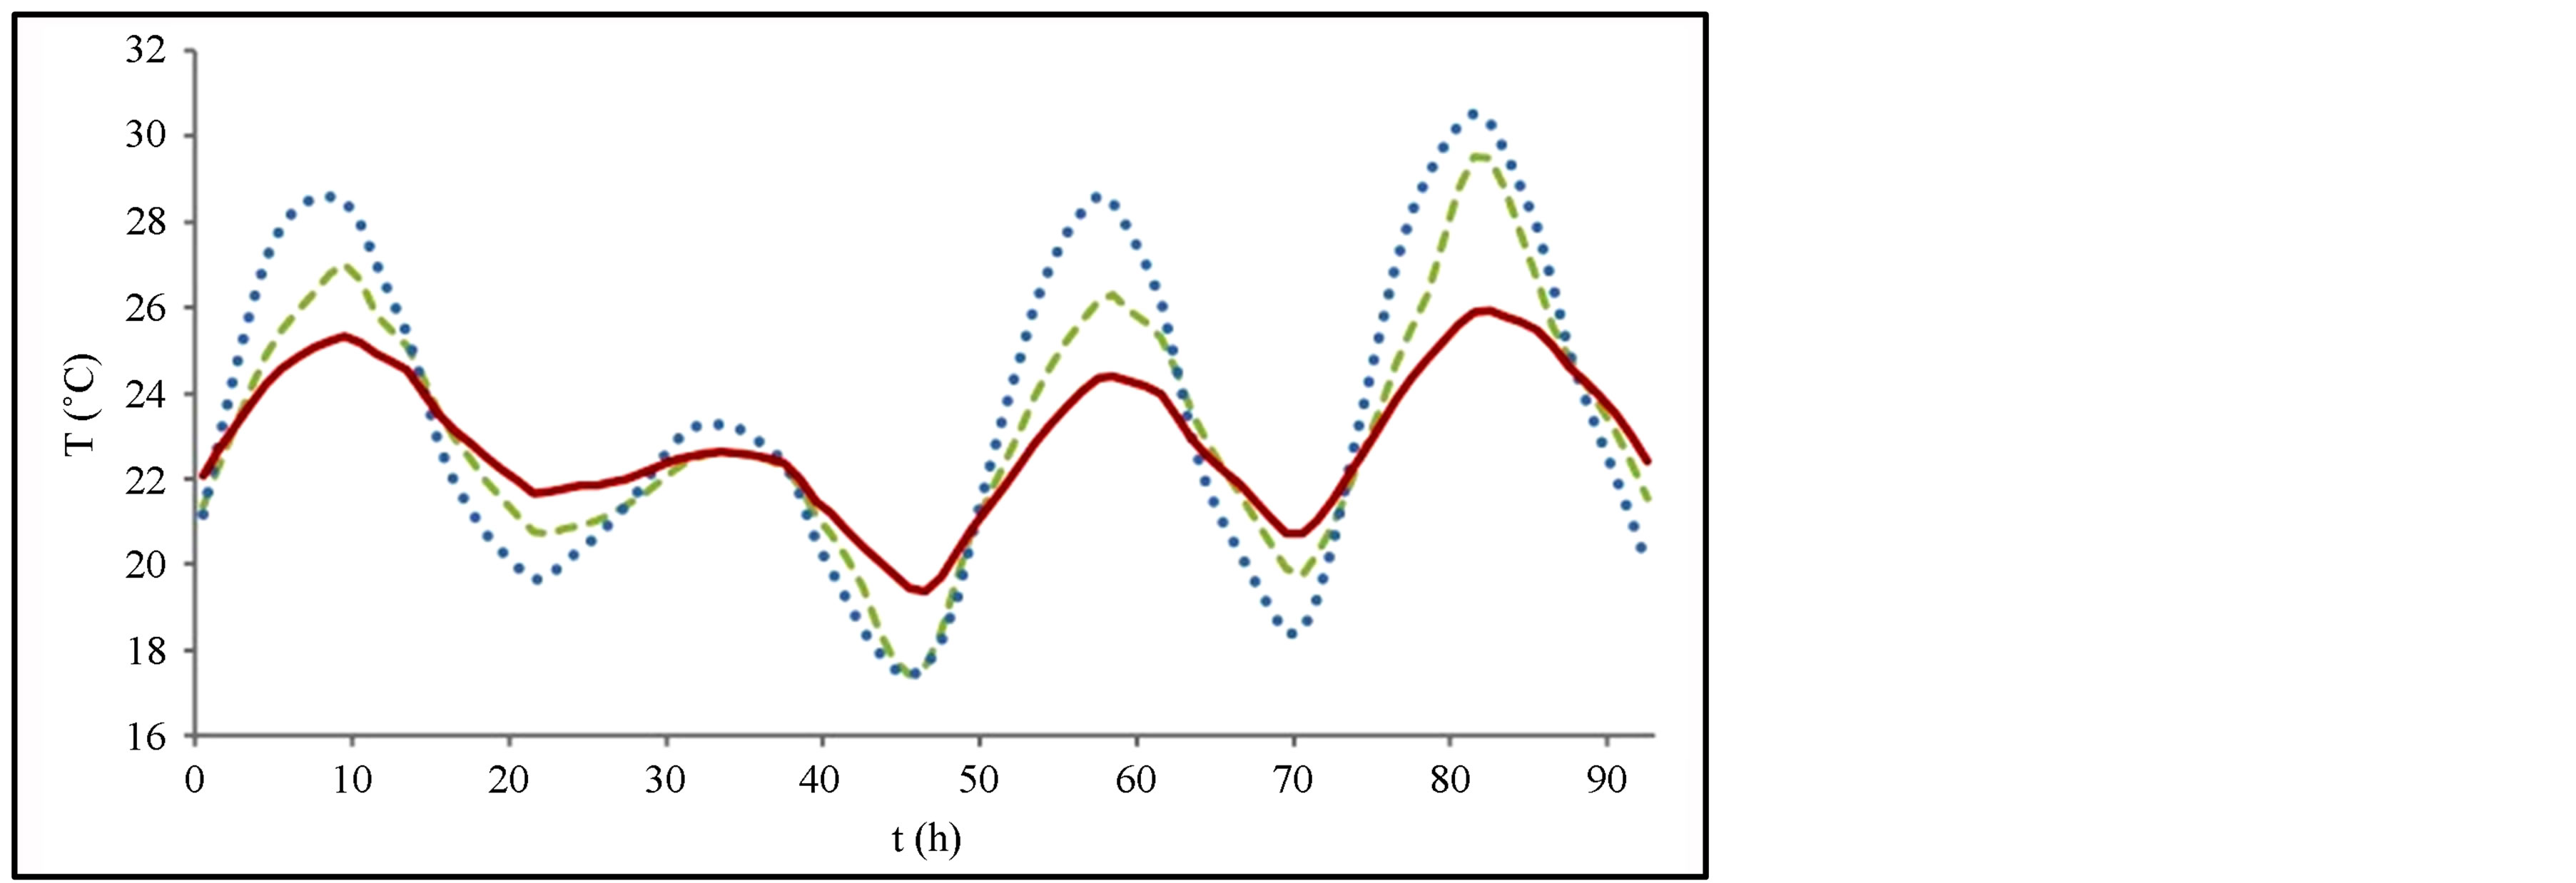
Figure 13. Temperature inside one of the first wallboard layer (from inside) of the south-facing zone of the office building for four consecutive summer days (meteorological location: Agen, south of France). Meteorological location: Agen (south of France). Dotted line: two layers of wallboards without PCM. Solid line: two layers of wallboards with PCM.
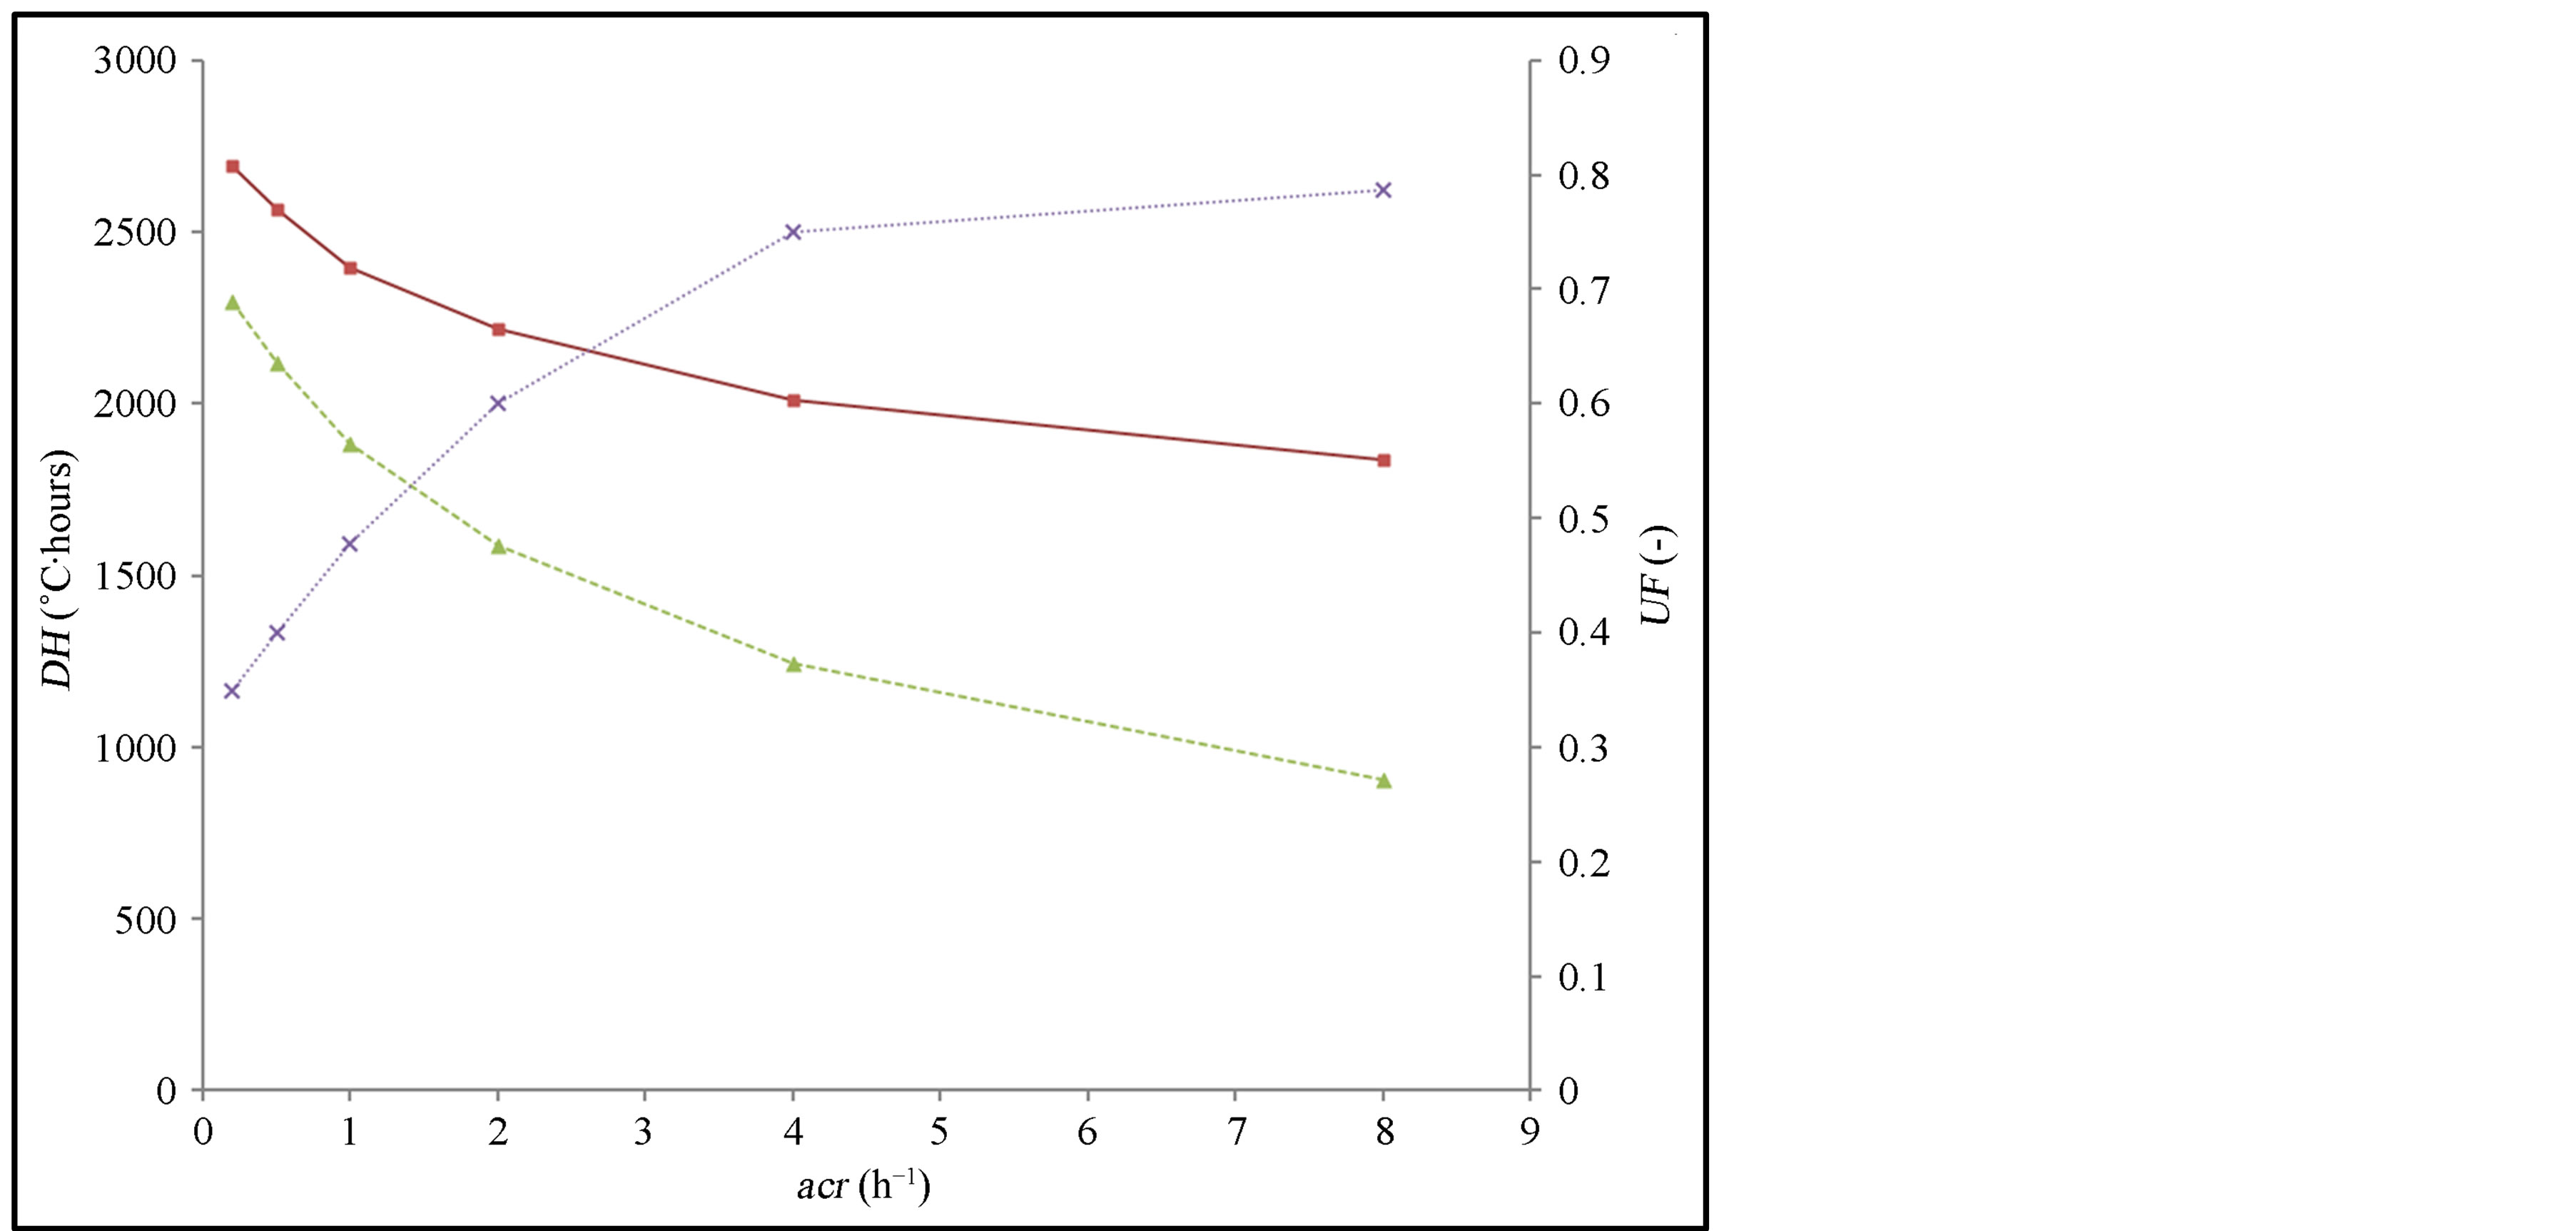
Figure 14. Degrees∙hours of discomfort DH without (square dots) and with PCM wallboards (triangle dots) and utilization factor UF (cross dots) in terms of the night air change rate; south-facing zone of the office building. 1 layer of PCM wallboard on the ceiling and external walls.
the zone temperature: for the third day, for example, (hours between 44 and 68) the peak temperature reduction with one layer is around 2˚C and the over reduction caused by the second layer is 1.3˚C (total reduction being 3.3˚C), and for the fourth day (hours between 68 and 92) the peak temperature reduction with one layer is 1.0˚C and the over reduction caused by the second layer is 2.8˚C (total reduction being 3.8˚C). The fourth day is warmer than the previous ones (the second day is relatively cold) and the zone temperature tends to get too high during the daytime. Thus, the first layer of PCM wallboard melts quickly and most of it is melted by the end of the morning making it quite ineffective during the afternoon. In this case the second layer is useful as it can significantly impact the energy balance in the thermal zone. This analysis is confirmed by Figure 13 which gives the temperature inside the first wallboard layer (from inside). The first and the third days, on the other hand, are cooler than the fourth day and the first layer of PCM is sufficient to significantly impact the energy balance during the whole day. Thus, although for the whole summer period, the second PCM wallboard layer is globally less efficient than the first one, for the warmest days of summer it does become quite necessary.
Results presented in Figure 14 show that the PCM utilization factor UF and the degrees∙hours of discomfort DH depend strongly on the night ventilation (i.e. on the air change rate acr). Such simulation results are useful for engineers and architects for reaching a good compromise between DH and UF and the air change rate when designing a building renovation project with PCM wallboard. Indeed, in the present case, an acr of 4 h−1 leads to a large reduction in DH (from around 2000˚C∙h to about 1200˚C), whereas UF is 0.75, very close to its maximum value of 0.8 which is reached for an acr of 8 h−1.
5.3. Discussion
The results for the two case studies do not provide any general rules on integrating PCM wallboards in buildings. They do, however, illustrate the possibilities that the PCM wallboard-building coupled model can offer in predicting performance when using PCM wallboards in two real case studies. This performance depends very much on building use and its intrinsic properties (mainly insulation, thermal mass, window surface and shading).
For example, according to the results given above concerning the heating load, the use of PCM wallboards is more successful in the timber frame family house than in the office building, but this result is mainly a consequence of the heating set point temperature in the office building being set to 15˚C after 6 pm, thus preventing the solar energy stored by the PCM during the daytime from being used effectively in the evening.
Conversely, concerning summer comfort, the use of PCM wallboards is more successful in the office building than in the timber frame family house because the internal gains (due to occupants, lighting and other equipments) are higher in the office building during the day; the temperature during the day tends to be higher in the office than in the house, leading to a higher temperature difference between daytime and night-time for the office than for the house, i.e. conditions that are more favourable for the PCM wallboards to achieve their complete melting/solidification cycles.
The two case studies highlight the fact that the PCM thermal effect interacts strongly with the night ventilation or the use of the window shading device, hence the influence of the PCM wallboards on summer comfort depends strongly on occupant behaviour. As already pointed out, the PCM wallboards need a sufficient temperature difference between daytime and night-time to be efficient, thus the occupants who shade the windows during the day and open the windows during the night have a strong impact on the level of utility of the PCM wallboards. For instance, concerning the south zone of the office building, DH dropped from almost 2000˚C∙hours to 1200˚C∙hours when the night air change rate varied from 1 h−1 to 4 h−1: the night air change has a significant influence on the temperature inside the office, thus increasing the night air change rate facilitates PCM solidification and beyond its complete melting/solidification process, and consequently contributes to increasing the potential for using the PCM wallboards.
By varying the number of PCM wallboard layers from 1 to 2, the question of the PCM wallboard thickness was considered for the second case study (the office building). Although when considering DH and UF, the beneficial effect of a second layer of PCM wallboards is less than that of the first layer, this second layer becomes particularly useful when the days are extremely hot: the first layer then only has an influence in the morning when the PCM melts almost completely, with the second layer providing additional PCM for cooling the building in the afternoon (with the reduction in the peak temperature reaching almost 4˚C on the warmest days).
6. Conclusion
In this paper we have coupled the modelling of a PCM wallboard with an existing building thermal design tool (“Comfie”). For this purpose, the PCM phase change thermal effect has been described as an external heat source term for the heat balance equation. The reliability of the resulting PCM wallboards-building tool has been verified by comparing numerical results with reference modelling which has been recently validated experimentally. Using two global indicators (a PCM utilization factor UF defined in this paper, and the more traditional degrees∙hours of discomfort DH), this PCM wallboards-building tool has then been used for two real case studies (via the professional interface “Pleiades”) to indicate its utility in the early phase of building design, as a decision-making support for the use (or not) of PCM wallboards. Furthermore, for these two real case studies, computation times are approximately 1.5 times higher when PCM wallboards coupled calculations are activated (compared with the original building tool, i.e. for calculations without PCM wallboards), but remain lower than 1 mn using a standard office computer for a year-long simulation for the two real case studies. Finally, even if the PCM wallboard model is independent of the “Comfie” building thermal model tool, for a user accessing the “Pleiades” ergonomic interface, it seems to be completely integrated into it. For these reasons of user-friendliness and short calculation times, once building and PCM wallboard design parameters have been chosen and a corresponding experimental design has been fixed, the building-PCM wallboard design tool developed in this paper is well adapted to sensibility studies or multi-criterion optimization for buildings that contain PCM wallboards. This tool (a PCM module included in the software Pleiades-Comfie, downloadable from www.izuba.fr) is widely distributed in France (more than 2000 active licenses) and in some other European countries, and offers a high level of dissemination and use of the scientific developments described in this paper.
Acknowledgements
This work was supported by the French Environment and Energy Management Agency (ADEME) and the National Research Agency (ANR) through the PREBAT program (project PACIBA, 2006-2010).
References
- Zhou, D., Zhao, C.Y. and Tian, Y. (2012) Review on Thermal Energy Storage with Phase Change Materials (PCMs) in Building Applications. Applied Energy, 92, 593-605. http://dx.doi.org/10.1016/j.apenergy.2011.08.025
- Tyagi, V.V. and Buddhi, D. (2007) PCM Thermal Storage in Buildings: A State of Art. Renewable & Sustainable Energy Reviews, 11, 1146-1166. http://dx.doi.org/10.1016/j.rser.2005.10.002
- Kuznik, F., Virgone, J. and Johannes, K. (2011) In-Situ Study of Thermal Comfort Enhancement in a Renovated Building Equipped with Phase Change Material Wallboard. Renewable Energy, 36, 1458-1462. http://dx.doi.org/10.1016/j.renene.2010.11.008
- Streicher, W. (2008) Final Report of Subtask C. Phase Change Material. Solar Heating and Cooling Programme—IEA Task 32.
- Bony, J. and Citherlet, S. (2007) Numerical Model and Experimental Validation of Heat Storage with Phase Change Materials. Energy and Buildings, 39, 1065-1072. http://dx.doi.org/10.1016/j.enbuild.2006.10.017
- Ekomy Ango, S. (2011) Contribution au Stockage d’Energie Thermique en Bâtiment: Développement d’un Système actif à Matériaux à Changement de Phase. Ph.D. Thesis, Université Bordeaux I, Talence.
- Dentel, A. and Stephan, W. (2010) Thermal Comfort in Rooms with Active PCM Constructions. Proceedings of the 8th International Conference on System Simulation in Buildings, Liège, 13-15 December 2010, 16.
- Tyagi, V.V., Kaushik, S.C., Tyagi, S.K. and Akiyama, T. (2011) Development of Phase Change Materials Based Microencapsulated Technology for Buildings: A Review. Renewable and Sustainable Energy Reviews, 15, 1373-1391. http://dx.doi.org/10.1016/j.rser.2010.10.006
- Feustel, H.E. and Stetiu, C. (1997) Thermal Performance of Phase Change Wallboard for Residential Cooling Application. Report LBL 38320, Lawrence Berkeley National Laboratory.
- Heim, D. and Clarke, J.A. (2004) Numerical Modeling and Thermal Simulation of PCM-Gypsum Composites with ESP-r. Energy and Buildings, 36, 795-805. http://dx.doi.org/10.1016/j.enbuild.2004.01.004
- Kuznik, F., Virgone, J. and Roux, J.J. (2008) Energetic Efficiency of Room Wall Containing PCM Wallboard: A FullScale Experimental Investigation. Energy and Buildings, 40, 148-156. http://dx.doi.org/10.1016/j.enbuild.2007.01.022
- Ibanez, M., Lazaro, A., Zalba, B. and Cabeza, L.F. (2005) An Approach to the Simulation of PCMs in Building Applications Using TRNSYS. Applied Thermal Engineering, 25, 1796-1807. http://dx.doi.org/10.1016/j.applthermaleng.2004.11.001
- Schranzhofer, H., Puschnig, P., Heinz, A. and Streicher, W. (2006) Validation of a TRNSYS Simulation Model for PCM Energy Storages and PCM Wall Construction Elements. Proceedings of the 10th International conference on Thermal Energy Storage, Ecostock, 31 May-2 June 2006, 6.
- Dutil, Y., Rousse, D.R., Ben Salah, N., Lassue, S. and Zalewski, L. (2011) A Review on Phase-Change Materials: Mathematical Modeling and Simulations. Renewable and Sustainable Energy Reviews, 15, 112-130. http://dx.doi.org/10.1016/j.rser.2010.06.011
- Dauvergne, J.L. (2008) Réduction et Inversion de Modèles de Conduction Thermique avec Changement de Phase. Ph.D. Thesis, Université Bordeaux I, Talence.
- Dauvergne, J.L. and Palomo Del Barrio, E. (2010) Toward a Simulation-Free P.O.D. Approach for Low-Dimensional Description of Phase Change Problems. International Journal of Thermal Sciences, 49, 1369-1382. http://dx.doi.org/10.1016/j.ijthermalsci.2010.02.006
- Borreguero, A.M., Sanchez, M.L., Valverde, J.L., Carmona, M. and Rodriguez, J.F. (2011) Thermal Testing and Numerical Simulation of Gypsum Wallboards Incorporated with Different PCMs Content. Applied Energy, 88, 930-937. http://dx.doi.org/10.1016/j.apenergy.2010.08.014
- Chen, C., Guo, H., Liu, Y., Yue, H. and Wang, C. (2008) A New Kind of Phase Change Material (PCM) for EnergyStoring Wallboard. Energy and Buildings, 40, 882-890. http://dx.doi.org/10.1016/j.enbuild.2007.07.002
- Ahmad, M., Bontemps, A., Sallée, H. and Quenard, D. (2006) Thermal Testing and Numerical Simulation of a Prototype Cell Using Light Wallboards Coupling Vacuum Isolation Panels and Phase Change Material. Energy and Buildings, 38, 673-681.
- Athienitis, A.K., Liu, C., Hawes, D., Banu, D. and Feldman, D. (1997) Investigation of the Thermal Performance of a Passive Solar Test-Room with Wall Latent Heat Storage. Building and Environment, 32, 405-410. http://dx.doi.org/10.1016/S0360-1323(97)00009-7
- Peuportier, B. (2005) Banc d’Essai de Logiciel de Simulation Thermique. Journée SFT-IBPSA—Outils de Simulation Thermo-Aéraulique du Bâtiment, La Rochelle.
- Peuportier, B. and Blanc-Sommereux, I. (1990) Simulation Tool with Its Expert Interface for the Thermal Design of Multizone Buildings. International Journal of Solar Energy, 8, 109-120. http://dx.doi.org/10.1080/01425919008909714
- Brun, A., Spitz, C., Wurtz, E. and Mora, L. (2009) Behavioural Comparison of Some Predictive Tools Used in a Low Energy Buildings. Proceedings of the 11th International Conference Building Simulation, Glasgow.
- Guiavarch, A., Bruneau, D., Dauvergne, J.L., Palomo Del Barrio, E., Peuportier, B. and Clottes, F. (2008) Intégration d’un Modèle Simplifié de Matériau à Changement De Phase dans Une plate-Forme d’aide à la Conception Energétique de Bâtiments. Proceedings of the IBPSA France Conference, Lyon, 6-7 November 2008, 8.
Nomenclature
acr air change rate (h−1)
ar PCM wallboard area ratio A, C, E, J, G matrices of the state-space physical model B, F, H, S matrices of the modal model Cp heat capacity (J∙kg−1∙K−1)
DH degrees∙hours of discomfort (˚C∙h)
e thickness (m)
f liquid fraction h mass enthalpy (J∙kg−1)
L latent heat of fusion (J∙kg−1)
n number of nodes
 number of days
 rate of energy generation per unit volume (W∙m−3)
 rate of energy generation per unit volume vector (W∙m−3)
r geometrical ratio T temperature (˚C)
T temperature vector (˚C)
t time (h)
U driving forces vector UF PCM utilization factor X modal state vector Y output vector
Greek Letters
e mass ratio of PCM
λ thermal conductivity (W∙m−1∙K−1)
ρ density (kg∙m−3)
Subscripts
low lower limit
m matrix material
period period of time
pcm PCM material
up upper limit
r reduced
ref reference
w PCM wallboard
NOTES

*Corresponding author.