Journal of Building Construction and Planning Research
Vol.1 No.2(2013), Article ID:32683,12 pages DOI:10.4236/jbcpr.2013.12005
Management Performance Evaluation Model of Korean Construction Firms
![]()
Department of Architectural Engineering, Kyung Hee University, Seoul, Republic of Korea.
*Corresponding author: kimskuk@khu.ac.kr, donghoon@khu.ac.kr, kmk@dongbu.co.kr
Copyright © 2013 Donghoon Lee et al. This is an open access article distributed under the Creative Commons Attribution License, which permits unrestricted use, distribution, and reproduction in any medium, provided the original work is properly cited.
Received April 16th, 2013; revised May 17th, 2013; accepted May 26th, 2013
Keywords: Management performance evaluation; Key performance indicators; Balanced Scorecard; AHP; Fuzzy
ABSTRACT
Corporate management performance evaluation currently focuses on financial aspects; however, it is necessary to identify and manage elements that contribute to increased economic values in the long run. When it comes to construction firms, most previous research did not cover weighting and estimation approaches for non-financial elements that ultimately influence financial status. In this research, the objective is to develop a management performance evaluation model for Korean construction firms. The model includes financial factors and non-financial factors. This research investigated actual data from Korean construction firms and classified their characteristics. This study is performed in two steps. First, this study derives KPIs for performance measurement techniques and weights the KPIs. And then, it applies the performance data of construction firms to the technique. The findings of this study show that Korean construction firms consider customers to be the foremost priority, converse to previous research which argued that the internal business process was the top priority. The performance measurement results can be fed back into strategies and plans to shed light on issues, reflect on management plans for subsequent years and modify mid to long-term strategies. Therefore, the developed model can help decision-makers effectively revise their management plans.
1. Introduction
As Peter Drucker asserted, the adage “If you cannot measure it, you cannot manage it” is true in all corporate management activities, from manufacturing to IT. Performance measurement is an important management process that can be utilized to identify the fulfillment of annual management plans and provide feedback for subsequent management plans [1]. In the construction industry, performance measurements are complicated, as it is difficult to predict the productivity of projects due to the uncertainty in construction sites and contracting indi vidually [2].
Especially, since Korea’s economy has changed rapidly due to the sharp rise of raw material prices such crude oil, the rapid increase in overseas plant construction contracts from 2004, the Korea construction firms need to be established effectively their management strategies to ensure the competitiveness including various characteristics such as financial and non-financial aspects. In addition, it is necessary to systematically measure management performance in order to investigate whether or not the annual plans are successful.
Traditionally, the management performance was measured in terms of financial aspects, including the current net profit, the investment rate, and the return on equity (ROE) [3]. However, with the increased development of IT in the 1990s, studies on measurement factors and methods began to focus on intellectual resources [4-6]. Meanwhile, in Korea, management performance measurement models for construction firms were developed [6-8]. However, the proposed key performance indicators (KPIs) were insufficient for measuring the non-financial management performances of Korean construction firms [9]. Previous studies did not suggest a systematic scoring method for non-financial factors. Therefore, to effecttively measure management performance, it is essential to develop a performance measurement model that reflects the characteristics of Korean construction firms. In this study, our objective was to develop a management performance evaluation model (MAPEC) for Korean construction firms.
2. Previous Studies
Currently, most corporations focus on financial aspects in their management performance measurements, as these are easy to measure [10]. However, it is difficult to evaluate the long-term potential of a corporation only on the basis of financial aspects. This potential indicates the non-financial aspects such as brand, image, work environment, etc. In other words, although these aspects do not reflect directly the financial factors such as profitability and growth, the aspects influences continuously on the management performance in the long term. Therefore, it is necessary to identify and manage qualitative factors that result in long-term economic value.
Beginning in the 1990s, with the advent of the concept of intellectual resources, many researchers investigated qualitative factors related to management performance measurement. As shown in Table 1, performance measurement indicators of construction project of [11] can be divided into four indicators: project efficiency, impact on customers, business success and preparation for the future. First, in the project efficiency phase, it is measured whether or not the project is completed on time and budget. Second, the satisfaction of customers is measured. Third, in the business success phase, it is measured whether or not the management performance is improved after completion of the project. Fourth, it is measured how reflect the performance to the management for the future.
C. S. Lim, and M. Z. Mohamed evaluated performances such as time, cost quality and safety from both micro and macro viewpoints of developers, contractors, and customers [12]. R. Atkinson measured performance by
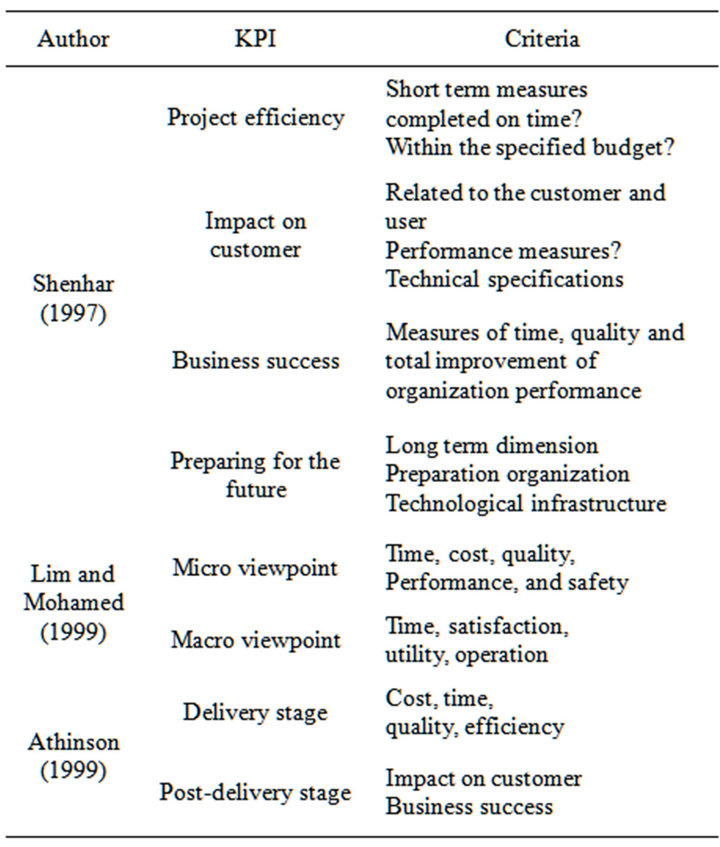
Table 1. Previous literature of KPI [11-13].
dividing it into delivery and post-delivery phases [13]. First, in the delivery stage, the cost, time quality and efficiency is evaluated. Second, after completion of a project, the impact of performance to customers is evaluated. Although many studies have been conducted regarding management performance evaluation, only general indicators show in the studies, which did not consider the characteristics of Korea construction industry.
As an alternative to the traditional approach, [9] proposed a Balanced Scorecard (BSC), which included nonfinancial aspects related to performance evaluation in the long term. The BSC aims for a better understanding of the correct strategies and key performance factors for a more comprehensive insight into current businesses. As shown in Table 2, the BSC is divided into four perspectives (i.e., financial, customer, internal business process and learning and growth). The BSC is appropriate for construction firms since the key performance indicators are defined in consideration of diverse environments such as market customers and culture. In this study, the BSC were applied to determine KPIs for Korean construction firms and then interviewed experts to estimate the weights of each KPI.
In terms of the performance measurement in construction industry, [14] suggested the construction performance measurement process conceptual framework. The framework represents the input and output of the process how to measure the performance as dividing into six perspectives such as financial, customer, internal business, innovation & learning, project, and suppliers. In addition, [15] analyzed the correlation between the change of managerial environment and the business performance of Korea construction firms. Although this study has been conducted regarding the management
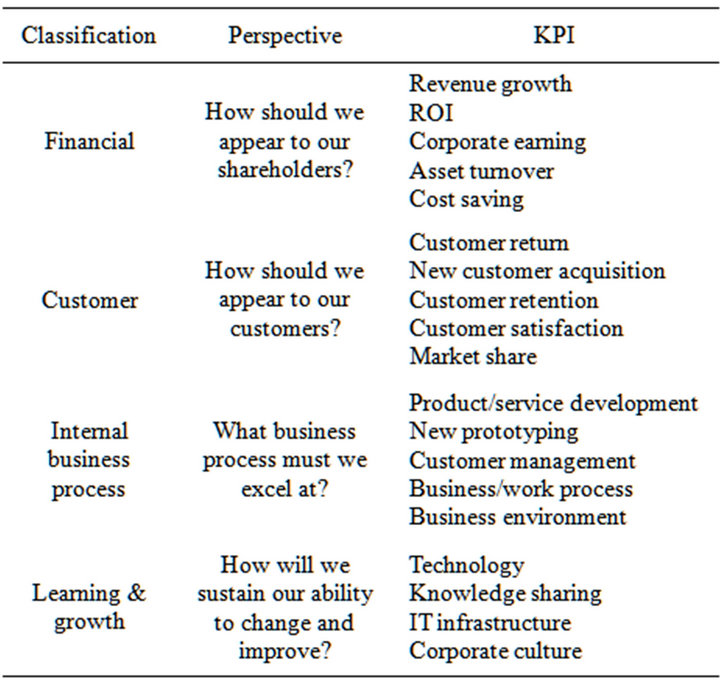
Table 2. Four perspectives of BSC.
performance of Korea construction firms, it did not investigate how to measure the performance. [16] suggest a simulation method to show management effectiveness of various strategies.
3. Methodology
The MAPEC, intended to measure the management performance of Korean construction firms, consists of a hierarchical structure: Balanced scorecard indicator (BSCI) —Classified performance indicators (CPI)—Key performance indicator (KPI) (Figure 1). The collected corporate performance data are reflected in the hierarchical structure at the beginning of the MAPEC process. KPI analysis, which is positioned at the bottom of the hierarchical structure, assigns weights to the actual performance data and estimates the CPI. The CPI analysis then assigns estimated weights to produce a BSCI, and the comprehensive corporate management performance is estimated using the BSCI. Weights for different factors are estimated in a Fuzzy-Delphi Analytic Hierarchy Process (FD-AHP).
To achieve this study’s objective, the following methodology was conducted: 1) CPIs and KPIs were obtained after reviewing previous studies and actual management measurement data; 2) CPIs and KPIs were selected after checking for duplication and omission; 3) according to the selected indicators, a management performance measurement hierarchy was proposed, and the weights of all of the indicators were estimated using an FD-AHP analysis; 4) each KPI score was evaluated by applying the scoring distribution methods proposed in this study; 5) two Korean construction firms were analyzed and evaluated using the MAPEC developed in this study.
It is difficult to develop an effective performance measurement model that encompasses all kinds of construction firms, such as those that design apartments, infrastructure, and plant development projects, as they cater to different customers and require different KPIs and CPIs for performance measurement [17]. Therefore, the scope of this study was limited to model development
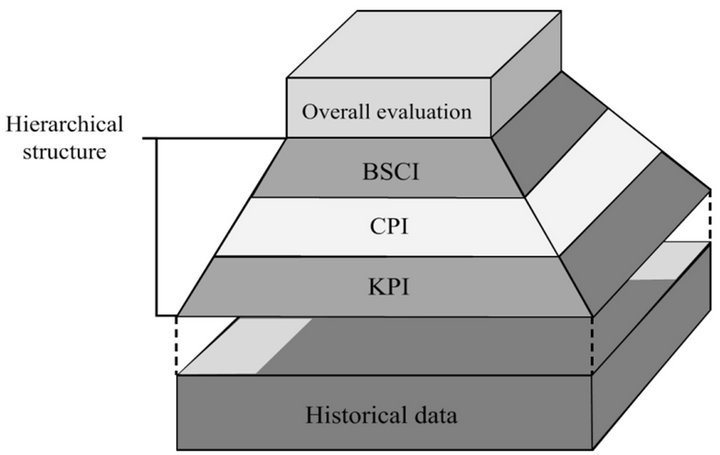
Figure 1. MAPEC concept.
applicable to the top 30 corporations in Korea. Among these corporations, this study focused on firms with both concurrent overseas and domestic projects.
To analyse the experience of experts, Saaty’s Analytic Hierarchy Process (AHP) method has been used widely. However, when the traditional AHP utilizes, the correlation between factors is not considered and the uncertainty and errors would have to determine ranks of factors. The problem such rank reverse may occur. The Fuzzy-Delphi AHP (FD-AHP) method is new decision-making model based on AHP method. In the decision-making issue, by using the pair-wise comparison method, the FD-AHP can determine the optimum alternative among various options [18]. This study utilizes FD-AHP method to establish management performance evaluation model.
4. MAPEC Development
4.1. CPI and KPI
In order to select the CPIs and KPIs, 10 experts were interviewed regarding the performance measurement factors from the top five Korean corporations. As shown in Table 3, among them, three experts are principals of the corporations and two experts are the head of management division. In addition, the rest of experts are the project managers having experience of over 10 years. After interviewing the experts, then the factors were classified and adjusted by the experts.
Based on the CPIs and KPIs, a survey was given to the top management executives in major Korean construction firms, asking for estimations of the weights of each indicator using pair-wise comparison. Table 4 represents the BSCI, CPI, and KPI developed in this study. Finally, 12 CPIs and 31 KPIs were suggested as detailed indicators of the BSCI for Korean construction firms.
4.2. Weight Estimation of BSCI, CPI, and KPI
MAPEC consists of indicators, with weights assigned in
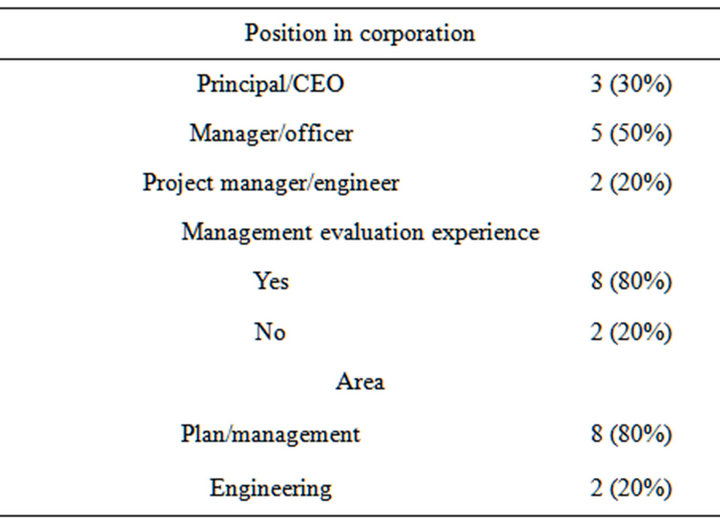
Table 3. Summary of the respondents’ demographic data.

Table 4. BSCI, CPI, and KPI for Korean.
a hierarchical structure. To assign weight for each indicator, interviews were conducted to experts in Korean construction firms using pair-wise comparisons method between indicators. In other words, first, the weight between BSCs indicators was analyzed on the basis of the responses of the interviews. Second, the indicators of CPIs in BSCs were analyzed. Finally, all indicators of KPIs were analyzed by using pair-wise comparisons method.
According to [18], the determinant is calculated as fuzzy vector ( ) using Column Vector Geometric Mean Method. The fuzzy vector calculation result shows a minimum (
 ), arithmetic mean (
 ), maximum value (
 ) and the final weight vector (
 ) estimated using the geometric mean method. In this process, calculation was performed in such a way that the sum of the weights estimated in each phase equaled one. The weights for the BSCIs, CPIs, KPIs calculated by the FD-AHP method are shown in Table 5. In the BSCIs, customer weight was the highest, at 0.34. For the customer CPI, the external customer satisfaction was the highest, at 0.38. For the financial aspects of the BSCI, technological competency in the internal business process, HR development and organizational competency in learning and growth showed the highest weights.
Figure 2(a) shows the BSCI weight analysis. Customers were the most important indicator, followed by Finance. This shows that the paradigm of Korean construction firms is shifting from a financial focus to a customer focus. Figure 2(b) represents the analyzed KPI weights. The amount received from new orders was the most important KPI, followed by the overseas market share rate, the information competency index and the domestic market share rate, which indicates that stakeholders consider order-winning competency and performance to be essential management factors. Order indicator is one of the factors which have not been considered in previous studies. In this study, it was considered to be a major
 (a) (b)
Figure 2. BSCI (a) and KPI (b) weight analysis.

Table 5. Weight for BSC, CPI, and KPI.
indicator reflecting the characteristics of Korean construction firms. As a secondary indicator, the overseas market share rate represents the recent trend in the Korean construction industry to break into the global market.
Although the customer is the most important factor among the BSCIs, the amount received from new orders of the financial in BSCIs represents the most important indicator among the all KPIs. This can be explained from the characteristics between KPIs. Since the amount received from new orders of the financial is possible to quantify directly, the indicator can evaluate precisely from robust data. However, in the case of customer, although the external customer satisfaction in CPIs is the most important factor, since the KPIs in the factor such as awards, satisfaction, company image and social contribution are difficult to quantify the performance; the weights of the KPI level are distributed to the four indicators.
Most research has focused on identification of appropriate indicators for the management environment of the construction industry rather than estimating the importance of suitable indicators for the characteristics of the management of construction firms [10,19,20]. Major research focusing on the BSC was classified into five aspects (i.e., Operational (OP), Benefits (BE), Technology/System (TS), Strategic Competitiveness (SC), and User Orientation (UO) [21-24]). Subsequently, the weight of each indicator was estimated using the AHP method. As a result, the importance was estimated in the order of OP, BE, SC, and UO, which differs from the results of Korean construction firms that emphasize the customer.
4.3. KPI Score Estimation
KPIs can be classified into quantitative indicators, such as the ROIC or debt ratio, as well as qualitative indicators, such as company image or social contribution. Quantitative indicators represent performance in numbers, while qualitative indicators need to be quantified to measure performance. For example, “cost ratio”, “sales growth”, and “market share” can be quantitatively presented, and order amounts, ordinary incomes and training costs can be expressed in monetary terms, while qualitative KPIs such as awards, customer satisfaction and company image cannot be directly numerically provided. Therefore, qualitative indicators need to be quantified for numerical rendering.
It is relatively easy to measure performance using financial aspects. Most of KPIs are associated with their own calculation methods. Domestic sales, overseas sales and debt ratio averages for the previous three years were compared. The rate of cash reception target accomplished was calculated by dividing the cash reception target with the actual cash reception. The target was always 100%. The amount received from new orders is the sum of orders won in a given year and is measured in monetary terms.
The awards, from the customer’s point of view, are the sum of the awards accredited by governmental organizations, mass media, private organizations or overseas entities. Performance may vary, depending on specific awards, but, as the criteria is ambiguous, weights were not assigned. Customer satisfaction is measured by surveying clients and buyers, and company image is measured in terms of the ranks previously determined by professional research firms. As a part of Corporate Social Responsibility (CSR), the social contribution is measured to determine the external customer satisfaction factor among CPIs. The goal of CSR is to embrace responsibility for the company’s actions and encourage a positive impact through its activities on the environment, consumers, employees, communities, stakeholders and all other members of the public sphere who may also be considered as stakeholders [25]. Unlike the CSR, on the basis of donations, scholarships and activities for public benefits, the social contribution does not include production, employment, tax payments or contributions to national development. Lastly, overseas market share is limited to the aggregate overseas markets in which Korean firms are in operation, excluding comparisons with other foreign firms operating under different management conditions.
The R&D cost rate in the internal business process aspect is measured by dividing the current R&D cost with the current sales as shown in Table 6" target="_self"> Table 6. Effectiveness relative to new technology development cost is the aggregation of gains rendered in monetary terms and is estimated from disciplines improved by new technologies developed on each business site, such as quality, cost, schedule, safety or environment. Intellectual property rights measured performance in terms of the aggregation of patents, new technologies and new construction methods held by the applicable corporation in a given year. In addition, compliance to guidelines is measured from surveys, and safety rate is measured using the converted safety rate calculation method.
Valuable resource rate of the learning and growth KPIs is measured in terms of the number of doctoral degrees and professional engineering certificates against the total number of employees. Training cost is measured by dividing the current training cost with the total number of employees as of the end of the current period. Trainee satisfaction and knowledge sharing level are measured using a survey, and the information competency index is determined by utilizing the information index, which is an information competency level measurement model for construction firms.
According to the weights of the scores, the final management performance varies significantly, subject to the range or estimation method of the performance measurement between the KPIs. Therefore, in order to measure balanced management performance in the MAPEC model, it is necessary to adjust the individual KPI evaluation and result calculation. As for the evaluation of the individual KPIs, a scoring interval and evaluation method which assigns 100 evaluation points, with 0 being the lowest for each item is established, and the range of performance measurement per KPI is adjusted and a scoring interval is set up. The adjusted scoring interval prevents the weights from becoming meaningless.

Table 6. Performance evaluation for finance.
To adjust the scoring interval, the bottom limit of the performance is ranged along with the target value. For example, as the rate of the cash reception target accomplished rarely is less than 80%, corporations set their bottom limits to 80% or 85%, reflecting their business characteristics. In addition, as the denominator of the calculation formula for the rate of the cash reception target accomplished is the target value, the target value is always 100%. Therefore, the scoring interval of the rate of the cash reception target accomplished for most corporations can be between 100% - 80%. If a target value is to be designated, a value targeted by a given corporation for the applicable year must be selected. In the case of the amount received from new orders, the target value is the target amount to be received from new orders in the applicable year. The target value and bottom limit, set at the beginning of the year, are criteria for the performance evaluation at the end of the year. If the target value and bottom limit are not set, the scoring interval will be different than the interval in which an actual performance value exists, which may disrupt the balance of the performance evaluation. In the case of the rate of the cash reception target accomplished, if the range where the actual performance value falls is between 100% - 80%, a performance value equal to 90% of the target value can be evaluated as a 50% target accomplishment. However, if there is no scoring interval, it is evaluated as a 90% target accomplishment. Therefore, if the scoring interval is not set, the rate of the cash reception target accomplished is always positively evaluated at 80% or greater, which distorts corporate management performance scores and reduces point variance to such a small value that it renders weighting meaningless.
To evaluate the performance on a scale of 0 - 100 points, this study proposes Equations (1) and (2), which set the target value and bottom limit. Equation (1) is a function applicable to cases where the target value is greater than the bottom limit. Therefore, target value is set as the Max and the bottom limit set as the Min. If the target value is smaller than the bottom limit, as in the case of the debt ratio, Equation (2) is applicable.
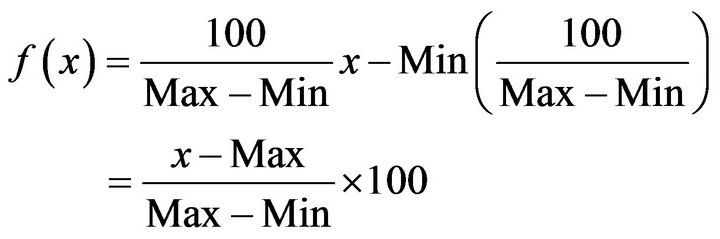 (1)
(1)
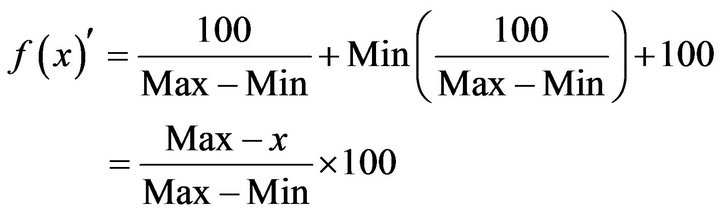 (2)
(2)
whereMax is the greater of the target value and the bottom limit;
Min is the smaller of the target value and the bottom limit;
x is the performance value.
In this study, as the score is calculated by Equations (1) and (2), the scoring interval and distribution in all KPIs are distributed equally between 0 and 100. However, as the actual performance value may exceed the target or fall below the bottom limit. It would not fit within the range of 0 - 100 points. Therefore, if the actual performance value is below 0 or greater than 100 points, it is calculated as 0 and 100 points, accordingly.
5. Case Study
5.1. Overview
To verify the applicability of the MAPEC developed in this study, actual corporate performance values were entered, and performance was evaluated. The two of the 2009 top 30 major construction firms ranked in terms of construction competency were selected. Table 7 shows the profiles of corporation A and B that were selected for this case study. Corporation A has experienced growth for the previous four years. In addition, Corporation A’s construction competency valuation increased from 1.1 trillion won to 1.6 trillion won in 2009, and it posted an operating income of 105.7 billion won in 2008 and 70.6 billion up to the third quarter of 2009, which shows that both the corporation’s growth potential and profitability are high. In other words, Corporation A has been performing fairly positively in terms of the financial aspects. Corporation B is a major construction firm posting 7 trillion won in sales on average in last three years. It posted 8.2 trillion won in construction competency valuation in 2009, and its current net income decreased from 990 billion in 2007 to 80 billion in 2009.
5.2. Practical Application
In order to measure the performances of Corporations A and B against their targets, they were examined in accordance with the criteria applicable to each KPI item, and the weighted KPI scores were calculated as shown in Table 8. The KPI scores were weighted and converted to scores for each performance aspect. The performance aspect scores were then weighted in accordance with criteria specific to each aspect and converted to BSC scores. Comprehensive management performance was calculated by multiplying the BSCI score with the BSCI weight.
Corporation A received 100 points for the 10 KPIs of ROIC, sales growth, amount received from new orders, awards, customer satisfaction, employee turnover, intellectual property rights, safety rights, knowledge sharing level and information competency index. This corporation posted various points, from 0 to 90, for the other KPIs, with an average KPI score of 53.5 points.
Corporation B received 100 points for the 10 KPIs of social contribution, employee turnover, R&D cost rate, intellectual property rights, compliance to guideline, safety rates, valuable resource rates, training costs, knowledge sharing level and information competency
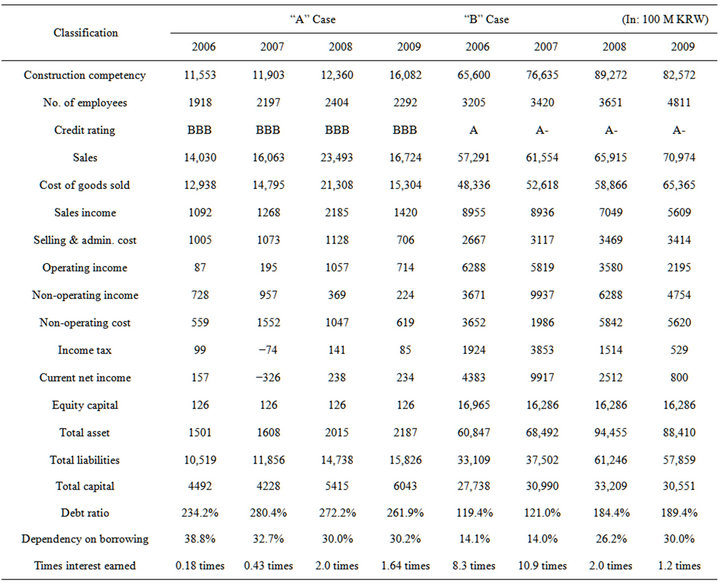
Table 7. Overview of cases.
index (Table 7). For the other KPIs, it posted points in between 0 to 90, with an average score of 67.4 points, which is 8 points higher than Corporation A.
The analysis of the two corporations found that Corporation A received 53.5 points for comprehensive management performance, and B scored 67.4 points. While Corporation A’s average KPI score was 4.4% higher than the comprehensive management performance, Corporation B’s comprehensive management performance was 1.5% higher than its average KPI score, which is attributable to the fact that Corporation B scored higher in the more important items, indicating that it performed better in terms of the more important management items.
In the case of Corporation A, the customer and learning & growth factors in BSCIs represent relatively lower than the Corporation B. Especially, the lower customer factor had impact negatively on overall management performance. Therefore, although the A and B cases are similar in the financial factor, the Corporation A should be adjusted the strategies in the customer and learning & growth factors to improve management performance in the long term. In the case of the Corporation B, since financial factor is lower than the A case, the B should be concentrated on the KPIs of financial factor.
6. Discussion and Conclusions
Most corporations focus on financial indicators, such as current net income, ROI, and ROE, which are easy to measure and capable of showing management performance in quantifiable forms. However, it is difficult to evaluate the potential of a corporation by relying only on the financial aspects in management performance evaluations. Accordingly, this research proposes the MAPEC in an effort to ensure a systematic performance measurement by quantifying the evaluation results of qualitative indicators compatible with the characteristics of the construction industry environment. The results drawn from this research are as follows.

Table 8. “A”, “B” case management performance.
First, as the MAPEC proposed herein applied the FDAHP method to weigh each evaluation item and estimated performance indicators in pair-wise comparison, accurate and systematic management performance measurement results were obtained.
Second, the analysis of the BSCI weights showed that the customer is the most important variable, followed by finance. Thus, major Korean construction firms are shifting their focus from revenue creation to customer service, which reveals a significant difference from the preceding studies, which emphasized operational levels (Document transfer and handling, Coordination and communication, Response times, Support alliance relationships, Decision making, Reporting).
Third, the analysis of the KPI weights showed that the amount received from new orders is the most important KPI, followed by overseas market share, information competency index, and domestic market share. This indicates those with hands-on responsibility for corporate management regard order-winning capabilities and performance as important management factors.
Fourth, a management performance measurement model for Korean construction firms was developed and actual management planning, execution and feedback processes were analyzed. In addition, preceding studies introduced the BSC and focused only on its concept, which resulted in errors and mistakes in its actual application. This model, however, presents a generic process to be followed, allowing Korean construction firms to apply the model to their actual operations.
This research used a survey to confirm that the management of Korean construction firms believes that customer satisfaction and brand image have more impact on their corporate management than did management performance in terms of financial statements. In addition, the MAPEC proposed herein not only assigns weights appropriate for the Korean construction industry environment, but also suggests further details relevant to management performance, including KPI selection and evaluation methods, delivering a close-to-standard management performance measurement model for construction firms.
The performance measurement model developed herein can be utilized when analyzing the cause of deficiency (vulnerability) for each BSCI-CPI-KPI item beyond a simple measurement of the management performance of each corporation. In other words, the performance measurement results can be fed back into strategies and plan to shed light on issues, reflect on management plans for subsequent years and modify mid to long-term strategies. Furthermore, the model implementation process suggested herein can be applied to the implementation of management performance measurement models not only for other big corporations, but also small and medium-sized construction firms.
Although this research proposes KPIs appropriate for Korean construction firms, it did not consider the complex and dynamic interrelationships among different KPIs. Therefore, it is necessary to analyze and systematically substantiate the dynamic relationships that influence different KPIs.
REFERENCES
- P. F. Drucker, “The Information Executives Truly Need,” Harvard Business Review, Vol. 73, No. 1, 1995, pp. 54- 62.
- E. K. Zavadskas, Z. Turskis and J. Tamosaitiene, “Risk Assessment of Construction Projects,” Journal of Civil Engineering and Management, Vol. 16, No. 1, 2010, pp. 33-46. doi:10.3846/jcem.2010.03
- C. D. Ittner and D. F. Larcker, “Innovations in Performance Measurement: Trends and Research Implications,” Journal of Management Accounting Research, Vol. 10, No. 2004, pp. 205-238.
- R. F. Cox, R. R. A. Issa and D. Ahren, “Management’s Perception of Key Performance Indicators for Construction,” Journal of Construction Engineering and Management, Vol. 129, No. 2, 2003, pp. 142-151. doi:10.1061/(ASCE)0733-9364(2003)129:2(142)
- M. Kagioglou, R. Cooper and G. Aouad, “Performance Management in Construction: A Conceptual Framework,” Construction Management and Economics, Vol. 19, No. 2001, pp. 93-106.
- H. S. Cha and T. K. Kim, “Developing Measurement System for Key Performance Indicators on Building Construction Projects,” Korea Institute of Construction Engineering and Management, Vol. 9, No. 4, 2008, pp. 120- 131.
- I. H. Yu, K. R. Kim, Y. Jung and S. Chin, “Analysis of Quantified Characteristics of the Performance Indicators for Construction Companies,” Korea Institute of Construction Engineering and Management, Vol. 7, No. 4, 2006, pp. 154-164.
- K. H. Kim, I. H. Yu, D. W. Shin and K.R. Kim, “Evaluation of Performance Measurement System Alternatives for the Construction Companies,” Architectural Institute of Korea, Vol. 21, No. 6, 2005, pp. 97-105.
- R. S. Kaplan and D. P. Norton, “The Balanced Scorecard—Measures That Drive Performance,” Harvard Business Review, Vol. 70, No. 1, 1992, pp. 71-79.
- W. J. Jung, I. H. Yu, K. R. Kim and D. W. Shin, “Analysis of the Weights of Performance Measurement Index According to the Size of Construction Companies,” Architectural Institute of Korea, Vol. 21, No. 8, 2005, pp. 121-129.
- A. J. Shrnhur, O. Levy and D. Dvir, “Mapping the Dimensions of Project Success,” Project Management Journal, Vol. 28, No. 2, 1997, pp. 5-13.
- C. S. Lim and M. Z. Mohamed, “Criteria of Project Success and Exploratory Re-Examination,” International Journal of Project Management, Vol. 17, No. 4, 1999, pp. 243- 248. doi:10.1016/S0263-7863(98)00040-4
- R. Atkinson, “Project Management: Cost, Time and Quality, Two Best Guesses and a Phenomenon, Its Time to Accept Other Success Criteria,” International Journal of Project Management, Vol. 17, No. 6, 1999, pp. 337-342. doi:10.1016/S0263-7863(98)00069-6
- M. Kagioglou, R. Cooper and G. Aouad, “Performance Management in Construction: A Conceptual Framework,” Construction Management and Economics, Vol. 19, No. 1, 2001, pp. 85-95. doi:10.1080/01446190010003425
- D. H. Lee, S. K. Kim and D. H. Shin, “A Correlation Analysis between the Change of Managerial Environment and the Business Performance of Domestic Construction Firms.” Journal of the Korea Institute of Building Construction, Vol. 9, No. 1, 2009, pp. 111-121. doi:10.5345/JKIC.2009.9.1.111
- S. O. Ogunlana1, H. Li and F. A. Sukhera, “System Dynamics Approach to Exploring Performance Enhancement in a Construction Organization,” Journal of Construction Engineering and Management, Vol. 129, No. 5, 2003, pp. 528-536. doi:10.1061/(ASCE)0733-9364(2003)129:5(528)
- A. Brown and J. Adams, “Measuring the Effect of Project Management on Construction Outpus: A New Approach,” International Journal of Project Management, Vol. 18, No. 5, 2000, pp. 327-335.
- Y. C. Liu, “Application of the Fuzzy Delphi Analytic Hierarchy Process on Rock Mass Classification,” National Cheng Kung University, Tainan City, 2002.
- H. A. Bassioni, A. D. F. Price and T. M. Hassan, “Building a Conceptual Framework for Measuring Business Performance in Construction: An Empirical Evaluation,” Construction Management and Economics, Vol. 23, No. 5, 2005, pp. 495-507.
- S. H. Chen and H. T. Lee, “Performance Evaluation Model for Project Managers Using Managerial Practices,” International Journal of Project Management, Vol. 25, No. 6, 2007, pp. 543-551.
- C. Chiu, “A Case-Based Customer Classification Approach for Direct Marketing,” Expert Systems with Application, Vol. 22, No. 2, 2002, pp. 163-168.
- V. T. Luu, S. Y. Kim and T. A. Huynh, “Improving Project Management Performance of Large Contractors Using Benchmarking Approach,” International Journal of Project Management, Vol. 26, No. 7, 2008, pp. 758-769.
- R. A. Stewart and S. Mohamed, “Utilizing the Balanced Scorecard for IT/IS Performance Evaluation in Construction,” Construction Innovation, Vol. 1, No. 3, 2001, pp. 147-163.
- N. K. Acharya, Y. D. Lee and J. K. Kim, “Critical Construction Conflicting Factors Identification Using Analytical Hierachy Process,” KSCE Journal of Civil Engineering, Vol. 10, No. 3, 2006, pp. 165-174. doi:10.1007/BF02824057
- D. Wood, “Corporate Social Performance Revisited,” The Academy of Management Review, Vol. 16, No. 4, 1991, pp. 34-42.