Open Journal of Statistics
Vol.07 No.06(2017), Article ID:80814,16 pages
10.4236/ojs.2017.76064
A Neighborhood Analysis of Underage Tobacco Sales within the Serving Area of a Canadian Public Health Unit
Saber Fallahpour1*, Tanya Navaneelan1, Kristy McBeth2, Prithwish De1
1Surveillance and Cancer Registry, Cancer Care Ontario, Toronto, Canada
2Knowledge Management, Windsor-Essex County Health Unit, Windsor, Canada
Email: *fallahp@uwindsor.ca
Copyright © 2017 by authors and Scientific Research Publishing Inc.
This work is licensed under the Creative Commons Attribution International License (CC BY 4.0).
http://creativecommons.org/licenses/by/4.0/


Received: September 23, 2017; Accepted: November 28, 2017; Published: December 1, 2017
ABSTRACT
Despite the fact that the sale of tobacco to minors is illegal in Ontario, youth are still able to purchase tobacco. This study aims to determine the geographic variations of underage tobacco sales at the neighborhood level within the Windsor-Essex County Health Unit. Data were collected on all inspections of tobacco retail stores from 2007 to 2011 in the Windsor-Essex County Health Unit. Data were split into season 1 (September-February) and season 2 (March-August) to assess a possible seasonal effect. Relative risks were calculated for each dissemination area (DA) by modeling the risks in a hierarchical Bayesian fashion, incorporating appropriate random effects terms for both spatially correlated and uncorrelated random errors with adjustments for neighborhood income. The association between violation rate and proximity to a school was assessed through a buffer analysis. Elliptical analysis detected a significant cluster of high risk DAs in season 1 in Windsor (p-value = 0.022) but no significant cluster in season 2. Some DAs exhibited higher relative risks of tobacco sales to minors, however after adjusting the model for neighborhood income no excess risk was observed. The results of the buffer analysis showed that in season 1 there was a significantly higher probability (p-value = 0.045) of tobacco vendors located closer to schools to sell tobacco to minors. This analysis demonstrates the utility of a systematic approach to identifying neighborhoods with higher risks of tobacco sales to minors. The insights provided by this exploratory, ecologic study are valuable for program planning and directing tobacco enforcement efforts to high risk areas.
Keywords:
Tobacco, Dissemination Area, Bayesian Disease Mapping, Cluster, Buffer Analysis

1. Introduction
Adolescent tobacco use continues to be a serious problem. Most tobacco users become addicted while still under the legal age to purchase tobacco products [1] . Decades of research have identified significant individual and social-level predictors of tobacco use. However, ecological influences have only recently been explored. Recent advancements in software programs that use geographic information systems (GIS) technology have provided the necessary tools for innovative exploratory analyses of ecological influences on tobacco use.
In January 2012, Ontario’s Action Plan for Health Care, was released as part of the government’s Healthy Change Strategy. The Action Plan identifies the Smoke Free Ontario (SFO) strategy as a priority for keeping Ontario healthy. A key tactic towards one of the goals of the SFO strategy, the prevention of experimentation and escalation of tobacco use among youth and young adults, are Ministry directed tobacco vendor compliance checks. Under this directive, Public Health Units in Ontario are mandated to conduct a minimum of two inspections annually on each tobacco vendor in accordance with the Ministry’s Enforcement Directives [2] .
It has been illegal to sell or supply a tobacco product to a person under the age of 19 in Ontario (youth access) since 1994. Enforcement of the youth access restriction has been ongoing since then, yet communities in Ontario are still seeing sales of tobacco to minors. The historical youth access enforcement procedure (test shopping―sending an underage youth into a tobacco vendor to attempt the purchase of a tobacco product) has been standard operating procedure. There is currently no provincial system that distinguishes between tobacco vendors based on risk, location, or other factors. Despite the ongoing debate questioning the utility and validity of the compliance checks [3] [4] , many researchers believe that compliance checks remain one of the most effective ways to reduce access to tobacco and lower the prevalence of smoking among young people [5] [6] .
In 2012, the tobacco enforcement team at the Windsor Essex County Health Unit (WEHCU) began to look at the process and methodology behind test shopping in the community. The annual compliance rate had shown very little fluctuation from year to year (around 95.5%) despite new educational interventions aimed to reduce the likelihood of retailers selling tobacco to minors.
This study was undertaken to identify a relationship between tobacco vendor compliance rates and proximity to schools. Anecdotally, it was believed that that there was a higher likelihood for tobacco vendors who were situated within walking distance of a school to sell to minors. Additionally, there was interest in exploring the relationship that vendor compliance had with income levels.
The goal was to identify “high risk” vendors, which could then be targeted through a risk-based strategy. High risk vendor status would be determined by a few key factors, if the relationship could be established:
・ proximity to schools―closer to school equals higher risk
・ income levels of geographic area―lower income neighbourhoods equal higher risk
This use of risk-based categorization strategies is not a new concept in the field of public health. The Public Health Food Safety programs in Ontario employ programs based on the Risk Categorization Model for Food Retail/Food Service Establishments [7] . Other studies involving tobacco vendors, have also been conducted in other Ontario Public Health Units [8] . These studies have also used the concept of risk categories for tobacco vendors that include low, moderate, and high risk establishments.
2. Study Location
Essex County is located in south western Ontario, Canada. Essex County is 1850.78 square kilometers in size, with a 2011 population of 388,782. The county encompasses various municipalities; Essex, Leamington, Kingsville, Amhertsburg, Lakeshore, Tecumseh, Pelee, LaSalle, and the largest Windsor, which had a population of 210,891 in 2011 (Figure 1). 73% of the population, reports a European ethnic background, 28% reports a North American background (e.g.,

Figure 1. Essex County and the Municipalities.
Canadian, Québécois), 13% reports an Asian background (this includes Middle Eastern, West-Central, South, East, and Southeast Asian), 4% reports a North American Aboriginal background, and 2% of people report an African background (a person may report more than one ethnic origin) [9] . Fifteen percent of individuals within Essex County report that they are a visible minority.
3. Methodology
3.1. Data Source
The WECHU has collected data on unannounced inspections of all outlets in Essex County from 2007-2011. The data include details on name of retailer, date of inspection, and a full address of the retailor. However, no information on gender, age and, ethnicity of either the tobacco vendor or the decoys was collected during the inspections. The address of Essex County secondary schools were also used to identify the proximity of sales to school locations. These data were collected from the School Health department at WECHU. There were no missing addresses in both the school and tobacco vendors’ data sets and all the addresses were successfully geocoded.
The geographic boundary files used for the analysis in this project are shape files of 2006 Canada census dissemination areas [10] [11] . A dissemination area (DA) is the smallest standard geographic area for which all census data are disseminated and is composed of one or more neighboring dissemination blocks, with a population of 400 to 700 persons. These boundary files were obtained from the Statistics Canada and were used within the Rapid Inquiry Facility (RIF) Version 3.2 [12] to characterize and visualize the areas of interest. Statistics Canada classifies Canadian geography using two systems; the Standard Geographic Classification (SGC) and the Statistical Area Classification (SAC) [13] . The SGC is a hierarchical classification that breaks down provinces and territories into census divisions (CDs), CDs into census subdivisions (CSDs), and CSDs into DAs. The SAC is also used for data dissemination purposes and breaks down urbanized areas of Canada into census metropolitan areas (CMAs), census agglomeration areas (CAs), census tracts (CTs) and DAs.
Average household income data from the 2006 Canadian Census was used for covariate adjustment. Income per person equivalent (IPPE) is a household size- adjusted measure of household income at the census DA level. The DA average IPPE was used to rank all DAs nationally and within the local census metropolitan area (CMA), the population was then divided into approximate fifths to create community-specific income quintiles (QAIPPE) based on IPPE. Throughout the study we label the QAIPPE as the socio-economic status (SES). The majority of DAs with low SES (QAIPPE = 1, 2) were located in Windsor and Leamington.
3.2. Data Processing
Entries with street address, city, and zip code in the database provided by tobacco department and school health team were geocoded using ArcGIS Desktop version 10.0 [14] . Geocoding is the process of finding associated geographic coordinates (latitude and longitude) of a place using other geographic data, such as street addresses or postal codes. Numbers of inspections as well as violations were counted per DA.
The Rapid Inquiry Facility (RIF) Version 3.2, developed by the Small Area Health Statistics Unit at Imperial College London, a novel extension to ArcGIS Desktop, was used to estimate the smoothed RRs using BYM model. This package is designed for disease mapping and for risk analysis related to environmental hazards and it has been programmed to be database independent. All the geographical boundaries are defined during the creation of the RIF database, which can be in either Microsoft Access or Oracle. Moreover, the RIF Version 3.2 interfaces with WinBUGS [15] and INLA to provide smoothed estimates of Bayesian hierarchical modeling [16] [17] using MCMC and INLA algorithm. Moreover, RIF interfaces with SaTScan to identify and detect clusters. In our analysis, we used the RIF interface with INLA and SaTScan to estimate smoothed RRs using BYM model and detect significant clusters in Essex County (Figure 2).

Figure 2. Essex County neighborhood income at the DA level.
3.3. Estimation of Small Area Relative Risk
The population data was the total number of inspections during 2007-2011 in Essex County and the number of violations ( ) per DA was assumed to follow Poisson distribution with mean
(1)
where is the expected cases in ith DA obtained by indirect standardization, and is the ith DA relative risk (RR) of underage tobacco sale. The Essex County as a whole was considered as the comparison area to calculate RRs and since no information on vendors’ sex and age was collected, the rates were not sex and age adjusted. The maximum likelihood estimate of known as the Standardized Incidence Ratio (SIR) is . However, in small populations with small numbers of expected and observed counts, the SIR estimates will be unstable and unreliable. To overcome this problem, a spatial random effect model was specified.
The most commonly used model which takes into account both extra Poisson variability and spatial correlation is the Besag-York-Mollié (BYM) [18] model which is defined as follows
(2)
This model uses Poisson’s generalized linear mixed model with two random effects, one spatially structured ( ) and one unstructured ( ), to estimate the RRs. The smoothed RR estimates will be obtained in a fully Bayesian modeling with the following specifications:
A flat prior distribution is assigned to the intercept; , a normal distribution for the unstructured random effect: , an intrinsic conditional autoregressive (CAR) model for the spatially structured random effect which uses a neighborhood structure based on adjacency: , where and indicates adjacency of area i and j. It should be noted that where additional fixed covariates (e.g. neighbourhood income quintiles) are included in the model; these are subsumed in the E[i] term.
Finally, prior distributions were assigned to the hyper-parameters: .
The smoothed RR estimate for each area was calculated as the mean of the posterior distribution for each area, along with the posterior probability of each area having above average risk (i.e., RR > 1). The posterior distribution was obtained using the Integrated Nested Laplace Algorithm (INLA) [19] .
Markov chain Monte Carlo (MCMC) algorithm is the standard and most commonly used technique for making inference in hierarchical Bayesian models, which sometimes requires hours to do the computation due to highly correlated samples. The main advantage of INLA over MCMC is that it is much faster in computation [20] . Cluster analysis was also performed using the package SaTScan v9.1.1 [21] to corroborate the results from the BYM model.
Based on consolations with tobacco department experts, the data was split into two separate time intervals to include a seasonal effect on underage youth tobacco sale RRs. Season 1 contained inspections conducted between the beginning of September and the end of February and Season 2 from the beginning of March to the end of August. All analyses were done separately for each season to see if a seasonal pattern in RRs and clusters existed. Furthermore, to examine the effect of school contiguity to vendors’ violations, a 1.5 km buffer was created around each school and the rate of violation within and outside the buffer was assessed separately for each season.
4. Findings
4.1. Descriptive Results
As previously mentioned, separate analysis was done per season. In total 1755 inspections were done in season 1 and 1850 inspections were done in season 2, out of which 85 and 78 violations were detected respectively. The number of inspections and violations per municipality are presented in Table 1.
As expected most cases occurred in Windsor, the most populous city in the Essex County. We excluded Pelee from the analysis as no violations occurred there from 2007 to 2011.
Maps of DAs with the lowest and second lowest SES along with the violation locations are shown in Figure 3 and Figure 4. The majority of these DAs were located in Windsor and Leamington. Through visualization alone, it appeared that the poorer neighborhoods hosted most of the violations. In fact, 63% of the violations in season 1 (54 out of 85) and 96% of the violations in season 2 (74 out of 77) occurred in DAs in the lowest and second lowest income quintile.
4.2. Elliptical Analysis
As an initial step the raw SIRs (with no smoothing effect) per DA were calculated

Table 1. Number of inspections and violations in both seasons in different municipalities.

Figure 3. DAs with lowest and second lowest income quintile (shaded areas) and violations in season 1.

Figure 4. DAs with lowest and second lowest income quintile (shaded areas) and violations in season 2.
and elliptical analysis was utilized to see whether or not there was a significant cluster in both seasons, i.e., to detect areas of significantly high or low rates of violation and to test whether violations were randomly distributed over the region. Essex County is divided into 654 DAs of which some have no records of inspection as there was no tobacco vender in that DA.
At the significance level of 0.05, based on calculated SIRs, no significant cluster was detected in Essex County in season 1, whereas in season 2, one significant cluster with a p-value of 0.022 was detected in Windsor. The magnitude and direction of the cluster is displayed in Figure 5. A visual inspection of the cluster suggests a tendency for violations to occur in the central Windsor (area indicated). This area ranges from South Windsor to downtown, with more violations focused in the downtown area.
4.3. Bayesian Modelling
For the next step, the smoothed RR of underage tobacco sales using a BYM model in two seasons for all DAs were calculated. The posterior probability (pp) of an excess risk (Pr [RR > 1 | data]) associated with the smoothed RR was also calculated. A relative risk of 1 represents the average risk of the Essex County as the comparison population and DAs with RR > 1 and posterior probability ≥ 0.80 are DAs where we are at least 80% confident of an excess relative risk.
In season 1, the RRs ranged from RR = 0 to RR = 1.55. Higher risk was associated with 53 DAs in the county (31 DAs with pp = 0.80 - 0.89; five DAs with pp = 0.90 - 0.94; and 17 DAs with pp > 0.95) with Windsor accounting for the ma-

Figure 5. DAs identified as a potential cluster (shaded areas) in season 2 along with violation locations within the cluster.
jority (more than 65% of high risk DAs) followed by Leamington with 19%.
Out of the 53 DAs identified as having an increased risk of underage tobacco sales in Season 1, 42 were in the lowest or second lowest income quintiles, 5 were in the middle and upper middle quintile and 6 were in the highest income quintile. After adjusting for SES no excess risk was observed in DAs. The variability in these RR estimates seems to be explained by SES, suggesting that this variable has important explanatory value in interpreting RR of underage tobacco sale at this geographical level. Results are shown cartographically in Figure 6 and Figure 7. The dotted areas in these figures are DAs with no tobacco vendors; therefore, no inspection data was available.
In Season 2, the RRs ranged from RR = 0 to RR = 1.75. Higher risk was associated with 41 DAs in the County (10 DAs with pp = 0.80 - 0.89; 16 DAs with pp = 0.90 - 0.94; and 15 DAs with pp > 0.95) with Windsor accounting for the majority of high risk DAs (more than 73% of DAs with exceedance probabilities ≥ 0.80), followed by Leamington with 16%.
Out of the 41 DAs identified as having an increased risk of underage tobacco sales in season 2, 30 were in the lowest and second lowest income quintiles, 7 were in the middle and upper middle quintiles and were in the highest income quintile. As with season 1, after adjusting for SES no excess risk was observed in DAs in this season as well (see Figure 8 and Figure 9). High risk DAs in Windsor in season 2 were mainly located in the central Windsor area. The elliptical SaTScan analysis corroborated this finding with detection of a statistically sig-
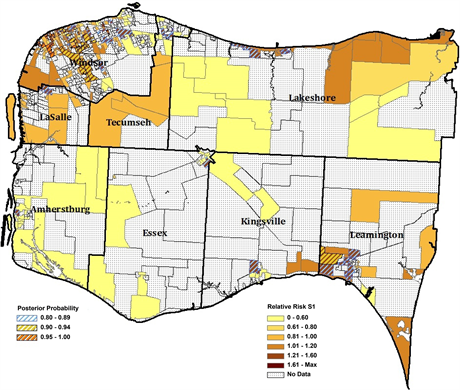
Figure 6. Relative Risk of Tobacco violation incidence 2007-2011, Essex County, full Bayesian smoothing, by 2006 DA―Season 1.

Figure 7. Relative Risk of Tobacco violation incidence 2007-2011, Essex County, full Bayesian smoothing and adjusted for average household income quintiles, by 2006 DA―Season 1.

Figure 8. Relative Risk of Tobacco violation incidence 2007-2011, Essex County, full Bayesian smoothing, by 2006 DA―Season 2.
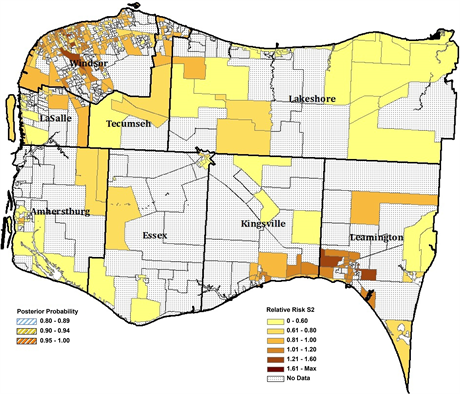
Figure 9. Relative Risk of Tobacco violation incidence 2007-2011, Essex County, full Bayesian smoothing and adjusted for average household income quintiles, by 2006 DA―Season 2.
nificant cluster of 19 contiguous DAs.
4.4. Buffer Analysis
Based on our findings that the majority of high risk DAs in both seasons were located in Windsor and Leamington, we further assessed the association between violations and proximity to the nearest school in these two municipalities, with the following mutually exclusive buffer categories: 1) within 1.5 km of a school and 2) more than 1.5 km from a school. Equality of the proportion of violations within and beyond 1.5 km of school property for each season was tested using a chi-square test of homogeneity.
The rate for each buffer zone (<1.5 km and >1.5 km from schools property) was defined as the number of violations divided by the total number of inspections. For example the rate of violation within 1.5 km of schools is the number of violations that occurred within 1.5 km of a school divided by the total inspections made within that buffer. The same definition was applied for calculating the rate of violation for the >1.5 km buffer.
A chi-square test of homogeneity for equality of rates for both seasons was performed. In season 1 the p-value was 0.045 which indicates that the two proportions are significantly different at the significance level of 0.05. As shown in Table 2, there was a higher rate of violation in sellers less than 1.5 km from the nearest school. However, in season 2, the difference in rates was not significant
Table 2. Rate of violation two buffer zones in both seasons.
*Significant at 0.05.
(p-value = 0.60).
5. Discussion
This analysis identified a few key factors that should help better implement tobacco test shopping programs. In season 1 (during the school year), there was a significantly higher probability for tobacco vendors located within 1.5 km of a school to make an illegal sale of tobacco to a minor (in comparison to those located further from a school). The same probability however, did not occur in season 2 (during the summer). In addition, vendors in areas with lower SES levels were more likely to sell tobacco to minors. The combination of these findings can be used to refine test shopping strategies to help target high risk vendors.
5.1. Creating a Targeted Strategy
Previous research has shown that the primary source of cigarettes for youth is other youth who purchase cigarettes and that disrupting the purchasing of cigarettes by youth results in a decline in smoking among youth [22] . Historically, most public health units have approached the SFO program through a regional perspective, which may have saved on time and costs, but does not include a strategy for increasing compliance rates by targeting high risk areas. By creating a list of high risk vendors (determined by their proximity to schools and income areas) and increasing or only test shopping these vendors in season 1 it may be possible to engage in a targeted strategy to uncover chronic violations. The prospective end result is positive behaviour change by tobacco vendors as a result of increased consequences and greater educational intervention, which has been shown to help reduce the number of tobacco sales to youth [23] . This will hopefully result in lower smoking rates among youth, as studies have shown that violation rates among retailers are significantly associated with smoking rates among youth [24] .
While our findings found that vendors located closer to schools had higher violation rates, previous research has found that tobacco vendors proximity to school was not associated with higher smoking prevalence while the density of vendors was associated [25] . Further research may want to include an assessment of the density of retailers to further refine high risk areas. Most other geography based analysis of tobacco sales to minors did not include a measure of income level. Our finding however, of increased violations in areas of lower SES is consistent with previous findings that Canadian youth from lower SES levels are more likely to take up smoking [26] .
5.2. Limitations of the Study
This analysis did not stratify by the type of vendor (e.g. convenience store, gas station, etc.). Previous studies have found differences in the likelihood of selling tobacco products to minors by the type of vendor [27] [28] . This study also did not account for the demographics of the vendors or shoppers, while previous work has found that this may impact the likelihood of sales to minors [28] .
6. Conclusion
Overall, the results of this study provide valuable insights and directions into multiple areas of the SFO strategy for more effective local implementations. As youth anti-smoking efforts work in an environment of limited resources and increasing demand, it is important to better plan the deployment of resources into the community areas that are in greatest need. If public health units are successful at directing their enforcement focus to high risk and higher offence rate vendors they will be better able to isolate areas in need of prevention and cessation programming.
Acknowledgements
The authors acknowledge the tobacco enforcement and information technology teams at the Windsor-Essex County Health Unit for providing the data. The authors also acknowledge Todd Norwood of the Cancer Surveillance Research unit of Cancer Care Ontario and Federico Fabbri of the Small Area Health Statistics Unit of Imperial College London for their technical guidance. The authors acknowledge the U.S. Centers for Disease Control and Prevention for providing access to the RIF package. The authors also acknowledge Cancer Care Ontario (CCO) Research Office that provided us funding to assist with the publication fees.
Cite this paper
Fallahpour, S., Navaneelan, T., McBeth, K. and De, P. (2017) A Neighborhood Analysis of Underage Tobacco Sales within the Serving Area of a Canadian Public Health Unit. Open Journal of Statistics, 7, 920-935. https://doi.org/10.4236/ojs.2017.76064
References
- 1. Institute of Medicine (2015) Public Health Implications of Raising the Minimum age of Legal Access to Tobacco Products. The National Academies Press, Washington DC.
- 2. Ontario Ministry of Health Promotion (2006) Protocol for Determination of Tobacco Vendor Compliance. Ontario Ministry of Health Promotion, Ontario.
- 3. Fichtenberg, C.M. and Glantz, S.A. (2002) Youth Access Interventions Do Not Affect Youth Smoking. Pediatrics, 109, 1088-1092. https://doi.org/10.1542/peds.109.6.1088
- 4. Ling, P.M., Landman, A. and Glantz, S.A. (2002) It Is Time to Abandon Youth Access Tobacco Programmes? Tobacco Control, 11, 3-6. https://doi.org/10.1136/tc.11.1.3
- 5. Di Franza, J.R. (2005) Restricted Access to Tobacco Reduces Smoking Rates among Youth. In: Owing, J.H., Ed., Focus on Smoking and Health Research. Nova Science: Hauppauge, New York.
- 6. Pearson, D.C., Song, L., Valdez, R.B. and Angulo, A.S. (2007) Youth Tobacco Sales in a Metropolitan County: Factors Associated with Compliance. American Journal of Preventive Medicine, 33, 91-97. https://doi.org/10.1016/j.amepre.2007.04.010
- 7. Federal/Provincial/Territorial Committee on Food Safety Policy (2007) Risk Categorization Model for Food Retail/Food Service Establishments.2nd Edition, Health Canada, Ottawa.
- 8. Ontario Tobacco Research Unit (2012) Evaluation of the Risk-Based Enforcement Pilot: A Risk Categorization Model for Youth Access to Tobacco Interim Report. Ontario Tobacco Research Unit, Toronto.
- 9. Statistics Canada (2013) Essex, CTY, Ontario (Code 3537) (Table). National Household Survey (NHS) Profile. 2011 National Household Survey. Statistics Canada Catalogue no. 99-004-XWE. Released June 26, 2013, Ottawa. http://www12.statcan.gc.ca/nhs-enm/2011/dp-pd/prof/index.cfm?Lang=E
- 10. Statistics Canada (2012) Windsor, Ontario (Code 3537039) and Essex, Ontario (Code 3537) (Table). Census Profile. 2011 Census. Statistics Canada Catalogue No. 98-316-XWE, 2012. http://www12.statcan.gc.ca/census-recensement/2011/dp-pd/prof/index.cfm?Lang=E
- 11. Rapid Inquiry Facility. http://www.sahsu.org/content/rapid-inquiry-facility
- 12. Statistics Canada (2011) Standard Geographical Classification: Introduction to the Classification. http://www.statcan.gc.ca/subjects-sujets/standard-norme/sgc-cgt/2011/sgc-cgt-intro-eng.htm
- 13. ESRI (2010) ArcGIS Desktop. Version 10.0.
- 14. Spiegelhalter, D., Thomas, A., Best, N. and Lunn, D. (2003) WinBUGs User Manual Version 1.4.
- 15. Mollie, A. (1996) Bayesian Mapping of Disease. In: Gilks, W., Richardson, S. and Spiegelhalter, D., Eds., Markov Chain Monte Carlo in Practice, Chapman & Hall, Boca Raton.
- 16. Lawson, A.B. (2008) Bayesian Disease Mapping: Hierarchical Modeling in Spatial Epidemiology. Taylor & Francis, Boca Raton. https://doi.org/10.1201/9781584888413
- 17. Besag, J., York, J. and Mollie, A. (1991) Bayesian Image Restoration, with Two Applications in Spatial Statistics. Annals of the Institute of Statistical Mathematics, 43, 1-59. https://doi.org/10.1007/BF00116466
- 18. Implementing Approximate Bayesian Inference using Integrated Nested Laplace Approximation: A Manual for the INLA Program. http://www.math.ntnu.no/~hrue/GMRFsim/manual.pdf
- 19. Rue, H., Martino, S. and Chopin, N. (2007) Approximate Bayesian Inference for Latent Gaussian Models Using Integrated Nested Laplace Approximations—Statistics Report No. 1. Department of Mathematical Sciences, Norwegian University of Science and Technology, Trondheim.
- 20. Kulldorff, M., Huang, L., Pickle, L.W. and Duczmal, L. (2006) An Elliptic Spatial Scan Statistic. Statistics in Medicine, 25, 3929-3943. https://doi.org/10.1002/sim.2490
- 21. DiFranza, J.R. (2012) Which Interventions against the Sale of Tobacco to Minors Can Be Expected to Reduce Smoking? Tobacco Control, 221, 436-442. https://doi.org/10.1136/tobaccocontrol-2011-050145
- 22. Stead, L.F. and Lancaster, T. (2002) Interventions for Preventing Tobacco Sales to Minors. The Cochrane Database of Systematic Reviews, No. 1, CD001497.
- 23. Spivak, A.L. and Monnat, S.M. (2015) Prohibiting Juvenile Access to Tobacco: Violation Rates, Cigarette Sales and Youth Smoking. International Journal of Drug Policy, 26, 851-859. https://doi.org/10.1016/j.drugpo.2015.03.006
- 24. Henriksen, L., Feighery, E.C., Schleicher, N.C., Cowling, D.W., Kline, R.S. and Fortmann, S.P. (2008) Is Adolescent Smoking Related to the Density and Proximity of Tobacco Outlets and Retail Cigarette Advertising near Schools. Preventive Medicine, 47, 210-214. https://doi.org/10.1016/j.ypmed.2008.04.008
- 25. Wellman, R.J., Dugas, E.N., Dutczak, H., O’Loughlin, E.K., Datta, G.D., Lauson, B. and O’Loughlin, L. (2016) Predictors of the Onset of Cigarette Smoking: A Systematic Review of Longitudinal Population-Based Studies in Youth. American Journal of Preventive Medicine. https://doi.org/10.1016/j.amepre.2016.04.003
- 26. Pearson, D.C., Song, L., Valdez, R.B. and Angulo, A.S. (2007) Youth Tobacco Sales in a Metropolitan County: Factors Associated with Compliance. American Journal of Preventive Medicine, 33, 91-97. https://doi.org/10.1016/j.amepre.2007.04.010
- 27. Clark, P.I., Natanblut, S.L., Schmitt, C.L., Wolters, C. and Lachn, R. (2000) Factors Associated with Tobacco Sales to Minors: Lessons Learned from the FDA Compliance Checks. JAMA, 284, 729-734. https://doi.org/10.1001/jama.284.6.729
- 28. Asumda, F. and Jordan, L. (2008) Minority Youth Access to Tobacco: A Neighborhood Analysis of Underage Tobacco Sales. Health Place, 15, 140-147. https://doi.org/10.1016/j.healthplace.2008.03.006