Open Journal of Statistics
Vol.2 No.5(2012), Article ID:25364,4 pages DOI:10.4236/ojs.2012.25060
Efficiency of Two-Stage Adaptive Cluster Sampling Design in Estimating Fringe-Eared Oryx
Mathematics Department, Faculty of Science, Egerton University, Njoro, Kenya
Email: *jdmwangi@egerton.ac.ke
Received September 28, 2012; revised October 30, 2012; accepted November 14, 2012
Keywords: Non-Overlapping Scheme; Cluster Sampling; Horvitz-Thompson Estimator
ABSTRACT
Two-stage adaptive cluster sampling and two-stage conventional sampling designs were used to estimate population total of Fringe-Eared Oryx that are clustered and sparsely distributed. The study region was Amboseli-West Kilimanjaro and Magadi-Natron cross boarder landscape between Kenya and Tanzania. The study region was partitioned into different primary sampling units with different secondary sampling units that were of different sizes. Results show that two-stage adaptive cluster sampling design is efficient compared to simple random sampling and the conventional twostage sampling design. The design is less variable compared to the conventional two-stage sampling design.
1. Introduction
The Fringe-eared Oryx is one of the subspecies of Oryx gazelle. They range from the grassland of Northern Eastern Tanzania to Southern Kenya [1] and they are conservation dependent species. Currently, the species is not listed as an endangered species but its populations are declining [1]. This is partly because in the past, they were hunted for their tough skin by European settlers [2] and recently they are being gunning down by poachers for their horns. The other causes for their decline are uncontrolled hunting for sport [1] and just like other wildlife, human encroachment to protected areas and land use changes [3] have led to the reduction in their numbers. The Fringe-Eared Oryx lives in clustered herds that vary in sizes from a few to hundreds of individuals [2] and are sparsely distributed [4]. They are mobile and can travel for long distances in search for food [1] since rainfall within Amboseli ecosystem is unevenly distributed [3]. To ensure adequate conservation and management of Fringe-Eared Oryx, knowledge of their numbers is critical.
Adaptive cluster sampling (ACS) was suggested for sampling populations that are clustered and rare [5]. ACS in which the initial sample is selected by simple random sampling with or without replacement was described by [5], where the initial sample is selected by systematic sampling was described by [6]. Ratio estimators in ACS were described by [7]. Smith [8] applied ACS to estimate density of wintering Waterfowl while [9] applied ACS to estimate abundance within local populations of low abundance plants.
Cochran [10] described two-stage (TS) sampling that is suitable when sampling large areas [11]. This is as a result of lower costs incurred when sampling selected PSUs rather than moving across the study area to perform sampling. PSUs [12] described two-stage adaptive cluster sampling (TSA) which is a combination of ACS and TS sampling designs. Smith [11] applied TSA to estimate density and abundance of fresh water mussels in the Upper Mississippi River using simulated data.
In this study, we evaluate the efficiency of TS and TSA sampling designs in estimating population total of FringeEared Oryx in Amboseli-West Kilimanjaro and MagadiNatron cross border landscape using data from aerial survey conducted in 2010 by KWS and other partners. Section two briefly describes the theory of TSA design, section three gives the method for the current study, section four gives results, and section five has the discussion and conclusion.
2. Two-Stage Adaptive Cluster Sampling Design
In the TSA design, which was proposed by [12], information from a pilot survey is used to design an efficient sampling procedure by controlling the final sample size and sampling cost. In this design, the study region consisting of  units is partitioned into
  primary sampling units (PSUs) each with
  secondary sampling units (SSUs) where
 . Let
. Let  be the observed value in
  secondary unit of
  primary unit and let
 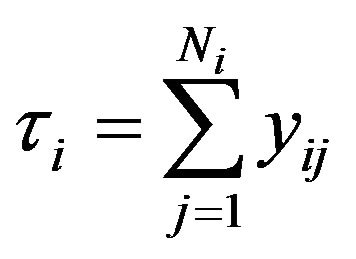 be the sum of the observed values in the
  primary unit.
In the first stage,  primary units are selected from
  units by simple random sampling (SRS) without replacement. In the second stage
  secondary units are selected from primary unit i, where
 , using simple random sampling without replacement. If any selected secondary unit meets a condition
 , neighboring units are added. If any of the added units meets the condition, still more units are added. The procedure continues until there are clusters of units each with units that meet the condition (network) surrounded by units that do not meet the condition (edge units). A neighborhood of a unit consists of itself plus its adjacent units on the North, East, West and South. The procedure results in two situations [12], where clusters intersect more than one PSUs (overlapping scheme) and where clusters are truncated at the boundary of PSUs (non-overlapping scheme).
Salehi and Seber [12], derived two design unbiased estimators, Horvitz-Thompson (HT) and Hansen-Hurwitz (HH) estimators. We consider the non-overlapping scheme since the estimators are more efficient compared to overlapping scheme [12]. We also make use of the HT estimator since it is more efficient compared to HH estimator [5,12].
Let  be an indicator function that is one if the initial sample intersect network k and zero otherwise, let
  be the number of networks in primary unit i,
  the sum of observed values in network k of primary unit i and
  be the number of units in network k in primary unit i, then the partial inclusion probability, that is the probability that units in the initial sample of primary unit I intersect network k, is given by [12]
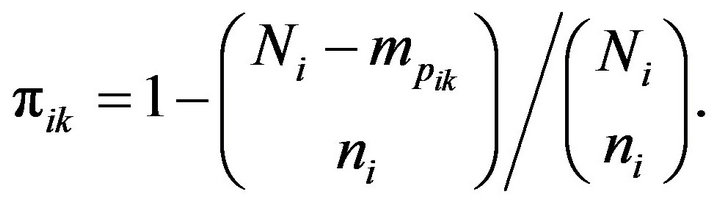
The HT estimator is thus given by [12]

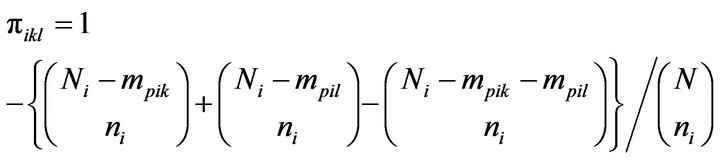
where . The second order partial inclusion probability is given by [12]
Let the variance for the  PSUs be
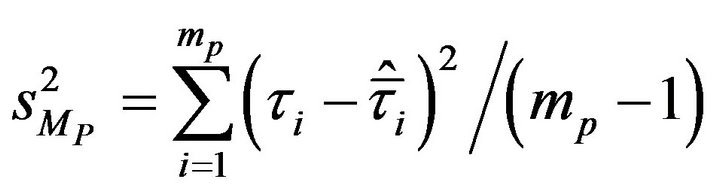
and the variance for SSUs be 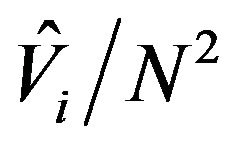 where
where
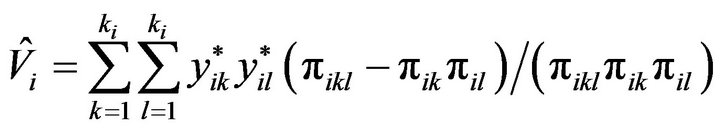 with
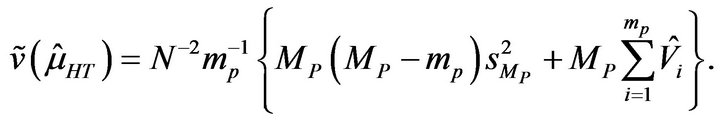
with ![]() the number of distinct networks intersected by primary unit i, an unbiased estimator of the variance of HT is given by
the number of distinct networks intersected by primary unit i, an unbiased estimator of the variance of HT is given by 
3. Method
Amboseli-West Kilimanjar/Magadi–Natron cross-border landscape stretches between Kenya and Tanzania. The landscape was placed on a rectangular grid which is, for the purpose of this study, the study area. The study area was divided into 24 × 18 squared units each measured 69.44 km2. Similar to [13], the study area was partitioned into 6, 12 and 18 PSUs based on the survey report [4] on the degree of rarity and clusteredness of Fringe-Eared Oryx in the study area. This enabled the study of large, medium and small sized PSUs where each measured 4999.68 km2, 2499.84 km2 and 1666.56 km2 respectively. For the adaptive design, the condition to adaptively add units was .
.
The sample sizes for large sized PSUs,  , were 2 and 3, for medium sized PSUs were 4 and 6 and for small sized PSUs were 6 and 9. Initial sample sizes for secondary units,
  , were 2, 3 and 4 in all cases for adaptive design. The sample size for SSUs for the non-adaptive design was set up to the effective sample size for the adaptive design.
Two-stage adaptive and non-adaptive designs were considered. In each case, re-sampling was carried out 1000 times. Efficiency was obtained as
 for adaptive and
 for non-adaptive design. Population total and variance were obtained as
 and
and 
for adaptive design and  and
and
 for non-adaptive designs respectively. For adaptive design only, the effective sample size was obtained as
 , that is, the average number of units in the final sample over the number of re-sampling. Estimates were obtained using Program SAMPLE [11].
4. Results
Results are shown in Table 1 below. From the table, TSA

Table 1. Efficiency (E), population total (T) and coefficient of variation (CV) of TSA and TS designs for a study region divided into Mp PSUs with a sample size of mp PSUs, n1 initial sample size for adaptive and a sample size n units for conventional design.
design has higher efficiency compared to the non-adaptive (TS) design. The adaptive design is efficient compared to SRS irrespective of the number or size of PSUs. Efficiency for the non-adaptive design is attained only when the study region is divided into 18 PSUs and using a sample size of 9 for PSUs.
For both adaptive and non-adaptive designs, Efficiency increases with increasing in number of units in PSUs in the study region as well as the sample size of PSUs and initial sample size/sample size for SSUs.
While the survey recorded a total of 196 Fringe-Eared Oryx [4], the population was estimated to range from 189 to 206 when adaptive design is used and from 192 to 225 upon use of non-adaptive design when the study region is partitioned into 6 PSUs. When the study region is partitioned into 12 PSUs, the total population for Fringe-Eared Oryx was estimated to range from 191 to 203 and from 191 to 207 when adaptive and non-adaptive designs are used respectively. Finally, Fringe-Eared Oryx are estimated to be between 185 and 201 using adaptive design and between 184 and 200 using non adaptive design for a study region that is partitioned into 18 PSUs.
Variation decreases with increasing initial sample size for SSUs, initial sample size for PSUs and the size of PSUs for both designs. TSA design is more reliable since it reports lower values of coefficient of variation compared to TS design.
For the adaptive design, the effective sample size is a function of the unit size of PSUs, sample size of PSUs and initial sample size of SSUs.
5. Discussion and Conclusions
Salehi and Seber [12] proposed a TSA due to its suitability in performing a pilot survey so as to design an experiment with a given precision of estimation. TS designs are economical designs when sampling such a large study area since they reduce movement within the large study area [11]. Since populations of Fringe-Eared Oryx are declining [4] and noting the vastness of the study area, TSA could be applied to for conservation purposes. Small initial sample sizes (2, 3 and 4) for secondary units were used for adaptive design; this was to avoid the negative variances on individual PSUs [12].
Results show that the size,  , and the sample size,
  , for PSUs as well as the initial sample size/sample size for SSU have an effect on the efficiency and amount of variance on the two-stage sampling for both adaptive and non-adaptive designs. The adaptive design resulted in higher efficiency with lower variance compared to the non-adaptive design. These results agree with [5] that adaptive designs result if higher efficiency and lower variance compared to conventional sampling designs.
For this study, highest precision is attained when the study region was partitioned into 18 PSUs each with 24 SSUs and where initial sample size for PSUs,  , is 9. The TSA still has a drawback of the final sample size. Further controlling the final sample size with this design deserves further study.
6. Acknowledgement
J. W. Mwangi and M. E. Salim thank David Smith for helpful comments of the previous version.
REFERENCES
- Woodland Park Zoo, “Fringe-Eared Oryx,” 1893. http://lib.colostate.edu/wildlife/item.php?id=132164
- V. L. Terrill, “Group of Fringe-Eared Oryx in Grass,” Vol. 15, No. 5, 2012. http://lib.colostate.edu/wildlife/item.php?id=132164
- M. M. Okello, “The Contraction of Wildlife Dispersal Areas by Human Structures and Activities in Mbirikani Group Ranch in the Amboseli Ecosystem, Kenya,” International Journal of Biodiversity and Conservation, Vol. 4, No. 6, 2012, pp. 243-259.
- Kenya Wildlife Service, “Aerial Total Count: AmboseliWest Kilimanjaro/Magadi-Natron Cross Border Landscape,” 2010. http://www.kws.org/export/sites/kws/info/publications/census_reports/Amboseli_West_kili_Magadi_Natron_2010_census_report.pdf
- S. K. Thompson, “Adaptive Cluster Sampling,” Journal of American Statistical Association, Vol. 85, No. 412, 1990, pp. 1050-1059. doi:10.1080/01621459.1990.10474975
- S. K. Thompson, “Adaptive Cluster Sampling: Designs with Primary and Secondary Units,” Biometrics, Vol. 47, No. 3, 1991, pp. 1103-1115. doi: 10.2307/2532662
- A. L. Dryver and C. T. Chao, “Ratio Estimators in Adaptive Cluster Sampling,” Environmetrics, Vol. 18, No. 6, 2007, pp. 607-620. doi:10.1002/env.838
- D. R. Smith, M. J. Conroy and D. H, Brakhage, “Efficiency of Adaptive Cluster Sampling for Estimating Density of Wintering Waterfowl,” Biometrics, Vol. 51, No. 2, 1995, pp. 777-788. doi: 10.2307/2532964
- T. Philippi, “Adaptive Cluster Sampling for Estimation of Abundances within Local Populations of Low Abundance Plants,” Ecology, Vol. 86, No. 5, 2005, pp. 1091-1100. doi: 10.1890/04-0621
- W. G. Cochran, “Sampling Techniques,” 3rd Edition, Wiley, New York, 1977.
- D. R. Smith, J. T. Rogala, B. R. Gray, S. J. Zigler and T. J. Newton, “Evaluation of Single and Two-Stage Adaptive Sampling Designs for Estimation of Density and Abundance of Freshwater Mussels in a Large River,” River Research and Applications, Vol. 27, No. 1, 2011, pp. 122- 133. doi:/10.1002/rra.1334
- M. M. Salehi and G. A. F. Seber, “Two-Stage Adaptive Cluster Sampling,” Biometrics, Vol. 53, No. 3, 1997, pp. 959-970. doi: 10.2307/2533556
- M. M. Salehi and D. R. Smith, “Two-Stage Sequential Sampling: A Neighborhood-Free Adaptive Sampling Procedure,” Journal of Agricultural, Biological and Environmental Statistics, Vol. 10, No. 1, 2005, pp. 84-103. doi: 10.1198/108571105X28183
NOTES
*Corresponding author.