Open Journal of Physical Chemistry
Vol.04 No.04(2014), Article ID:51073,18 pages
10.4236/ojpc.2014.44018
Effect of Chloride Concentration on the Corrosion Rate of Maraging Steel
Hussam El Desouky1, Hisham A. Aboeldahab1,2*
1Chemistry Department, University of Umm Al-Qura, Makka, KSA
2Chemistry Department, Faculty of Science, University of Alexandria, Alexandria, Egypt
Email: eldesouky4@gmail.com, *hdahab-41@hotmail.com
Copyright © 2014 by authors and Scientific Research Publishing Inc.
This work is licensed under the Creative Commons Attribution International License (CC BY).
http://creativecommons.org/licenses/by/4.0/


Received 27 August 2014; revised 25 September 2014; accepted 28 October 2014
ABSTRACT
The corrosion behavior of Maraging steel has been studied by using different techniques, includ- ing open circuit potential and polarization measurements in addition to microstructure examina- tion such as optical microscopy and XRD (X-Ray Diffraction) investigation. The corrosion behavior of Maraging steel has been examined in sodium chloride solutions with different concentrations from 0.1 M to 2 M. It was found that the corrosion resistance of Maraging steel is inversely propor- tional with the concentration of sodium chloride solution. The corrosion resistance is directly proportional to the Mo and Ti content in the Maraging steel. Heat treatment of the Maraging steel improved its mechanical properties with no effect on the corrosion behavior as the precipitation of inter-metallic compounds leading to some galvanic action. However, sample IV having lower Mo content than sample V showed after heat treatment an improvement in the corrosion resistance.
Keywords:
Maraging Steel, Polarization, Microstructure Examination, Optical Microscopy, XRD, Heat Treatment and Corrosion Resistance

1. Introduction
Studying the corrosion behavior of different kinds of steels is important being the most widely-used materials for constructions in our life, primarily due to the fact that they can be manufactured relatively cheaply in large quantities and to very precise specifications. They also provide an extensive range of mechanical properties from moderate strength levels with excellent ductility and toughness, to very high strength with adequate ductil- ity. Iron and steels comprise well over 80% by weight of the alloys in general industrial uses. Maraging steels are a class of high strength steels characterized by very low carbon contents and the use of substitutional ele- ments to produce age hardening in iron-nickel martensites. The very low carbon content and the use of interme- tallic precipitation to achieve hardening produce served unique characteristics that set maraging steel apart from conventional steels.
Maraging steel work well in electromechanical components where ultra-high strength is required, along with good dimensional stability during heat treatment. Several desirable properties of maraging steel are [1] :
Ultra-high strength at room temperature.
Simple heat treatment, which results in minimum distortion.
Superior fracture toughness compared to quenched and tempered similar strength level.
Low carbon content, which precludes decarburization problems.
Section size is an important factor in the hardening process.
Easily fabricated.
Good weld ability.
Maraging steel is characterized by a combination of good ductility, very high strength, good mechanical properties and simple heat treatment, so that Maraging steel considers the most important steel in the heavy in- dustry.
The useful characteristics of maraging steel are:
1) Excellent mechanical properties comprising high-to-weight ratios and high strength combined with good toughness.
2) Good processing characteristics including good hot and cold workability.
3) Simple heat treatment with no decarburization, no liquid quenching and high dimensional stability.
4) Good fabrication characteristics including a low rate of work hardening, good machinability and excellent weldability in annealed or aged conditions.
They are suitable for engine components, such as crank shafts and gears, and the firing pins of automatic wea- pons. It also used in surgical components and hypodermic syringes.
The present work is aimed to study the following: a) effect of adding different alloying elements on the corro- sion behavior of maraging steel; b) the corrosion behavior in different concentrations of Sodium Chloride; c) study the corrosion behavior of heat treated Maraging steel in Sodium Chloride solution.
The techniques used in this works included open circuit potential, linear polarization, microstructure investi- gation (Optical Microscope) and X-ray analysis.
2. Materials and Experimental Techniques
The corrosion behavior of maraging steel electrodes was studied in details using open circuit potential and potentiodynamic polarization measurements as well as optical microscopy and X-ray analysis.
2.1. Materials
Table 1 illustrates that there are five solution testament samples of maraging steel had been prepared and used in the corrosion testing of maraging steel. The solution treatment samples are I, II, III, IV and V. Only three heat treated samples of maraging steel (aged) were used in the experiments, these three samples are (I, IV and V).
2.2. For Electrochemical Measurements
The eight maraging steel electrodes (five solution treatment samples and three aged samples) used in the elec- trochemical experiments were cut as cylindrical shape. Copper wire welded on the top of the sample for the electrical contact. All samples (solution treatment samples and aged samples) were mounted in glass tubes by two component araldite leaving a surface area of ~0.8 cm2 to contact the test solution.
2.3. Polarization Measurements
Polarization measurements were carried out by the same electrodes in 0.6 M Sodium Chloride solution. Polarization studies were done using the same specimens in the same previous solutions in the polarization cell. E vs. log I curves were recorded at temperature 25˚C. Spiral platinum was used as the counter electrode (C); saturated calomel electrode (SCE) was used as reference electrode (RE). A constant quantity of the test solutions (100 ml) was taken in the polarization cell in order to make the conditions identical in all experiments. The corrosion ki- netic parameters such as corrosion current (Icorr), corrosion potential (Ecorr.), cathodic Tafel slope (ßc), and anodic Tafel slope (ßa) were derived from the curves. The polarization data were recorded from potentiostate model IM6e (Zahner Elektrik).
2.4. Electrolytes
Sodium chloride solutions were prepared from chemically pure grade ADWIC and five concentrations were used from Sodium Chloride 0.1 M, 0.3 M, 0.6 M, 1 M and 2 M. Second distilled water was used throughout the experiments for the preparation of the solutions. All experiments were approximately made at the same tempera- ture of 25˚C ± 0.5˚C.
3. Results and Discussion
3.1. Open Circuit Polarization Measurements
The open circuit (OC) potential is the potential of the working electrode relative to the reference electrode when no potential or current is being applied to the cell. Although Potentiometric experiments are very simple, they have many important applications. Potentiometric measurements are based on Nernst equation, which re- lates the concentration of electroactive species at the electrode surface (Cs) to the potential (E) at that electrode; that is, for the reaction: O + e− = R

Where Eo is the formal redox potential of the electron transfer reaction. The potential E is measured between two electrodes: the working electrode and the reference electrode.
The way in which a metal changes its potential upon immersion in solutions indicates the nature of reaction taking place at its surface. Whilst a shift in potential towards more positive values denotes film formation and thickening, a shift in the negative direction signifies film destruction and the exposure of more of the bare metal to the aggressive solution. The results obtained were made to be used to discuss the mechanism of oxide film growth or corrosion of the metal in solutions.
The open circuit potentials of steel electrodes with different compositions are followed, as a function of time in different solutions till steady state value (Ess). The concentrations of the test solutions were varied from 0.1 M to 2 M of Sodium Chloride.
3.1.1. Effect of Sodium Chloride Concentration on the Solution Treatment Maraging Steel
Figures 1-5 illustrate the effect of Sodium Chloride concentrations varied from 0.1 M to 2 M on solution treat- ment maraging steel, the open circuit potentials of the following electrodes I, II, III and IV have a tendency to shift towards more negative values with increasing Sodium Chloride concentrations. On the other hand, the open circuit potentials of V sample changing towards more noble values immediately on immersion in So- dium Chloride medium at any concentration varied from 0.1 M to 1 M. In sodium chloride solutions with concentration higher than 1 M the open circuit potential of this sample will tend to metal dissolution like the other samples.
As shown in Table 1, V electrode is the sample that contains the highest molybdenum content (4.48%) than the other samples (I = 0.0074%, III = 0.112 %, II = 0.0484% and IV 2.95%).
A theory for film thickening on the surface of metals and alloys based on open circuit potential-time mea- surements has been developed by A. M. Shams El-Din and Paul [2] . The essence of the theory is based on the idea that the potential is determined by a simultaneous anodic (film formation) and cathodic (oxygen reduction) couple, in which the anodic reaction is rate limiting. By presenting the data in the form of potential-log (time) curves, straight lines were obtained satisfying the relation

where t was the time from the moment of immersion in solution, δ¯ was the rate of oxide film thickening per-

Table 1. Chemical composition and designation of the tested samples.
The balance is the wt% of Fe in each sample.

Figure 1. Potential time curve for solution treatment Maraging steel samples in 0.1 M Sodium Chloride solution at room temperature.

Figure 2. Potential time curve for solution treatment Maraging steel samples in 0.3 M Sodium Chloride solution at room temperature.
decade of time, and β was given by:

α is a transference coefficient similar to that found in electrochemical kinetic rate expressions (0 < α < 1) and δ is the width of the activation energy barrier to be traversed by the ion during oxide formation, R is the gas con- stant and T is the absolute temperature (at 25˚C). Assuming α to have the value of 0.5 and δ the value of 1.0 nm, values of δ for the various steel examined can be calculated. By analogy with the case of Fe-Cr and molybde- num containing steels, it is assumed that the trivalent cations diffuse through the film to the oxide-solution in- terphase. The constant n in the equation is set equal to 3, and β acquires the value of 58.6 nm V−1.

Figure 3. Potential time curve for solution treatment Maraging steel samples in 0.6 M Sodium Chloride solution at room temperature.

Figure 4. Potential time curve for solution treatment Maraging steel samples in 1 M Sodium Chloride solution at room temperature.

Figure 5. Potential time curve for solution treatment Maraging steel samples in 2 M Sodium Chloride solution at room temperature.
The presence of Chloride ions in solution initiates breakdown of passivity and the reaction is diffusion con- trolled. With increasing chloride concentrations, the diffusion components disappear and the interfacial reactions become charge transfer controlled, so that the tendency for steel to corrode in solutions increases with increasing Sodium Chloride concentration [3] .
The film thickening of V increases at Sodium Chloride solutions from 0.1 M to 1 M but after this range the steel tends to breakdown the layer, the rate of oxide thickening representative curve in the figure, amounted along the fires segment δ1, was always higher than that along the second δ2. This may be correlated with the creation of ionic current which would decrease with increased film thickness with subsequent decrease of the growth rate [2] .
In Sodium Chloride solutions at concentrations varied from 0.1 M to 1 M, the film thickening rate δ increased gradually with increasing the concentration of Sodium Chloride. This may be explained by assuming that the adsorption of these ions initiates a larger field strength which promotes the development of thicker oxide film but at 1 M Sodium Chloride the film starts to breakdown [4] .
3.1.2. Effect of Aging on Maraging Steel
Effect of Sodium Chloride on Aged Maraging Steel
The open circuit potential of aged maraging steel electrodes will be inspected in Figure 6 in 0.1 M Sodium Chloride solution, which represent that all samples even V, will be corroded in 0.1M Sodium Chloride after heat treatment.
The steady state potential of the solution treatment maraging steel in 0.1 M Sodium Chloride for I, IV and V are –460 mV, –370 mV and –220 mV respectively, but in case of 0.1 M Sodium Chloride aged maraging steel the steady state potential for I, IV and V are –475 mV, –400 mV and –370 mV respectively, so that by compari- son the open circuit potential of the aged steel samples will shift towards more negative values than the solution treatment samples.
From the previous results it can be concluded that the corrosion behavior of solution treatment maraging steel is better than the aged maraging steel. On the other hand aged steel has a good mechanical properties than the solution treatment steel, because intermetallic compounds which formed inside the alloy have different electro negativity between each ether, so that galvanic corrosion may be appeared, which can be lead to increase the corrosion of the aged maraging steel more than the corrosion of solution treatment maraging steel.
Table 2 represents the average results of the room temperature mechanical testing of investigated steels after solution treatment at 820˚C for 1 hour and air cooling. The data representing the 0.2% offset yield (Rp0.2) and

Figure 6. Potential time curve for aged Maraging steel samples in 0.1 M Sodium Chloride solution at room temperature.
Table 2. Mechanical properties of Maraging steel before and after aging.
ultimate tensile strength (Rm) as well as tensile elongation (A). The ultimate tensile and yield strength increased from 757 and 645 to 1092 and 890 N/mm2, respectively, with increasing Ti up to 1.6%. Figures 7-9 illustrate the mechanical properties of the solution treatment and aged Maraging steels.
3.2. Polarization measurements
3.2.1. Effect Sodium Chloride Concentrations on Solution Treatment Maraging Steel
The resistance of metals and alloys to corrosion is dependent upon multitude of factors. It is therefore difficult to predict the behavior of a metal or alloy in a special environment or to establish the optimal choice of alloy in a give process. The comparison of the polarization curves for different metals in the same solution provides in- formation, which can also be applied to other solutions. Alloys can be ranked with regard to corrosion resistance and the influence of different alloying element can be determined with respect to different corrosion parameters. However, the appearance of the polarization curves depends on the method used.
In different concentrations of Sodium Chloride solutions varied from (0.1 M to 2 M), the polarization meas- urements of the five maraging steel electrodes (I, II, III, IV and V) were started at –1000 mV. At this potential, the electrodes are activated, since surface oxide is reduced or pealed off as a result of hydrogen evolution. Dis- solution of metal may take place, since the potential is well above the equilibrium potential for iron but dissolu- tion is very slow. Green and Leonard and others [5] reported that the time for activation and the potential at which this occurs are of considerable importance for the shape of the polarization curve. The current density (I) (mA/cm2) was plotted against polarization potential (E) (Vs. SCE) (I/E curves) from the figures. In all concen

Figure 7. Comparison between mechanical properties (yield strength) of solution treatment and aged Maraging steel.

Figure 8. Comparison between mechanical properties (ultimate tensile strength) of solution treatment and aged Maraging steel.
trations of Sodium Chloride solution (0.1 M to 2 M). V and IV samples have less negative potential values than II, III and I samples.
Figures 10-14 display the potential-current density curves from each sample individually in different concen- trations of Sodium Chloride (from 0.1 M to 2 M).
Log concentration of Sodium Chloride solutions against Log anodic corrosion current (Log Icorr) was plotted Figure 15 in order to confirm the polarization results and Icorr values are tabulated in Table 3, electrode V is the lowest Icorr value than the other samples.

Figure 9. Comparison between mechanical properties (Elongation) of solution treatment and aged Maraging steel.

Figure 10. Polarization curve for Maraging steel samples in 0.1 M Sodium Chloride solution at room temperature.

Figure 11. Polarization curve for Maraging steel samples in 0.3 M Sodium Chloride solution at room temperature.

Figure 12. Polarization curve for Maraging steel samples in 0.6 M Sodium Chloride solution at room temperature.

Figure 13. Polarization curve for Maraging steel samples in 1 M Sodium Chloride solution at room temperature.

Figure 14. Polarization curve for Maraging steel samples in 2 M Sodium Chloride solution at room temperature.
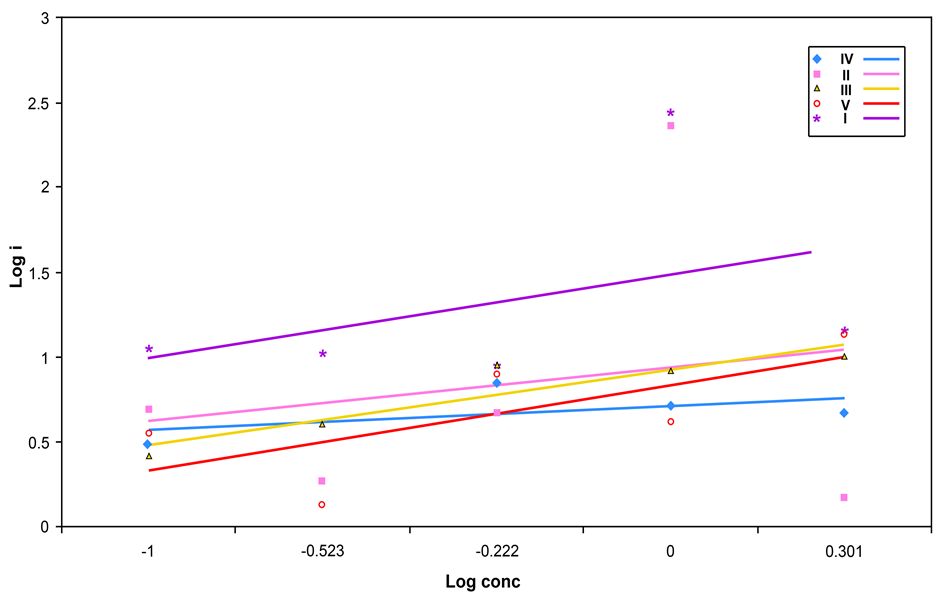
Figure 15. Log i-Log concentration of Sodium Chloride solution curve for solution treatment Maraging steel samples at room temperature.
Table 3. Polarization of solution treatment maraging steel in different concentrations of NaCl.
Log concentration of Sodium Chloride solutions against corrosion potential (Ecorr) was plotted in the Figure 16 in order to illustrate the corrosion behavior of the steel in different concentration of Sodium Chloride, the re- sults is summarized in Table 4. Electrode V is the most corrosion resistive specimen then IV, II, III and I be- cause it is the highest Ecorr values than the other samples.
At low concentrations of Chloride, the curves exhibit a passive region that disappears as the potential increases in the noble direction. The passive film breakdown potential moves in the active direction as the concentration of Chloride is increased to such extent that, at higher concentrations the passive region completely disappears. The free corrosion potential, Ecorr decreases with an increase in Sodium Chloride concentration [3] .
The passive current density obtained from polarization curves is not a stationary current density. The statio- nary passive current density is reached after prolonged polarization [6] -[10] .
3.2.2. Effect of Aging on Maraging Steel
Effect of Sodium Chloride concentrations on Aged Maraging Steel
The polarization potential of aged maraging steel electrodes can be inspected in the figure in 0.1 M Sodium

Figure 16. Ecorr-Log concentration of Sodium Chloride solution curve for solution treatment Maraging steel samples at room temperature.
Table 4. Polarization of solution treatment maraging steel in different concentration of NaCl.
Chloride solution, which represent that IV sample has a more positive values than V and I respectively.
Figures 17-20 will illustrate comparison between the polarization curves of solution treatment and aged ma- raging steel in 0.1 M Sodium Chloride solution.
3.3. Metallographic Examination of Corroded Alloys
3.3.1. Optical Microscopy
Figure 21 shows the results of optical microscopic examination after different treatment for different samples. Microscopic examination was carried out to investigate the effect of alloying elements additions and heat treatments on the microstructure changes after different treatments, investigated that, heat treatment of the maraging steel has a good influence on its mechanical properties but has no effect on the corrosion behavior of it. Because of the precipitation of intermetallic compounds which will tend to some kind of the galvanic corrosion.
3.3.2. X-Ray Diffraction Analysis
Figures 22-25 show the results of X-ray diffraction analysis for the two samples IV and V (after solution treat- ment and after aging). For IV XRD figures, in solution treatment sample martensite phase only is appeared be-

Figure 17. Polarization curve for aged Maraging steel in 0.6 M Sodium Chloride solution at room temperature.

Figure 18. Polarization curve for V sample before and after heat treatment in 0.6 M Sodium Chloride solution at room temperature.

Figure 19. Polarization curve for IV sample before and after heat treatment in 0.6 M Sodium Chloride solution at room temperature.

Figure 20. Polarization curve for I sample before and after heat treatment in 0.6 M Sodium Chloride solution at room temperature.

 Sample I Sample II
 Sample III Sample IV
 Sample V
Figure 21. Optical microscopic examination for different samples.
fore and after aging. So that, solution treatment samples will be more corrosion resistance than aged sample as aresult of the precipitation of the intermetallic compounds which leads to form more galvanic cells. For V sample XRD figures, in solution treatment sample martensite phase is appeared in addition to small quantity from the iron austenite (Fe, C) phase but after aging martensite phase is only appeared. So that, solution treatment samples will be more corrosion resistance than aged sample as a result of the precipitation phenomena.
Microscopic examination and X-ray investigation were carried out to investigate the effect of alloying ele- ments additions and heat treatments on the microstructure changes after different treatments, investigated that,

Figure 22. X-ray diffraction analysis for solution treatment IV.

Figure 23. X-ray diffraction analysis for aged IV.
heat treatment of the maraging steel has a good influence on its mechanical properties but has no effect on the corrosion behavior of it. Because of the precipitation of intermetallic compounds which will tend to some kind of the galvanic corrosion. Finally, although IV sample is lower than V in Molybdenum content but IV after heat treatment, it has an observed improvement in mechanical properties and corrosion resistance [11] -[16] .
4. Conclusions
Based on results of investigation, the following conclusions may be drawn:
1) The corrosion rate of solution treatment and aged maraging steel specimen in Sodium Chloride solutions with different concentrations from 0.1 M to 2 M is substantial.

Figure 24. X-ray diffraction analysis for solution treatment V.

Figure 25. X-ray diffraction analysis for aged V.
2) The corrosion rates of the examined specimens are influenced by the concentration of the Sodium Chlo- ride medium. The corrosion rate of the tested specimens under investigation increases with increase in concen- tration of chloride.
3) The corrosion rate of solution treatment samples is less than that of aged samples in Sodium Chloride solutions.
References
- Fathy, A., El-Faramawy, H.S., Mattar, T., Eissa, M. and Bleck, W. (2004) Metals, 1.
- Shams El-Din, A.M. and Paul, N.J. (1990) Oxide Film Thickening on the Surface of Metals in Aqueous Solutions: A Critique of the Theory of Open-Circuit Potential Transients. Thin Solid Films, 189, 205-216. http://dx.doi.org/10.1016/0040-6090(90)90449-N
- Hegazy, M.M. and Eissa, M.M. (1992) J. of the Faculty of Education, 17, 377.
- Shams El-Din, A.M., Wang, L. and Saber, T.M.H. (1994) Behaviour of High Strength Molybdenum Containing Stain- less Steels in Arabian Gulf Water. Part 1: Oxide Film Thickening. British Corrosion Journal, 29, 58-64. http://dx.doi.org/10.1179/000705994798267935
- Greene, N.D. and Leonard, R.B. (1964) Comparison of Potentiostatic Anodic Polarization Methods. Electrochimica Acta, 9, 45-54. http://dx.doi.org/10.1016/0013-4686(64)80004-9
- Fathy, A., Mattar, T., El-Faramawy, H.S. and Bleck, W. (2002) Materials Technology, 12, 549.
- Shams El-Din, A.M., Wang, L. and Saber, T.M.H. (1994) Br.Corros. J., 29, 58.
- El-Meligi, A.A. and Ismail, N. (2009) Hydrogen Evolution Reaction of Low Carbon Steel Electrode in Hydrochloric Acid as a Source for Hydrogen Production. International Journal of Hydrogen Energy, 34, 91-97. http://dx.doi.org/10.1016/j.ijhydene.2008.10.026
- Fouda, A.S., El-TaibHeakal, F. and Radwan, M.S. (2009) Role of Some Thiadiazole Derivatives as Inhibitors for the Corrosion of C-Steel in 1 M H2SO4. Journal of Applied Electrochemistry, 39, 391-402. http://dx.doi.org/10.1007/s10800-008-9684-2
- Heo, N.H. and Lee, H.C. (1995) Metals Mater, 58, 77.
- Hondros, E.D. and Seah, M.P. (1977) Int. Met. Rev., 22, 262. http://dx.doi.org/10.1179/imr.1977.22.1.262
- Seah, M.P. (1980) Adsorption-Induced Interface Decohesion. Acta Metallurgica, 28, 955-962. http://dx.doi.org/10.1016/0001-6160(80)90112-1
- Hossein Nedjad, S., Nili Ahmadabadi, M. and Furuhara, T. (2008) Metall. Mater. Trans. A, 39A, 19.
- Squires, D.R. and Wilson, E.A. (1972) Aging and Brittleness in an Fe-Ni-Mn Alloy. Metallurgical Transactions, 3, 575-585. http://dx.doi.org/10.1007/BF02642065
- Heo, N.H. (1996) Ductile-Brittle-Ductile Transition and Grain Boundary Segregation of Mn and Ni in an Fe-6Mn-12Ni Alloy. Scripta Materialia, 34, 1517-1522. http://dx.doi.org/10.1016/1359-6462(96)00032-2
- Hossein Nedjad, S., Nili Ahmadabadi, M. and Furuhara, T. (2008) Correlation between the Intergranular Brittleness and Precipitation Reactions during Isothermal Aging of an Fe-Ni-Mn Maraging Steel. Materials Science and Engineering: A, 490, 105-112. http://dx.doi.org/10.1016/j.msea.2008.01.070
NOTES

*Corresponding author.