Open Journal of Microphysics
Vol.3 No.2(2013), Article ID:31729,6 pages DOI:10.4236/ojm.2013.32006
Effect of Gold Nanoparticle on Percentage Depth Dose of 18 MV X-Ray in MAGICA Polymer Gel Dosimeter
1Physics Department, Mazandaran University, Babolsar, Iran
2Para Medical Department, Babol University of Medical Sciences, Babol, Iran
3Medical Physics Department, Tehran University of Medical Sciences, Tehran, Iran
Email: *m.mahdavi@umz.ac.ir
Copyright © 2013 Mohammad Mahdavi et al. This is an open access article distributed under the Creative Commons Attribution License, which permits unrestricted use, distribution, and reproduction in any medium, provided the original work is properly cited.
Received December 9, 2012; revised January 10, 2013; accepted January 18, 2013
Keywords: Percentage Depth Dose; Polymer Gel Dosimeter; Gold Nanoparticles
ABSTRACT
Radiation-sensitive polymer gels are among the most promising three-dimensional dose verification tools and tissuelike phantom developed to date. This study is an investigating of percentage depth dose enhancement within the gel medium with the use of conformal distribution gold nanoparticle as contrast agents by high atomic number material. In this work, the normoxic polymer gel dosimeter MAGICA tissue-equivalence was first theoretically verified using MCNPX Monte Carlo code and experimentally by percentage depth dose curves within the gel medium. Then gold nanoparticles (GNPs) of 50 nm diameter with different concentrations of 0.1 mM, 0.2 mM, and 0.4 mM were embedded in MAGICA gel and irradiated by 18 MV photon beam. Experimental results have shown dose increase of 10%, 2% and 4% in 0.1 mM, 0.2 mM and 0.4 mM concentrations, respectively. Simulation results had good agreement in the optimum concentration of 0.1 mM. The largest error between experimental and simulation results was equal to 9.28% stood for 0.4 mM concentration. The results showed that the optimum concentration of gold nanoparticles to achieve maximum absorbed dose in both experimental and simulation was 0.1 mM and so it can be used for clinical studies.
1. Introduction
Gel dosimetry has been worked as a clinical dosimeter since the 1950s. During the last two decades, however, the number of investigators in this field has increased rapidly, and the knowledge of gel dosimetry has been expanded considerably. Gel dosimetry is still in its research phase and it seems that its contribution to clinical use proceeds slowly [1]. In this study, a new type of gel dosimeter with the acronym of MAGICA was used. This type of gel dosimeter was manufactured by adding agarose to the ingredient of MAGIC gel dosimeter [2]. MAGICA gel dosimeter was manufactured in Novin Radiation Medicine Institute (I.R. Iran) in 2004 [3]. In this study, for the first time, MAGICA polymer gel was used with GNPs and depth dose enhancement was evaluated by gel dosimetry in close relation to the Monte Carlo simulation of irradiation condition within megavoltage X-ray field.
2. Materials and Method
2.1. GNPs Preparation
In contemporary research, various synthesis techniques are being developed for GNPs fabrication. In this study, GNps of 50 nm size obtained from PNF Co. (Payamavaran Nano Fardanegar Co., Tehran, Iran) as gold nanoparticles in aqueous solution with 7 mg/ml (7000 ppm) concentration. In PNF Company, nanoparticles are produced by applying extra high electric voltage and current and the primary bulk wire with 0.1 mm diameter is then converted into the nanoparticles via pulse explosive process.
2.2. Gel Fabrication
A MAGICA polymer gel dosimeter was prepared. All chemicals (gelatin, ascorbic acid, CuSO4.5H2O, hydroquinone and methacrylic acid) were provided by Sigma Aldridge with experimental grade. HPLC water was obtained from Novin Medical Radiation Institute in Tehran. The preparation of the gel was carried out in a similar procedure as described by Fong et al. (2001) with slight difference due to the presence of agarose in MAGICA formulation [2]. For preparation, first, water was divided into 5 flasks of varying sizes, ready for dissolving each substance. Gelatin was added to about 60% of the total HPLC de-ionized water. Two electrical heating plates provided with magnetic stirring and thermostat control were used to heat the solutions. Gelatin was allowed to swell for about an hour and then the solution was stirred and heated to about 50˚C until a clear solution was obtained, ensuring all gelatin powder has been dissolved. When the temperature of gelatin solution reached near 40˚C, agarose was added to about 30% of warm water which had been heated up to 50˚C. Agarose solution was stirred and heated to about 90˚C at which agarose was thoroughly dissolved. At this time gelatin solution should be near 50˚C. Both solutions were allowed to cool. The gelatin solution was larger in volume compared to the agarose solution, thus agarose solution cools faster in spite of its higher temperature. However, the cooling rates can be adjusted with respect to each other by proper adjustment of the heating plates. When both solutions cooled to an equal temperature about 47˚C, agarose solution was added to the gelatin solution and stirring continued. Stirring didn’t stop before the end of fabrication. At 45˚C, Hydroquinone was added to the mixture in 5% of water weight. The remaining 5% of water were divided into two portions and in each portion Ascorbic Acid (AA) and Copper (II) sulphate were dissolved after being weighed. These two chemicals, which together play the role of oxygen scavenger, were added to the mixture.
When temperature declined to about 37˚C Methacrylic Acid (MAA) was added at the same temperature. The amount of MAA for all gel fabrications was 9% of the total weight of gel except in one experiment in which more MAA was used. The gel was then decanted into test tubes or poured into the phantoms and left in a typical refrigerator at about 4˚C to set. When the preparation of final polymer solution was completed, MAGICA gel separated in four portions. One part is 400 ml for MAGICA gel and three parts in same capacities separated into 200 ml for incorporation different concentration gold nanoparticle in MAGICA gel by routine mechanical mix without heating. Three different GNp concentrations were considered: 0.1 mM, 0.2 mM, and 0.4 mM. After preparation of MAGICA and Gold Nano_MAGICA (GN_MAGICA) they were poured into calibration tubes and test vials for putting in a refrigerator at about 4˚C.
2.3. Irradiation Procedures
Gel samples were irradiated with 18 MV photon beams from Varian 2100 C/D (Varian Medical Systems, Palo Alto, CA) linear accelerator. The control MAGICA gel vial and GN_MAGICA vials were arranged randomly in the water-filled phantom size 25 × 25 × 10 cm3. The irradiation set up for GN_MAGICA listed in Table 1. Also, for calibration MAGICA gel, calibration tubes fixed in the water-filled phantom.
These tubes were irradiated with doses in the range of 0 - 600 cGy (0, 100, 250, 500, 600 cGy) for 18 MV photon beam with SSD equal to100 cm and field size of 25 × 25 cm2. Dosimetry by ionization chamber (Farmer, PTW co) was done to ensure that proper and uniform dose was received by the polymer gel medium within the radiation field.
2.4. MRI Reading and Preparing an R2 Map
Several methods exist for dose response read out in gel dosimetry such as optical CT, Raman spectroscopy, nuclear MR, MRI and etc. In this study the proton magnetic properties variation was exhibited by magnetic resonance imaging (MRI).
Gels were imaged using a 0.5 T MRI (Philips) 24 hours after irradiation to ensure that the polymerization mechanism has completely MRI was done. An MRI protocol that minimized the noise in 0.5T MR image was found (Table 2).

Table 1. Irradiation set up information including field size, source to surface distance, number of monitor unit and deliver dose.

Table 2. Optimum imaging protocol used for a Philips 0.5 T MRI system readings.
The gel phantom was put in head coil as show in Figure 1. To ensure that the obtained R2 values were not influenced by possible temperature gradients in the gel, phantoms were left in MRI room 4 hours before scanning. Since the gel temperature during imaging increased up to 3˚C, a little motion artifact is expected in MR image. R2 (=1/T2) maps were computed using modified radiotherapy gel dosimetry image processing software coded in MATLAB (version 7.3.0.2.6 Math works).
2.5. Monte Carlo Simulation
Radiation transport in matter using Monte Carlo method was used as described in MCNPX version 2.4.0 code to determine photoelectric, Compton, pair-creation and Rayleigh cross sections and calculate dose deposition in MAGICA polymer gel. Gold presence in gel was similar to the experiment set up. Percentage depth dose curves (PDD) were obtained experimentally and by simulation using the cross sections determined in MCNPX code to 18 MV clinical beams. The Varian 2100 C/D accelerator head was simulated by using the open literature information for 18 MV photons. The phantom size was 25 × 25 × 11 cm3 (Figure 2) and SSD was 100 cm for all simulations. F2 tally was used for depth dose calculation. Simulations were done by using three 2.4 GHz Pentium 4 processor and time of the single simulation was about 20 days for obtaining the less than 1.6% relative error in gel vial area. Photon and electron energy cut-offs were set to
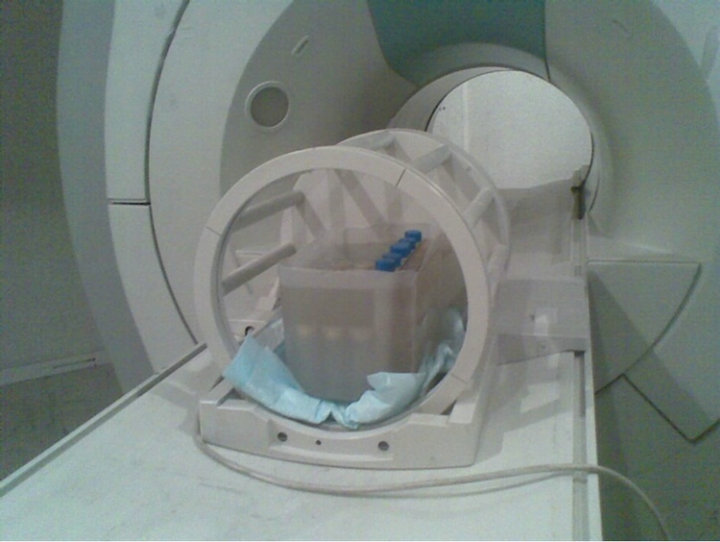
Figure 1. Gel vials put in the center of head coil.
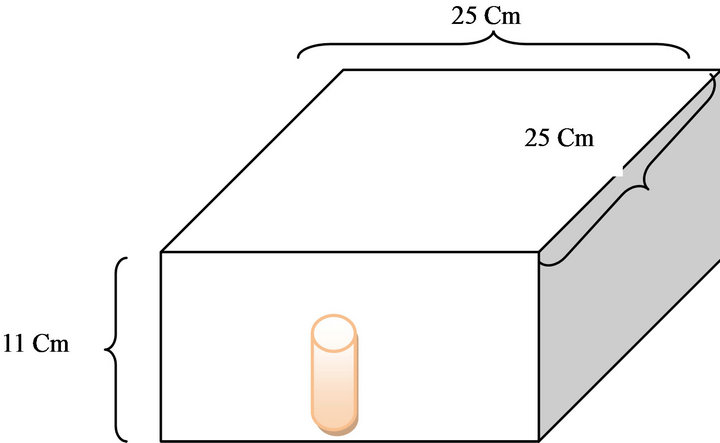
Figure 2. Geometry of simulated phantom.
1 keV and 10 keV in the entire geometry, respectively. The number of histories for each simulation was estimated to be 9.5 × 10⁸ in number. Figure 2 shows the geometry of simulated phantom.
3. Results and Discussion
MAGICA response to the 18 MV X-ray beam was characterized by R2 signal relation to Dose. Figure 3 shows calibration curve.
As it can be seen the calibration curve is almost linear within the range of 0 - 600 cGy which has been experienced in this study with gel sensitivity is about 0.0109 s−1·cGy.
Also, for verification of dosimeter behavior of MAGICA polymer gel, Farmer chamber dosimeter has been used. The percentage depth dose curve of two dosimeters was compared with each other that are shown in Figure 4.
According to the Figure 5, it is concluded that they have appropriate accordance so that its p-value is 0.001 < 0.05.
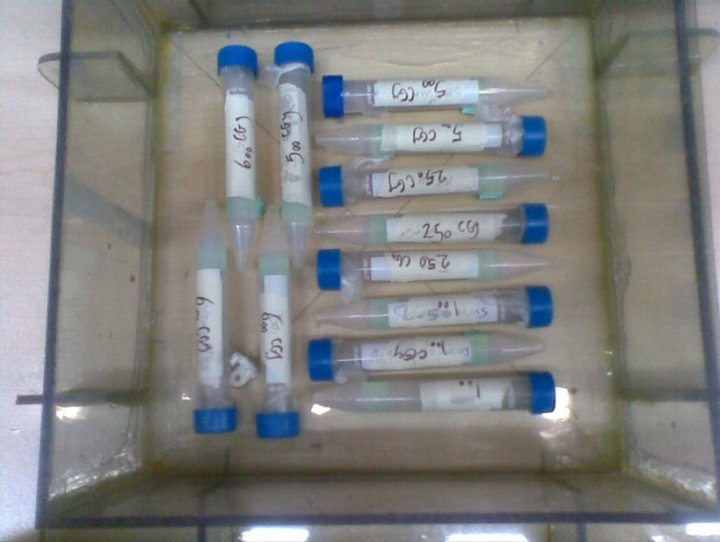
Figure 3. MAGICA calibration tubes arrangement in the water phantom.
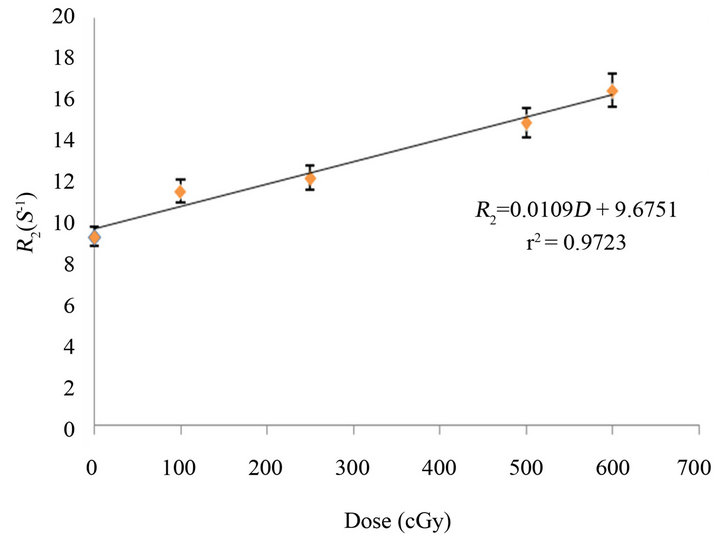
Figure 4. MAGICA polymer gel dosimeter R2 response on absorbed dose in range of 0 - 600 cGy.
We obtained percentage depth dose for different concentrations of GNPs in GN_MAGICA and the results were shown in Figure 5.
Figure 6 illustrates when GNPs concentration increases from 0.1 mM to more concentration depth dose decreases, but when the concentration increases from 0.2 to 0.4 mM the PDD behaves inversely and PDDs of both concentration are situated below the MAGICA gel alone in spite of PDD of 0.1 mM concentration that is situated well above the MAGICA gel alone.
Also the percentage depth dose curve gained from Monte Carlo simulation by using of MCNPCX code has been illustrated in Figure 7.
In this curve, the increase of absorbed dose in buildup region can also been seen which in concentrations 0.1 mM, 0.2 mM and 0.4 mM, equals to 9%, 6% and 2% respectively.
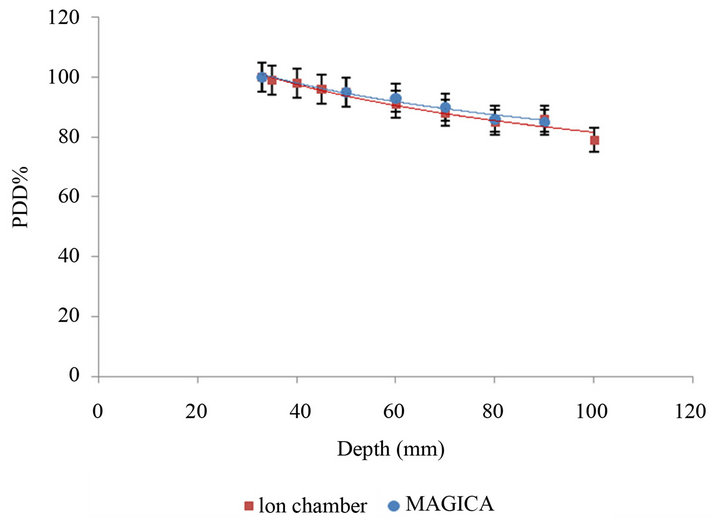
Figure 5. Percentage Depth Dose (PDD (%)) of curve MAGICA gel and ion chamber measured in water phantom.
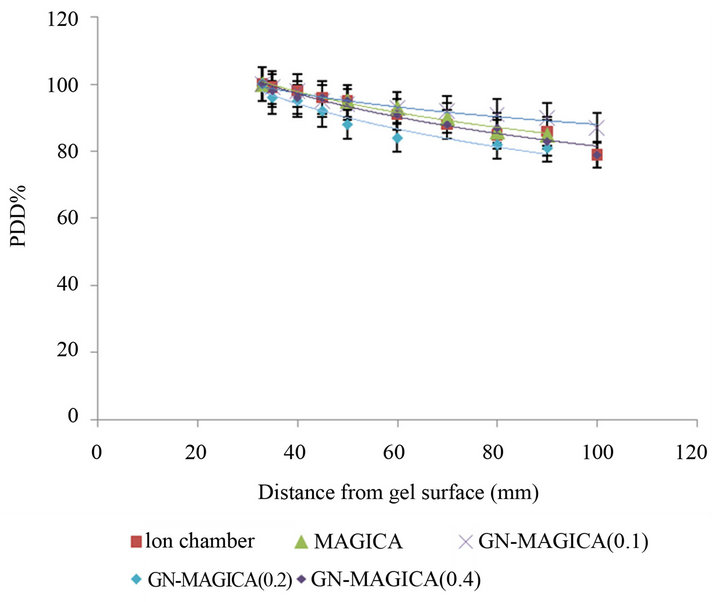
Figure 6. Comparison of three GNPs concentration with MAGICA depth dose curve.
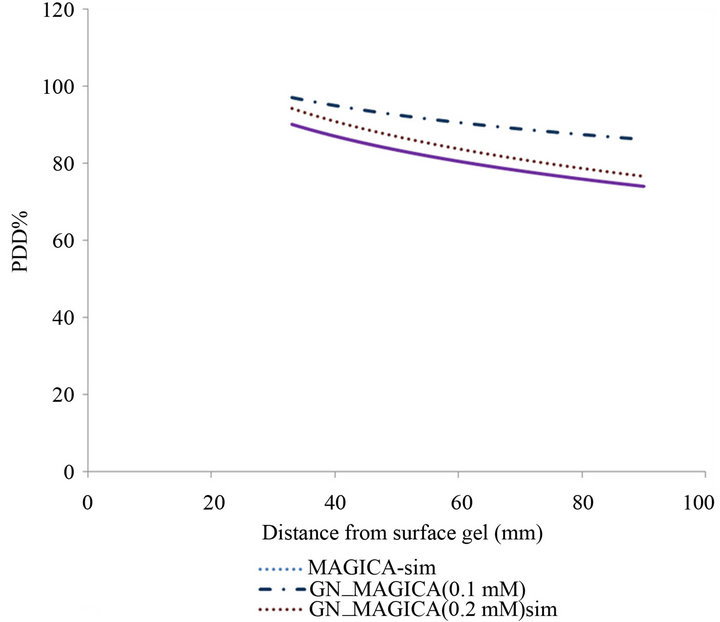
Figure 7. Comparison between MAGICA and GN_MAGICA percentage depth dose in simulation.
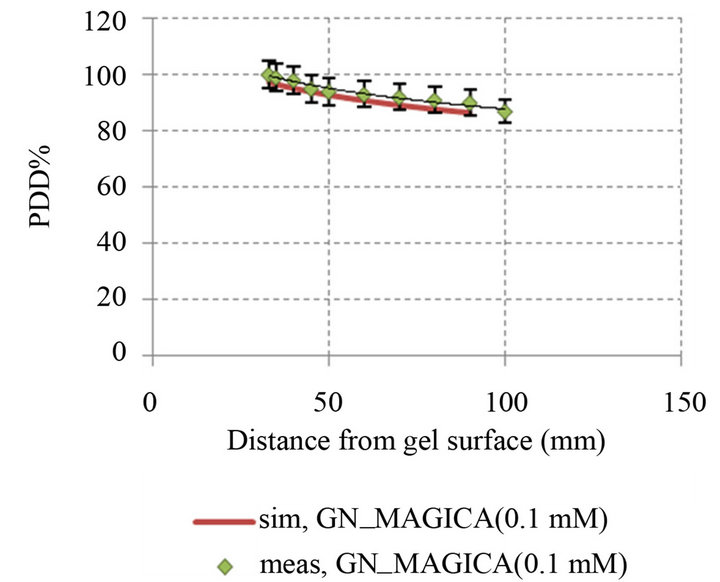
The percentage depth dose of MAGICA and GN_ MAGICA with different concentrations, compared between experimental and simulation results were illustrated in Figure 8.
Based on the Figure 8, the mean of error percent between simulation and experimental data by using of following relation is computed:
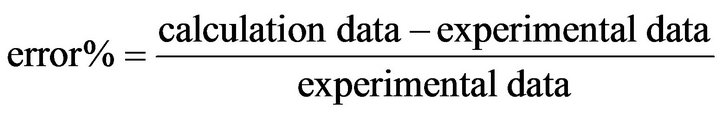
So that the error level for MAGICA polymer gel equals 1.01% and GN_MAGICA with concentrations of 0.1 mM, 0.2 mM and 0.4 mM is 2.8%, 5.7% and 9.8% respectively.
4. Conclusion
Two major advantages of polymer gel dosimeters were their ability to determine integrated 3D dose distribution, as well as their ability to form in different shapes [4]. In fact, polymer gel dosimeters were monomers which distributed in a gelling matrix. Ionizing radiations convert these monomers to polymers via distinguished mechanism [5]. The polymerization degree is dependent on the absorbed dose in gel dosimeter. After polymerization, magnetic properties of polymer surrounding protons are changed [4]. These changes could be exhibited by magnetic resonance imaging. The spin-spin relaxation rate R2 = 1/T2 is related to the absorbed dose which was delivered to a gel phantom [6-8]. One of the polymer gels advantages is able to directly measure the effects of contrasts agents or metallic radiation dose enhancers such as iodine and gold nanoparticles (GNPs) inside the dosimeter. In gel dosimeters, contrast agents may have uniform dispersion within the dosimeter and therefore the effects
 (a)
(a)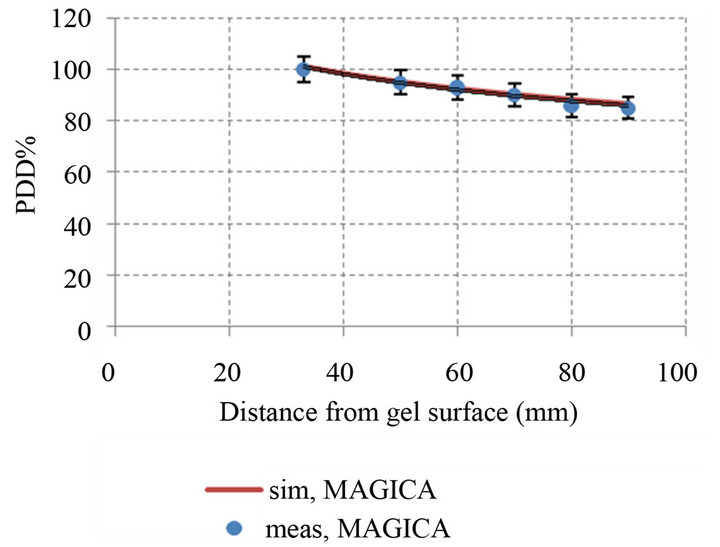 (b)
(b)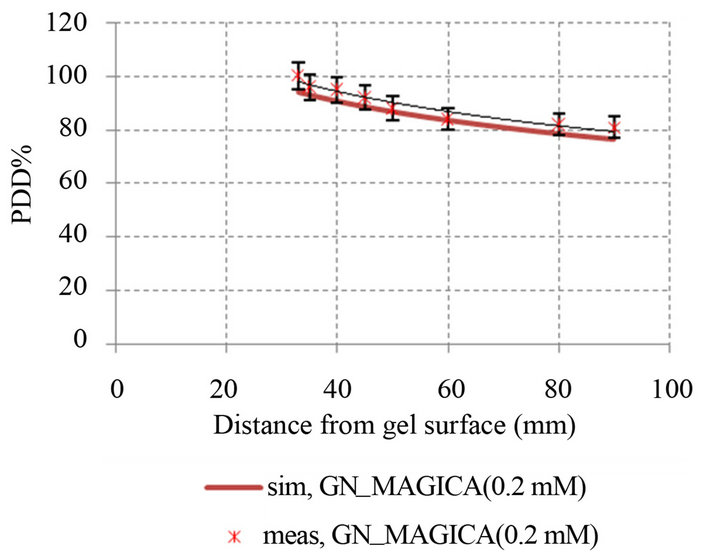 (c)
(c)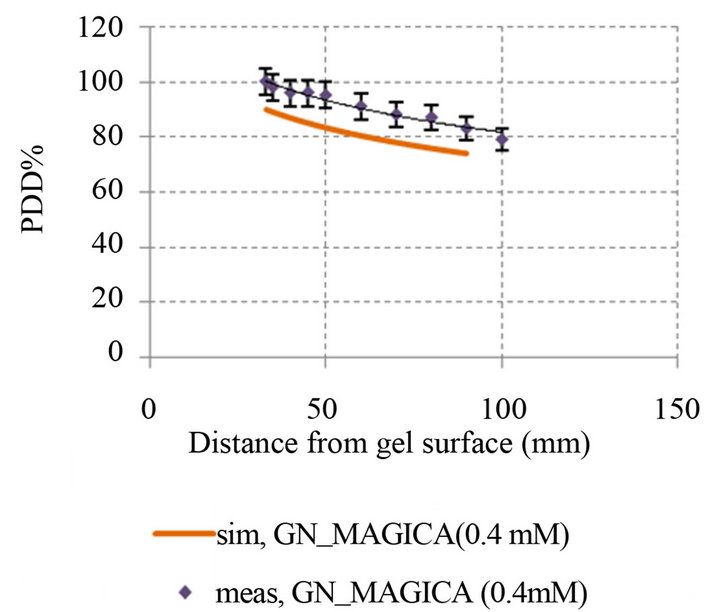 (d)
(d)
Figure 8. Comparison percentage depth dose curve between simulation and experimental in different GNPs concentration: (a) PDD simulation and experimental MAGICA (p-value < 0.05); (b) PDD simulation and experimental GN_MAGICA (0.1 mM) (p-value < 0.05); (c) PDD simulation and experimental GN_MAGICA (0.2 mM) (p-value < 0.05); (d) PDD simulation and experimental GN_MAGICA (0.4 mM) (p-value < 0.05).
of this material can be directly quantified. Physical measurement of the dose enhancement produced by high Z materials with other types of radiation dosimeters, such as film and ionization chambers, are quite complicated. According to experimental and simulation results, by adding of gold nanoparticles to the MAGICA polymer gel absorbed dose is increased. Of course in 0.2 mM and 0.4 mM concentrations, absorbed dose enhancement wasn’t significant and less than in 0.1 mM concentration. So it can be concluded that in concentrations more than 0.1 mM for gold nanoparticle with 50 nm size, shielding effect has been created. However, by attention to the used 18 MV energy, predominancy of the phenomenon of pair production in these results will be seen. Totally, in experimental results, the absorbed dose enhancement in 0.2 mM gold nanoparticle concentration was lower than 0.4 mM. But in simulation method, it was observed that by the increase of gold nanoparticles concentration, the absorbed dose enhancement has decreased.
5. Acknowledgements
This research was supported by a grant from the Babol university of Medical sciences 9031721. We are also thankful to Dr. Mohammad Zahmatkesh (Tehran Novin Medical Radiation Institute) for use gel dosimetry laboratory
REFERENCES
- G. S. Ibbott, “Application of Gel Dosimetry,” Journal of Physics, Vol. 3, No. 3, 2004, pp. 58-77. doi:10.1088/1742-6596/3/1/007
- P. M. Fong, D. C. Keil, M. D. Does and J. C. Gore, “Polymer Gels for Magnetic Resonance Imaging of Radiation Dose Distributions at Normal Room Atmosphere,” Physics in Medicine and Biology, Vol. 46, No. 12, 2001, pp. 3105-3113. doi:10.1088/0031-9155/46/12/303
- M. H. Zahmatkesh, R. Kousari, S. Akhlaghpour and S. A. Bagheri, “MRI Gel Dosimetry with Methacrylic Acid, Ascorbic Acid, Hydroquinone and Copper in Agarose (MAGICA) Gel,” In: Preliminary Proceedings of DOSGEL Ghent, Ghent, 13-16 September 2004, pp. 13-16.
- Y. De Deene, “Essential Characteristics of Polymer Gel Dosimeters,” Journal of Physics, Vol. 3, No. 3, 2004, pp. 34-57. doi:10.1088/1742-6596/3/1/006
- Y. De Deene, C. Hurley, A. Venning, K. Vergote, M. Mather, B. J. Healy, et al., “A Basic Study of Some Normoxic Polymer Gel Dosimeters,” Physics in Medicine and Biology, Vol. 47, No. 19, 2002, pp. 3441-3463. doi:10.1088/0031-9155/47/19/301
- Y. De Deene, C. D. Wagter, W. D. Neve and E. Achten, “Artifacts in Multi-Echo T2 Imaging for High-Precision gel Dosimetry: I. Analysis and Compensation of Eddy Currents,” Physics in Medicine and Biology, Vol. 45, No. 7, 2000, pp. 1807-1823. doi:10.1088/0031-9155/45/7/307
- Y. De Deene, C. D. Wagter, W. D. Neve and E. Achten, “Artifacts in Multi-Echo T2 Imaging for High-Precision Gel Dosimetry: II. Analysis of B1-Field Inhomogeneity,” Physics in Medicine and Biology, Vol. 45, No. 7, 2000, pp. 1825-1839. doi:10.1088/0031-9155/45/7/308
- Y. D. Deene and C. D. Wagter, “Artefacts in Multi-Echo T2 Imaging for High-Precision Gel Dosimetry: III. Effects of Temperature Drift during Scanning,” Physics in Medicine and Biology, Vol. 46, No. 10, 2001, pp. 2697- 2711.
NOTES
*Corresponding author.