Open Journal of Geology
Vol.06 No.08(2016), Article ID:69508,11 pages
10.4236/ojg.2016.68053
Evaluating the Amount of Erodability and Sedimentation by Comparing Sediment Weight Model and PSIAC Experimental Model (Case Study: Lali Water Catchment, Khuzestan, Iran)
Abdolreza Alijani1*, Nader Kohansal Ghadimvand2, Mohsen Aleali1, Mohammad Reza Espahbod3, Ali Meysami4
1Department of Geology, Science and Research Branch, Islamic Azad University, Tehran, Iran
2Department of Geology, North Tehran Branch, Islamic Azad University, Tehran, Iran
3North Tehran Branch, Islamic Azad University, Tehran, Iran
4Department of Geology, Shahr-e-Ray Branch, Islamic Azad University, Tehran, Iran

Copyright © 2016 by authors and Scientific Research Publishing Inc.
This work is licensed under the Creative Commons Attribution International License (CC BY).
http://creativecommons.org/licenses/by/4.0/


Received 2 July 2016; accepted 2 August 2016; published 5 August 2016
ABSTRACT
The upstream water catchments are the main source providing sediments in rivers and sedimentary basins. The balance between the erosion phenomenon and the amount of sediment entering into the basin relies on the geometrical specifications and the morphology of the river along the water catchment direction and the amount and type of the sediments. The sedimentary feed of rivers and basins are changed for the sake of natural factors or human disturbances. The river and basin react against this change in that their shape, morphology, plan and profile get changed due to the increase or decrease of the input sediment into the basin. It is essential to know the sediment amount produced by erodability and sedimentation of upstream basins and effects of projects and also to evaluate the amount of sedimentary load in base studies, civil projects, optimizing rivers and dam construction studies specially calculating the amount of sediment amount entering into the dams’ reservoirs in order to take engineering decisions and related alternatives. Sediment Weight Model and PSIAC Experimental Model are recognized as two common methods calculating the amount of the produced sediment caused by erosion applied in this research. Holistically, these methods have been used and compared. Although the results are almost close to one another, more sediment load has been produced in PSIAC method. As more affective parameters are used to cause erosion and produce sediment in PSIAC experimental model, it is recommended to refer to the results of this method because they are closer to reality.
Keywords:
Erodability, Sedimentation, Water Catchment, Sedimentary Basin, The Sediment Weight Model, PSIAC Experimental Model

1. Introduction
Since phenomena including erosion, sediment and sedimentation are important in the rivers’ water catchments and the settlement of sediment load in sedimentary basins and engineering-civil projects specifically dams’ reservoirs, several studies have been done based on the significance of project and different methods of estimating the amount of sediment. Meanwhile, very few studies have been conducted to compare the methods and the models practiced to evaluate the type and amount of the parameters affectivity.
Lali area is situated in Khuzestan province in Iran. It is approximately 200 km farther from the north of Ahwaz, the province center, it covers 323 km2 surface area (Figure 1). From geological view point, it is located in the structural-sedimentary zone of the folded Zagros.
Erosion in rivers is considered from the surface quality and quantity view; however, engineering projects mostly pay attention to the quality factors. Quality factors include determining the water catchment properties and river bed, the amount, type and amount of transported sediments and changing the bed gradation. Changes
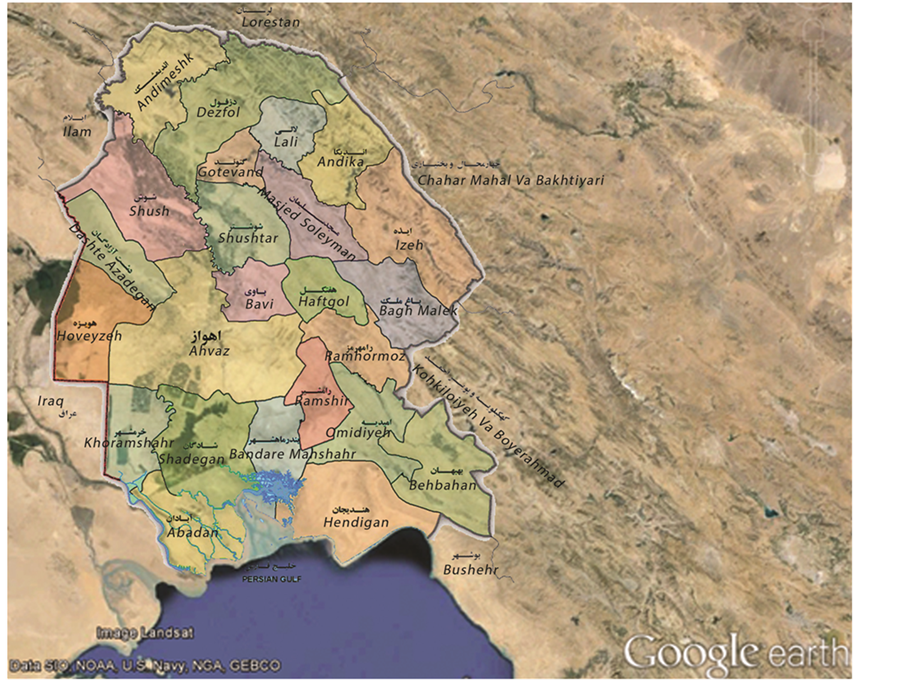
Figure 1. The geographical situation and the accessible ways to Lali area, from Google earth.
in the morphology of the river depends on the amount of sediment entering into the river and the sediment removing from the water catchment basin [1] . In addition, it is significant to scrutinize how the rivers erosion is affected by sedimentary load transportation of upstream, the plant coverage and geological and tectonic phenomena to analyze the eroding behavior in rivers’ sedimentation and its consequences [2] . In other words, it is possible to evaluate the sedimentary load produced by erosion and sedimentation by (Pacific Southwest Inter Agency Committee) PSIAC experimental method and the calculation of the sedimentary load method and other similar quality methods practiced in this research [3] .
The erosion amount of rock units and sediments transportation by transporting factors into sedimentary basins are identified as parameters determining the geomorphological characteristics and the specification of the accumulation and/or replacement of sedimentary masses [4] and [5] . In the sedimentary process, the erosion index of the area’s geological units and the determination of the sediment frequency in the area are calculated regarding the surface percentage of that unit in the intended area [6] .
Both the quality and quantity changes caused by sedimentation and erosion phenomena rely on the amount of its expansion and the situation of water catchment [7] . In this research, the water catchment is Karun River which is one of the largest water catchments in Iran (Figure 2).
Regarding the trend of global warming process and the extreme expansion of dry and semi-arid areas all across the world like Iran and irregular rainfall distribution in these areas within a year, it is significant to preserve and store water resources in dams’ reservoirs. Since a huge amount of run off in Iran flows into Khuzestan plain through Karun River, it is essential to control and store this amount of run off to be consumed in dry seasons of year [8] . Consequently, preserving dams’ reservoirs and lengthening their life span should be considered more in order to store more water resources. In addition, the amount of sedimentation in sedimentary basins and dams’ reservoirs need to be scrutinized as well. Eventually, factors affecting erosion and sedimentation in the intended areas should be analyzed and evaluated and the amount and the type of discharges with the amount of water entering into basins and reservoirs should be precisely identified [9] .
2. Review of Literature
Several base studies have been done in this regard, for example, various investigations have revealed the rela- tionship between sediments produced by water catchment basins with the climatic hydrologic and geomorphologic
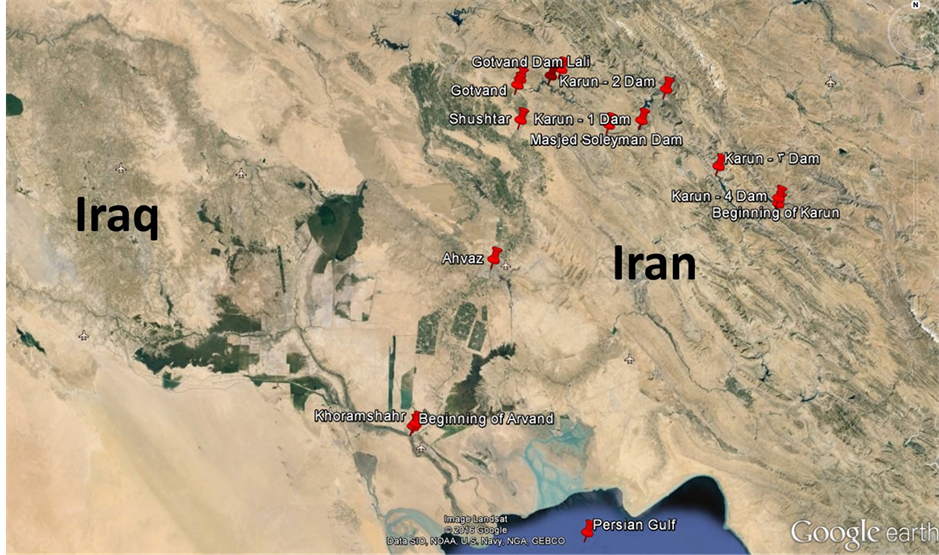
Figure 2. The situation of Taraz water catchment in Lali area, Khuzestan, Google earth.
factors. Norlan (1986) assessed the ratio of erodible formations as the origin of floating load in California [10] . Kasimir, et al (1990) demonstrated that small basins with the ratio of looser formations affect the floating sedimentary load [11] . Khojeini and Nezhadha Shami (1998) indicated the effect of erodible formations on sediment production in Taleghan, Iran water catchment [12] . Ghami Arusmahalleh and Aminsobhani (1998) proved the impact of sedimentation on marl and Shale erodible formations in Namak Lake of Iran [13] . Also, Ghadimi Arusmahalleh and Ghoddusi (1999) analyzed the statistics of 21 sedimentary measuring stations in Namak Lake water catchment in a twenty two-statistical-cycle and indicated that the relationship between the floating sediment regression with water discharge is an exponential model [14] . Assessing the particular floating sediment in Namak Lake water catchment figured out that its changes range from 50 to 600 ton/km2 per year. The most floating sediment dispersion was scored in ranges less than 250 ton/km2 related to areas made of strong rocks including granite and andesite. As they have less sensitivity to erosion, they produce low amount of sediment. Furthermore, erodible geological formations highly affect sedimentation in water catchments. Moreover, the amount of sedimentation relies on the surface area of the water catchment basin and the surface ratio of the erodible formations out of the whole basin. In fact, the run off discharge and the basin surface are recognized as the most important factors affecting the discharge and sediment. Thus, when the discharge gets increased in the area, the amount of sedimentation will be enhanced.
3. Methodology
The statistics of the concentration of the sedimentary materials in the surrounded rivers of the intended area in Karun water catchment was evaluated to scrutinize the amount of sediment in this area. In sequence, rivers featuring an acceptable and accurate statistical cycle were chosen and their sediment statistics analyzed. Investigations and evaluations in Karun River water catchment contributed to consider the results of the studies in rivers and stations of this area. Stations with proper sediment statistics were selected to be analyzed.
All the statistics related to sediment sampling in the selected stations were collected, controlled and amended.
The average amount of transported sediments of Karun River, especially in more influential stations such as Gotvand and Godarlander were assessed by PSIAC experimental method and the calculation of the sedimentary load method. The approximate amount of erosion of the basin between the aforementioned stations was calculated which were mainly related to the sub-water catchment of Shur River. Due to the available samples and removing unrelated points, the correlation relations between water discharge in m3/s and the weight of water sedimentary materials in ton/day were obtained in all intended rivers.
4. Sedimentary Setting
The ratio of these parameters are needed to be precisely depicted in order to determine the most suitable conditions of points and the best correlation equation between the weight of the daily transported sediments and water discharge in the measured samples for different rivers.
Studies on the relationship between these parameters imply that the best correlation equations between water discharge and the amount of the daily transported sediments of rivers are obtained from exponential Equation (1) [15] .
Since many of the statistical samples taken from the intended stations are related to the situations in which the river was in base flow, the best correlation equation (Equation (1)) was drawn in order to achieve real calculations and more reliability from Equations (2) as an exponential one and under the above conditions, this covers 95% of the measured samples. These equations are shown in the mentioned figures.
Regarding the studies and investigations, the calculated amounts of sediment by Equation (1) were closer to the observed lowest amounts. In other word, it has tried to make more reliability.
Based on (United States Bureau Reclamation) USBR method and the curve of daily continual water discharge, the intended rivers were calculated once by Equation (1) and second time by Equation (2) in order to specify the yearly weight average of the sediments transported by the rivers. The calculations show that the annual erosion for Shalu Bridge, Gotvand and Godarlander can be determined.
4.1. Determining the Amount of Sediment by Weight Model Method
Remarking the calculations, special erosion in the selected rivers based on Equation (2) are varied from 260 ton/km2 per year in Kabkian River in Batari station to 581 ton/km2 per year in Kharsan River in Barez station. The calculated amount of sediment based on Equation (1) implies water sediment in low discharge cycles and when the river water is pure [16] . The calculated amount of sediment based on Equation (2) has been close to the maximum amounts of the measured sediment samples which is reliable for designing purposes [17] .
The weight amount of the sedimentary materials transported and entered into from Shur (Lali) river can be calculated by depicting the daily continual irrigation curve of Karun River to the average difference of the weight of the annual sediment at Godarlander and Gotvand stations of Karun. This graph shows the previous and current situation of Shur (Lali) to it.
So, the annual long-term sediments were calculated at Gotvand and Godarlander stations by the curve of long-term continual water discharge.
Table 1 summarizes the results related to the calculations of the annual average of the sedimentary materials transportation in the intended rivers in Lali area.
According to the amounts recorded in this table, the correlation equation between water catchment levels in km2 and the annual weight of the transported sediments in ton is obtained as the equation below:
 (1)
(1)
The source of the equation is based on the measured local data and the statistics measured in the rivers of the intended area. These data include the amounts of the surface of the water catchment (A) and the average of the annual weight (Qs). These data have been drawn in EXCEL and Equation (1) has been achieved from the correlation relation between these two parameters. It should be considered that this equation has been calculated and obtained from the base discharge and the least amount of river water.
Figure 3 depicts this equation.
This equation estimates that 170 ton of erosion and sedimentary materials will be expected from Harkesh River water catchment to the central situation of the intended area (Taraz dam) which is equal to special erosion more than 530 ton/km2 per year.
On the other hand, the equation below calculates the two-variable-correlation relation between the amount of the annual run off in million m3 and the surface area of the water catchment with the annual weight of the transported sediment of the basin in ton/km2.
 (2)
(2)
The source of the equation is based on the measured local data and the statistics measured in the rivers of the intended area. These data include the average of the annual weight (Qs), the amounts of the surface of the water catchment (A) and the volume of the annual runoff (Qw). These data have been drawn in EXCEL and Equation (2) has been achieved from the correlation relation between these three parameters. It should be scrutinized that this equation has been calculated and obtained from the maximum discharge entering into the stations and rivers if the area.

Table 1. The annual average amounts of the specific gravity discharge of sediments in the intended rivers in Lali area.

Figure 3. The correlation relation between basin surface and annual sediments in the intended rivers in Lali area.
This equation has been also applied to estimate the average of the annual run off according to the water catchment area in Harkesh River. Special sediment more than 500 ton/km2 has been calculated for this area.
According to the fact that the huge part of the weight difference of the annual transported sediments until Gotvand and Godarlander stations are related to the sediments transported from Shur (Lali) river to Karun, the annual approximate amount of the transported sediments related to Shur river can be calculated as below:
The weight average difference of the annual sediments in Godarlander and Gotvand stations:
ΔQs = 1,878,390 ton per year,
ΔA = 3848.
The water catchment surface difference between Godarlander and Gotvand stations:
ΔA = 3848.
Hence, the special sediment relate to the water catchment between Godarlander and Gotvand stations will be 488 ton/km2 per year which the main part of this sub-basin is related to Shur river sub-basin.
4.2. Experimental Estimation of Sediments Using PSIAC
The minimum and maximum scores have been recommended for nine important factors affecting the erosion. The amount of the erosion potential of the water catchment will be calculated by the sum of scores and determination of the whole score.
Table S1 presents the nine important factors, the co-efficiencies approximation and significant factors identifying the approximation score of each one of these nine factors (Table S1 is in the Appendix).
It should be pointed out that the amended PSIAC method suggests to use the above mentioned experimental formulas along with identifying and evaluating the quality factors of all the nine factors in order to exactly determine the score related to each factor.
The main points affecting erosion are as the following: surface geology, soil, weather, run off, unpaved areas, plant coverage, ground usage, high lands erosion, river erosion and sediment transportation [18] .
Table S2 presents the scores given to each factor and the method or the reason of its quality estimation (Table S2 is in the Appendix).
5. Discussion
Geological studies in Lali area have featured out the amount and the percentage of different units of rock coverage expanded on the surface of the sub-basins. The potential of each of the aforementioned units has been identified from the viewpoints of permeability and erosion based on the evaluations and field studies.
According to the fact that the statistical data of the measuring stations of the rivers and other related data are mainly taken from the governmental organizations and their sub-consulting companies at the time intervals from every five to ten years, the data of this research have been used from the ones measured in 2009. Since the tolerance of the data hasn’t been remarkably changed in comparison to the similar conditions within the few decades ago, these data are reliable and can be applied in this research.
Based on the studies on Lali water catchment, this area consists of the following rock coverage:
・ -lime stone (Asmari and Sarvak) = 42% of very low erosion.
・ -Shale and marl (Pabdeh Gurpi) = 13% of very high erosion.
・ -Aghajari = 10% of high erosion.
・ -Quaternary deposits = 7% of very high erosion.
・ Bakhtiary conglomerate = 23% of low erosion.
・ -Gachsaran = 5% of very high erosion.
On the surface of the sub-basin of Taraz dam, about 25% of the water catchment has very high erosion, 10% of the basin scores high erodability, 23% reflects low erodability and 42% of the surface of the water catchment shows very low erodability [19] .
According to Table S2, the score related to the ground geology is 10 for very high sediments, 5 for moderate sediments and zero for low ones.
As observed in the description column of Table S2, the total sum of the score related to Lali water catchment was calculated 4.4 by scoring 10 for very high sediments, 8 for the high sediments, 5 for moderate sediments, 3 for low sediments and finally 1 for very low sediments [20] .
Remarking the results of field and local observations and evaluations, the soil texture of the basin has been assessed as the moderate one from the erosion point of view and it was scored 5. (The water catchment embraces moderate texture, dispersed boulders and limy and sandstone layers.)
The score related to the plant coverage of the area’s water catchment was specified based on the area observations and investigations in accordance with the estimation of the percentage of the hard lands and without coverage. The formula suggested by the amended PSIAC method is as the following:

where:
Pb = the percentage of the hard lands.
X = the score related to the condition of the ground coverage.
It should be considered that the presence protects the plant coverage and humus and prevents erosion. Holistically, parts of the lands without these types of coverage are more exposed to soil erosion. These parts of lands are regarded as the lands without coverage and hard ones. The plant coverage of the basined is scored 7 according to the percentage estimation of the hard and without plant coverage.
Based on the relation suggested in the amended PSIAC method recorded in the related table, the usage of the lands of Lali area water catchment is calculated by the following formula:

Where:
b: the percentage of the plant coverage (including farms and pasture).
X = usage of the basin lands.
Consequently, the results of the area investigations, the amount of the above co-efficiency was calculated 5.
Remarkably, a huge amount of these sediments are entered and settled into the lake at the back of the dam due to the hydrological rules in the reservoir and the activity of the stop holders of dam body. Coarse grain sediments as size as pebble and gravel are usually deposited at the entrance of the reservoir because as the river is entered into the reservoir, the speed of its flow is reduced, the floating load moves through the reservoir in form of a concentrated flow and it is gradually deposited [21] .
It should be remarked that sedimentary materials are settled in various conditions. In fact, they are sampled, collected and analyzed for different purposes like physical, chemical and environmental investigations and identifying other affective parameters. According to the natural properties of sediments in various samples, different methods are suggested to collect, evaluate and choose them. The most suitable method is chosen based on the area, the sampling location and the purposes of sampling.
6. Conclusion
Remarking the available information and area investigations, no wind erosion has been observed in the basin. Thus, the main erosion is the water one and the wind erosion affects the area the least. Although this is demonstrated in Khuzestan water catchment, it is negligible in the intended area. Water erosion has been occurred as the sheet (layer) one and somehow the plough erosion for the sake of intensive short-term rainfalls in the area, deep slopes regions, lack of plant coverage and the coverage of the water catchment of the fine and erodible for- mations of Lali area. Regarding the amounts, the total sum of the basin scores has been calculated (R = 64.5). The average amount of the annual erosion can be estimated in the basin. Considering the scores sum related to the sediment, the erosion amount of the water catchment erosion is equal to 390 m3/km2 per year. The specific gravity of the sedimentary materials is equal to 1.3 ton/m3 and the erosion amount of the water catchment is more than 500 ton/km2 per year. Furthermore, rains with high intensity in short time are identified as the main reason of flooding in water catchments. Consequently, a great deal of materials and coarse grain sedimentary materials are separated from the water catchments like boulder, pebble, sand, gravel, silt and clay. Conclusively, more sedimentology studies should be done to investigate the physical and chemical properties of the sediments deposited in the reservoir. Hence, it is significant to scrutinize the disturbed and undisturbed samples, the condition of sediments settlement and removing sediments from the reservoir by different methods.
7. Suggestions
Regarding the studies and observations in erosion phenomenon, sedimentation and sediment accumulation in the sedimentary basins and dams’ reservoirs, the following items are suggested:
・ These basins are precisely assessed to investigate the amount of sediment production in the geological formations situated in water catchments directing into identify formations ready to be eroded.
・ Figuring out factors affecting the erosion process is led into selecting the most convenient methods to diminish the effect of these processes and control its harmful effects in the intended area before starting any civil project specially dam construction studies.
・ Base studies on the amount of sediment discharge into dams’ reservoirs are directed into identifying factors affecting the increase of sedimentary load with water entering into reservoirs. Proper alternatives are taken to reduce its harmful effects through analyzing the data of these studies.
Acknowledgements
The author would like to highly appreciate all the ones, companies, researchers and scientific experts who contributed to prepare this research, Islamic Azad University Science and Research of Tehran and the dean of geology department, Dr. Ali Solgi. The author also thanks the water and electricity organization of Khuzestan for the sake of their contribution. The author respectfully appreciates the head manager of Ab-Niru consultant engineering, Dr. Hussein Jalali and the technical exclusive manager of Ab-Niru consultant engineering, Engineer Hasan Nabavi.
Cite this paper
Abdolreza Alijani,Nader Kohansal Ghadimvand,Mohsen Aleali,Mohammad Reza Espahbod,Ali Meysami, (2016) Evaluating the Amount of Erodability and Sedimentation by Comparing Sediment Weight Model and PSIAC Experimental Model (Case Study: Lali Water Catchment, Khuzestan, Iran). Open Journal of Geology,06,692-702. doi: 10.4236/ojg.2016.68053
References
- 1. Annandale, G.W. (1987) Reservoir Sedimentation. Elsevier, Amsterdam.
- 2. Veatot, D., et al. (2005) Predicting Soil Erosion and Sediment Field at the Basic Scale Issue and Sediment-Quantitatine Models. Earth Science Reviews, 71, 95-125.
http://dx.doi.org/10.1016/j.earscirev.2005.02.002 - 3. Solaimanik, S., et al. (2009) Investigation of Land Use Charges on Erosion Process Using Geographical Information System.
- 4. Nabavi, M.R. (2005) Report on General Geology and Engineering of Taraz Dam. Ab-Niru Consultant Engineers Company, Tehran.
- 5. Feiznia, S. (1995) Rocks Resistance against Erosion in Different Climates of Iran. Journal of Natural Resources, 47, 95-116.
- 6. Colman, D.J., et al. (1986) Identification and Evaluation of Sediment. IAHS, New York.
- 7. Parker, G. (1990) Surface Based Bed Load Transport Relationship for Gravel Rivers. Journal of Hydraulic Research, 28, 417-436.
http://dx.doi.org/10.1080/00221689009499058 - 8. Ghadimi Arusmahalleh, F., et al. (1998) Analyzing the Floating Sediments in Namak Lake Watershed. Pazhuhesh and Sazandegi.
- 9. Aminsobhani, F., et al. (1998) A Study on Zones’ Sedimentation and Geological Eras in Namak Lake Watershed. Pazhuhesh and Sazandegi, 36-41.
- 10. Khojeini, A. and Nezhadhashemi, M.A. (1998) A Study on Sediment Production in Taleghan Watershed. Pazhuhesh and Sazandegi, 10-13, 39.
- 11. Kasimir, M., Besar, I. and Sowa, A. (1995) Influence of Geology of Erosion and Sediment Yield, Human Activities of the Environment in Selected Areas in Southern Nigeria. Sixth International Symposium on River Sediment, New Delhi.
- 12. Nolan, K.M., Janda, R.J. and Galton, J.H. (1986) Sediment Source and Sediment-Transport Curves. Processing of the Fourth Federal Interagency Sedimentation Conference, Las Vegas, 4-79.
- 13. Simon, D.B., et al. (1977) Sediment Transport Technology. Water Resources Publications, Front Collins.
- 14. Colby, B.R. (1964) Practical Computation of Bed-Material Discharge. Journal of Hydraulics Division, 90.
- 15. Yang, C.T. (1977) The Movement of Sediment in Rivers. Geophysical Survey, 39-68.
http://dx.doi.org/10.1007/BF01449182 - 16. Refahi, H. and Nematti, M. (1995) Erodability Assessment of the Alamoun Sub Catchment and Its Effect on the Sediment Yield. Journal of Agriculture Sciences, Iran, 26, 48-56. (In Persian).
- 17. Walling, D.E. (1996) Suspended Sediment Transport by Rivers: A Geomorphological and Hydrological Perspectives. Arc. Hydrobiol. Spec. Issues advance Limnol., 47, 1-27.
- 18. Schwab, G., et al. (1981) Soil and Water Conservation Engineering. John Wiley Inc., New York.
- 19. Safamanesh, R., Azmin Sulaiman, W.N. and Ramli, M.F. (2006) Erosion Risk Assessment Using an Empirical Model of Pacific South West Inter Agency Committee Method for Zargeh Watershed, Iran. Journal of Spatial Journal Hydrology, 6.
- 20. Gavrilovic, Z. (1988) The Use of an Empirical Method for Calculating Sediment Production and Transport in Unsuited or Torrential Streams. International Con. for Review Regime, 411-422.
- 21. Bryan, B.R., et al. (1989) Run off and Sediment Discharge in Semi-Arid Ephemeral Drainage Basin, ZEIT. Geomorph. W.F. Supp. Bd., 58, 121-143.
Appendix
Table S1. The score of each nine factors in various conditions.
Table S2. Estimating the scores to erosion factors using PSIAC method in Harkesh river catchment to the central situation of the intended area (basin surface = 323.5 km2).
Score sum: 64.5. Regarding the amounts, the total sum of the basin scores has been calculated 64.5. The average amount of the annual erosion can be estimated in the basin. Qs = 38.77 exp (0.0358R). where: R: the sum of the scores; Q: the erosion amount of the basin in m3/km2 per year.

Submit or recommend next manuscript to SCIRP and we will provide best service for you:
Accepting pre-submission inquiries through Email, Facebook, LinkedIn, Twitter, etc.
A wide selection of journals (inclusive of 9 subjects, more than 200 journals)
Providing 24-hour high-quality service
User-friendly online submission system
Fair and swift peer-review system
Efficient typesetting and proofreading procedure
Display of the result of downloads and visits, as well as the number of cited articles
Maximum dissemination of your research work
Submit your manuscript at: http://papersubmission.scirp.org/
NOTES

*Corresponding author.