Open Journal of Geology
Vol.4 No.2(2014), Article ID:43077,14 pages
DOI:10.4236/ojg.2014.42005
Hydrogeochemical Characteristics and Assessment of Water Resources in Beni Suef Governorate, Egypt
1Department of Geological Sciences, National Research Centre, Dokki, Egypt
2Department of Geology, Faculty of Science, Cairo University, Giza, Egypt
3Central Laboratory for Environmental Quality Monitoring, National Water Research Center, Kanater El-Khairia, Egypt.
Email: amelegy@yahoo.com, amkammar@hotmail.com, saliha.achi@yahoo.fr, ghadeer.miro@gmail.com
Copyright © 2014 Ahmed Melegy. This is an open access article distributed under the Creative Commons Attribution License, which permits unrestricted use, distribution, and reproduction in any medium, provided the original work is properly cited. In accordance of the Creative Commons Attribution License all Copyrights © 2014 are reserved for SCIRP and the owner of the intellectual property Ahmed Melegy. All Copyright © 2014 are guarded by law and by SCIRP as a guardian.
Received December 17, 2013; revised January 15, 2014; accepted January 23, 2014
KEYWORDS
Beni Suef; Surface Water; Groundwater; Hydrogeochemical Characteristics; Heavy Metals
ABSTRACT
The main target of this research is to investigate the hydrogeochemical characteristics of surface and groundwater resources in Beni Suef Governorate, Egypt. A combination of major and heavy metals has been used to characterize surface and groundwater in Beni Suef Governorate, Egypt. Twenty water samples were collected from the water resources: River Nile, El-Ibrahimia canal, Bahr Youssef, irrigation and drainage channels and Quaternary aquifer. The collected water samples were analyzed for major and heavy metals. Surface and groundwater in the study area are considered potable for drink and irrigation based on the TDS and major ions concentrations. Regarding the MPL quoted by the WHO [1] and FAO [2], water resources in the study area are polluted by Al, Cd, Fe, Mn, Co and Cu. The highest concentrations of Al, Cd, Fe, Mn, Co and Cu recorded in the study area were 2545, 400, 1415, 2158, 239 and 1080 µg/l, respectively. Both surface and groundwater in Beni Suef suffer from pollution due to the impact of unsupervised anthropogenic activities including: fertilizers and pesticide, waste disposal and industrial waste, seepage from septic tanks, construction of water pipes, wastewater from El-Moheet drainage and evaporation processes during flood irrigation.
1. Introduction
Pollution of the environment is one of the major concerns throughout the universe, which could originate by several ways such as continuous discharging of the large variety of toxic inorganic and organic chemicals into the environment. This causes severe water, air and soil pollutions [3]. Contamination of water supplies by heavy metals has steadily been increased over the last decades, as a result of over population and expansion of industrial activities [4,5]. Sources of heavy metals in water comprise natural sources including eroded minerals within sediments, leaching of ore deposits and volcanic materials and anthropogenic sources such as solid waste disposals, industrial or municipal effluents and wharf channel dredging. Heavy metals in nature are not usually hazardous to the environment and human health as the amounts of them are not significant; furthermore some heavy metals are required at low concentrations as catalysts for enzyme activities in human body (Co, Cu, Fe, Mn and others). However, if the levels of these metals are elevated to higher than the normal ranges, they can cause malfunction and toxicity to human body [6].
Beni Suef Governorate within the Nile Valley occupies an area of approximately 10950 km2 bounded by the Eastern and Western Deserts. About 85% of the total populated area is agriculture land. Surface water, which is mostly represented by River Nile, El-Ibrahimia Canal and Bahr Youssef, is considered the major source in securing water requirements (drinking, irrigation and industry). 66% of drinking water is provided from surface water and 34% from groundwater.
Providing suitable water to Beni Suef Governorate is considered as the basic environmental issue that worries the population. That is associated with the different types of pollutants that affect the surface and ground water quality. Water resources (mainly surface water) at Beni Suef are currently threatened by contamination from municipal, industrial and agricultural pesticides. Most of the sewage water is discharged in irrigation canals and drains. The domestic sewage water in governorate is estimated about 163,000 m3 daily. Agricultural pesticides and wastewater enforce the major impact on degradation of groundwater quality in the study area [7].
The present work aims to assess the quality of water resources in Beni Suef in terms of major ions and heavy metals chemical analysis data with respect to human uses and irrigation.
2. Study Area
Beni Suef Governorate is located between latitudes 28˚45' and 29˚25'N and longitudes 30˚45' and 31˚15'E, occupying a part of the lower Nile Valley. It includes seven towns namely; Beni Suef (the capital), El-Wasta, Naser, Beba, Ihnasia, Somosta and El-Fashn (Figure 1). The surface on Beni Suef Governorate is built of sedimentary rocks and sediments; the exposed sequence is formed of Upper and Middle Eocene, Pliocene, Pleisto-
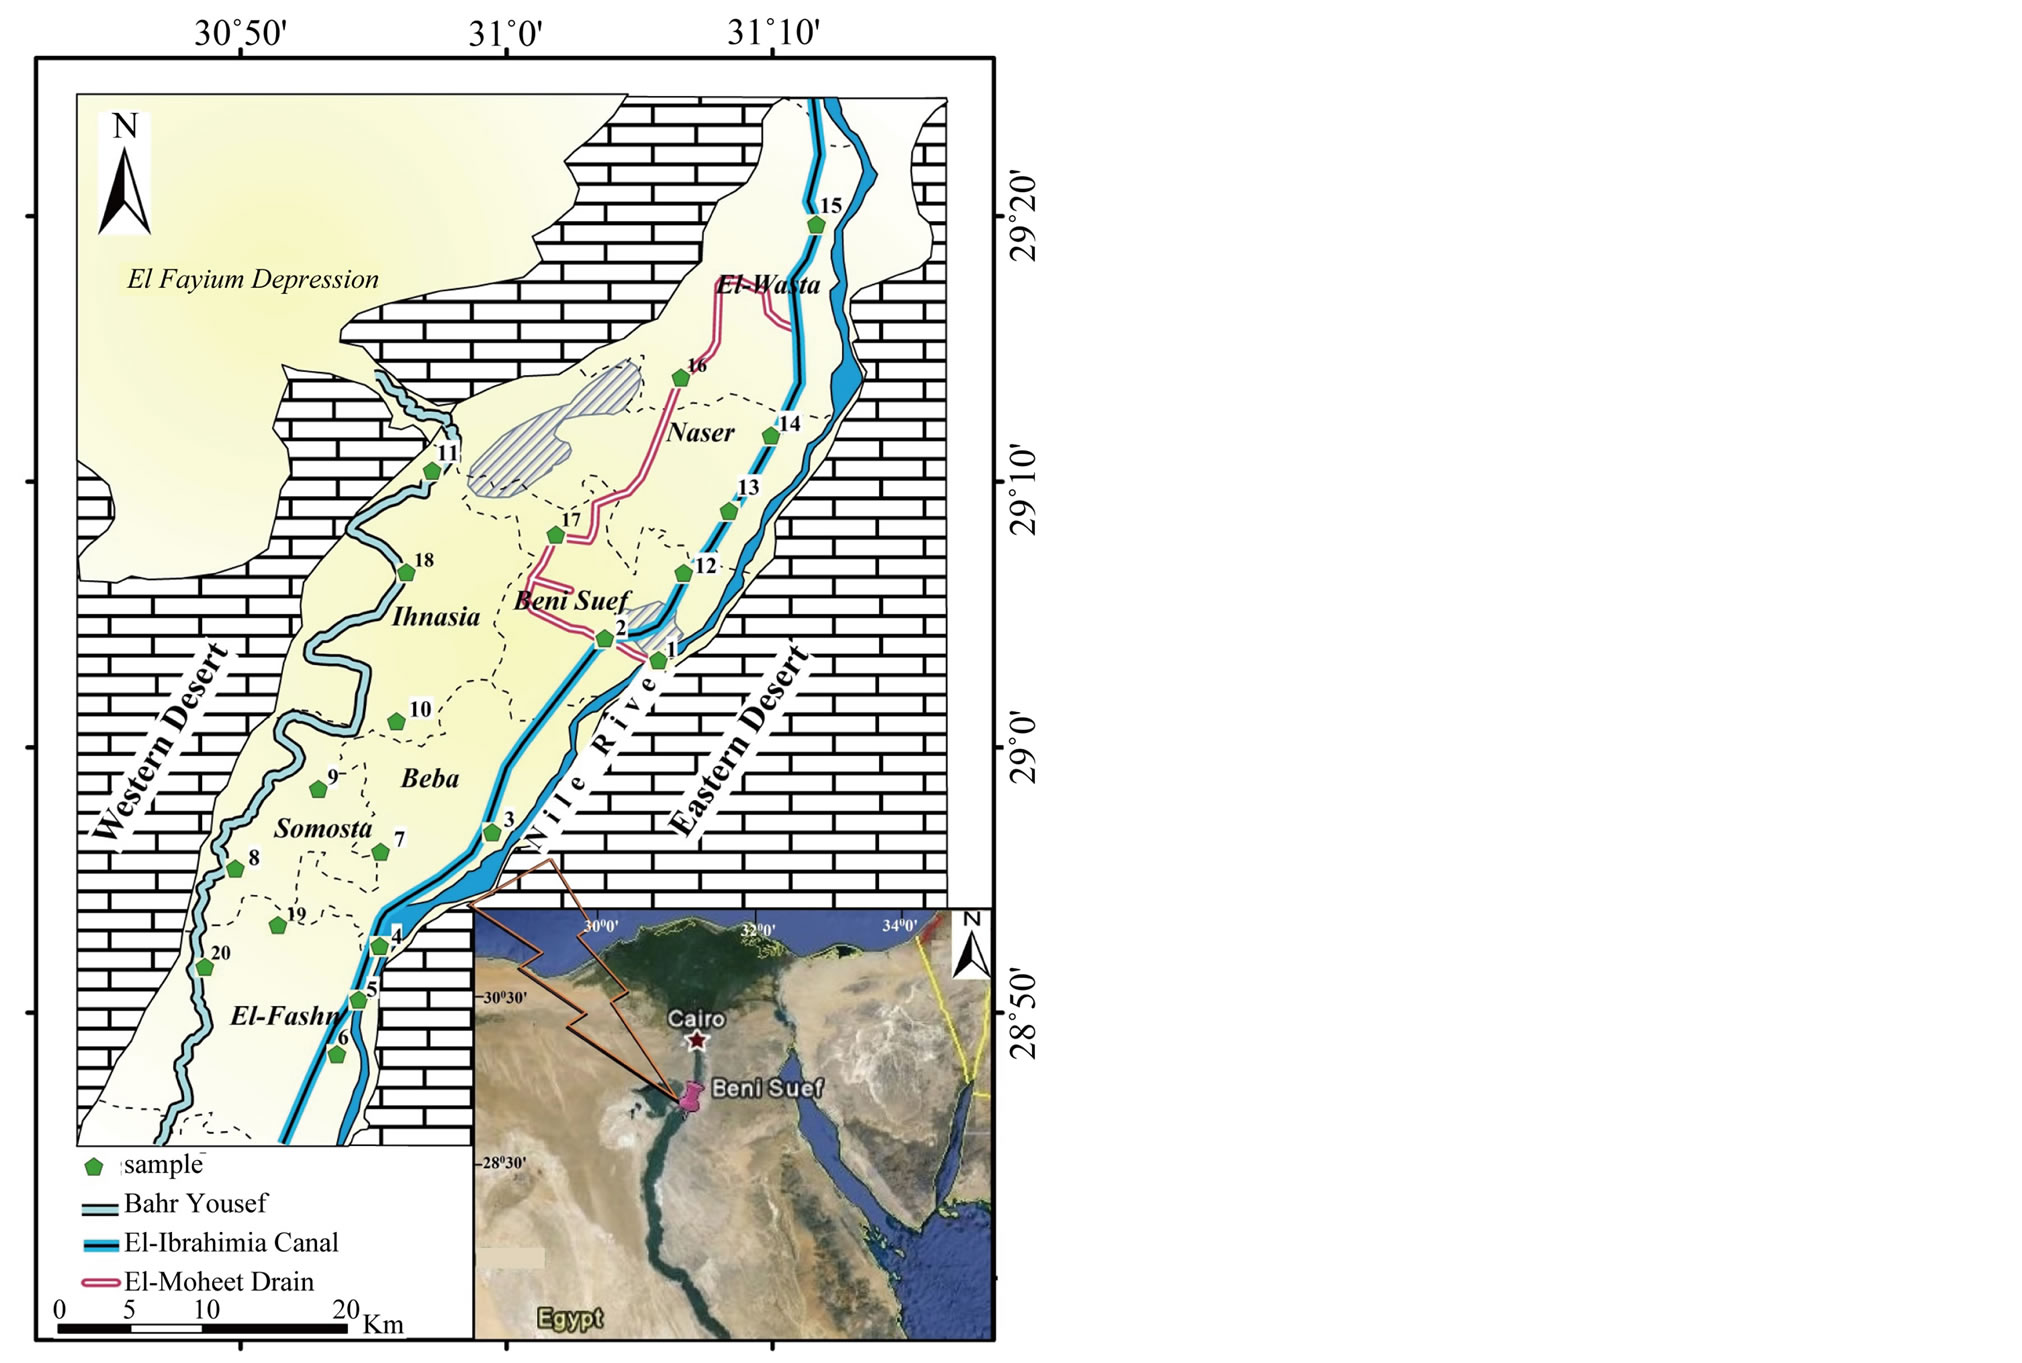
Figure 1. Location map of Beni Suef Governorate.
cene and Holocene rock units. The Eocene rocks are mainly composed of limestone rocks which are karstified in some places. The exposed Pliocene formations are made up of alternating conglomerate consisting of limestone, chert and quartz sand grains bounded together by a clay matrix and sandstone beds. The Pleistocene and Holocene deposits in the Nile Valley composed of gravel, sand, pebbly sandstone, sandy gravel beds and loose to fairly well indurated deposits of sand, silt and mud [8,9].
Beni Suef Governorate occurs within the arid to semiarid desert belt of Egypt. Its climate is characterized by a hot dry summer and mild very short winter with scarce rainfall. Dry winds with dust, traditionally known as Khamassen wind storms, are blown on Egypt from southwest.
As well known, the River Nile is the main perennial stream, which flows all over the year from south to north. It has the widest course in Beni Suef Governorate (100 to 500 m). Beni Suef Governorate uses 2 billion m3 of the River Nile water, 92% for irrigation, 3% for industry and 5% for drinking. As well as, two irrigation canals, namely; El-Ibrahimia canal and Bahr Youssef, run parallel to River Nile, provide the water for irrigation. The two canals were constructed along the western flood plain of the Nile Valley [7,10].
The yield of groundwater from the Eocene waterbearing rocks along the western slopes of Beni Suef area is very limited and the obtained water is saline with TDS ranging from 4500 to 6600 ppm [10].
Many wells were drilled and penetrated a considerable thickness of the Quaternary section. They provide the main supply of the groundwater for different uses in the area. The flow regime and the fluctuation regime indicate that the main sources of recharge is the seepage from the Nile water in the irrigation canals and drainage water in the drains and the direct infiltration of return flow after irrigation. While the River Nile acts as an effluent stream especially after the construction of the High Dam in 1966. The uncontrolled pumping of groundwater for drinking and irrigation purposes acts as main factor for decline and discharge beside the subsurface seepage into the drains and the River Nile.
3. Methodology
To get an idea on the water quality of Beni Suef and its suitability for drinking and irrigation, twenty samples were collected from the study area during one period on March 2013 (Figure 1). Eighteen samples were collected from different sources of surface water represented by; River Nile, El-Ibrahimia canal, Bahr Youssef as well as the irrigation and drainage channels (Table 1). That considered the main source in obtaining water supplies in the study area. Two groundwater samples were collected from wells on depths among 20 - 30 m. The boreholes

Table 1. Location of surface and ground water samples.
were pumped for about 5 minutes to purge the aquifer of stagnant water to acquire fresh aquifer samples for analysis. In addition, two soil samples were combined from positions 5 (El-Fashn) and 8 (Somosta) (Figure 1). A well-constrained Global Positioning System (GPS) was used for navigation to record the sampling sites accurately.
Water samples were taken in duplicate for major ions and heavy metals analyses.
They were collected in 1L plastic bottles rinsed three times and filled to the brim,
before sealing tightly to include as little air as possible in the top of the bottle.
Few drops of nitric acid were added only to the samples analyzed for heavy metals.
Physical examination of the water samples including temperature, pH, and electrical
conductivity was done in the field. The samples were preserved in a refrigerator
until they were transported to the laboratory for chemical analysis. Chemical analysis
was carried out in the Central Laboratory for Environmental Quality Monitoring,
Kanater El-Khairia, Egypt. The Inductively Coupled PlasmaMass Spectrometry (ICP-MS)
using to analyzed heavy metals (Al, As, Ba, Co, Cd, Cr, Cu, F, Fe, Mn, Ni, Pb, Sb,
Se, Sn, V and Zn) and major cations (Ca+2, Mg+2, Na+
and K+). Major anions concentrations (
 , Cl−
and
, Cl−
and ) were determined using Ion Chromatography
(IC). Gravimeteric method is being used to determine TDS. A well-mixed sample is
filtered through a standard glass fiber filter. The filtrate is evaporated and dried
to constant weight at 103˚C - 1050˚C. The GIS mapping technique was adopted
to highlight the spatial distribution pattern of major ions and heavy metals concentrations
in the surface water by using ArcGIS (version 9.2). Descriptive statistics, spearman
correlation and factor analysis among all the parameters were calculated using software
SPSS 16.
) were determined using Ion Chromatography
(IC). Gravimeteric method is being used to determine TDS. A well-mixed sample is
filtered through a standard glass fiber filter. The filtrate is evaporated and dried
to constant weight at 103˚C - 1050˚C. The GIS mapping technique was adopted
to highlight the spatial distribution pattern of major ions and heavy metals concentrations
in the surface water by using ArcGIS (version 9.2). Descriptive statistics, spearman
correlation and factor analysis among all the parameters were calculated using software
SPSS 16.
4. Results and Discussion
4.1. Surface Water
The surface water in the study area is generally alkaline with pH ranging between 7 and 7.9 (Table 2). The optimum range of pH, as proposed by WHO [1], is 6.5 - 8.5. The lowest value of pH (7) is recorded at River Nile mainly deduced as a result of organic matter oxidation; whereas pH values of 7.7, or higher, dominate in the other locations.
The EC values range from 319 to 1473 μS/cm (Table 2) and it is mutually distributed with TDS where the highest values dominate in the north and the intermediate values prevail in the west. The palatability of water with a TDS level of less than about 600 mg/l is generally considered to be good; drinking-water becomes significantly

Table 2. Descriptive statistics of the obtained data for surface water (n = 18). Note that major elements are given in mg/l while heavy metals in µg/l.
and increasingly unpalatable at TDS levels greater than about 1000 mg/l. The concentration
of TDS ranges between 204 and 943 mg/l, averaging 365 mg/l (Table 2). High contents exceeding
600 mg/l are only recorded in the northern part of the study area in El-Ibrahimia
canal at El-Wasta center (Figure 2). This concentration agrees with the
highest concentrations of major ions (Figures 3- 10). The TDS values are strongly correlated
with the major ions; Ca2+, K+, Mg2+, Na+,
Cl−,
 and
and , where r ranges from 0.76 with Mg2+
to 0.98 with
, where r ranges from 0.76 with Mg2+
to 0.98 with
 (Table 3)
due to the role of lithologic impact and evaporation.
(Table 3)
due to the role of lithologic impact and evaporation.
The main source of such exceeding’s can be interpreted to the wastewater coming from El-Moheet drainage. It is the main drainage in the governorate and associated with high number of sub-drainages. It receives high amount of untreated sewage water from treatment plant in Beni Suef city, as well as the wastewater from agricultural and industrial activities. In spite of this relative increase in the TDS content, the surface water in study area is generally considered to be good for drink (<1000 mg/l) and irrigation (<2000 mg/l).
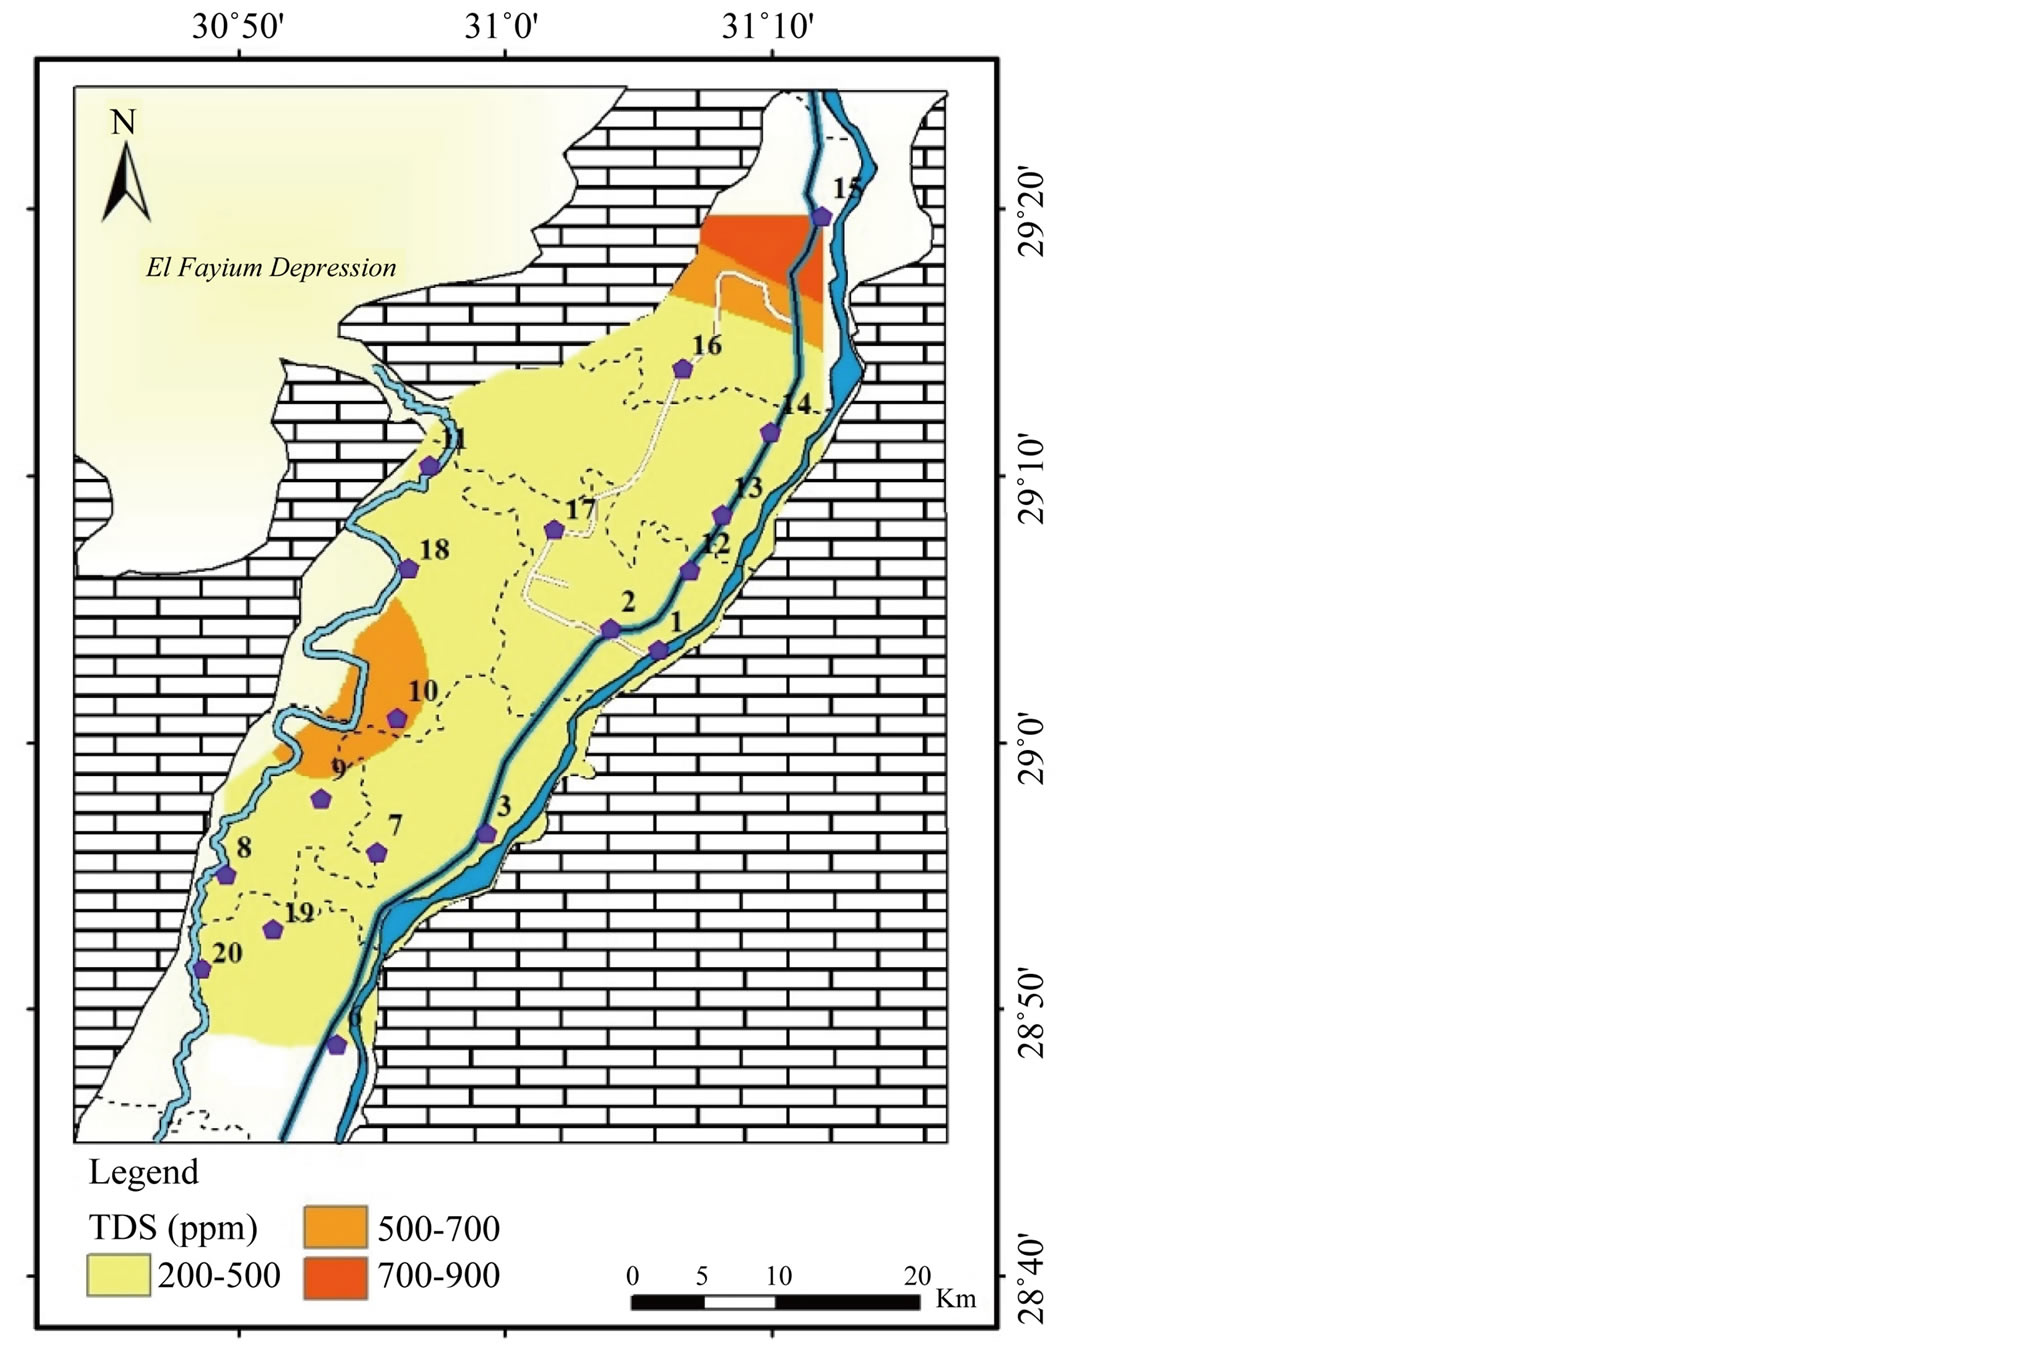
Figure 2. Geochemical map of TDS in the surface water in the study area.

Figure 3. Geochemical map of Na in the surface water in the study area.
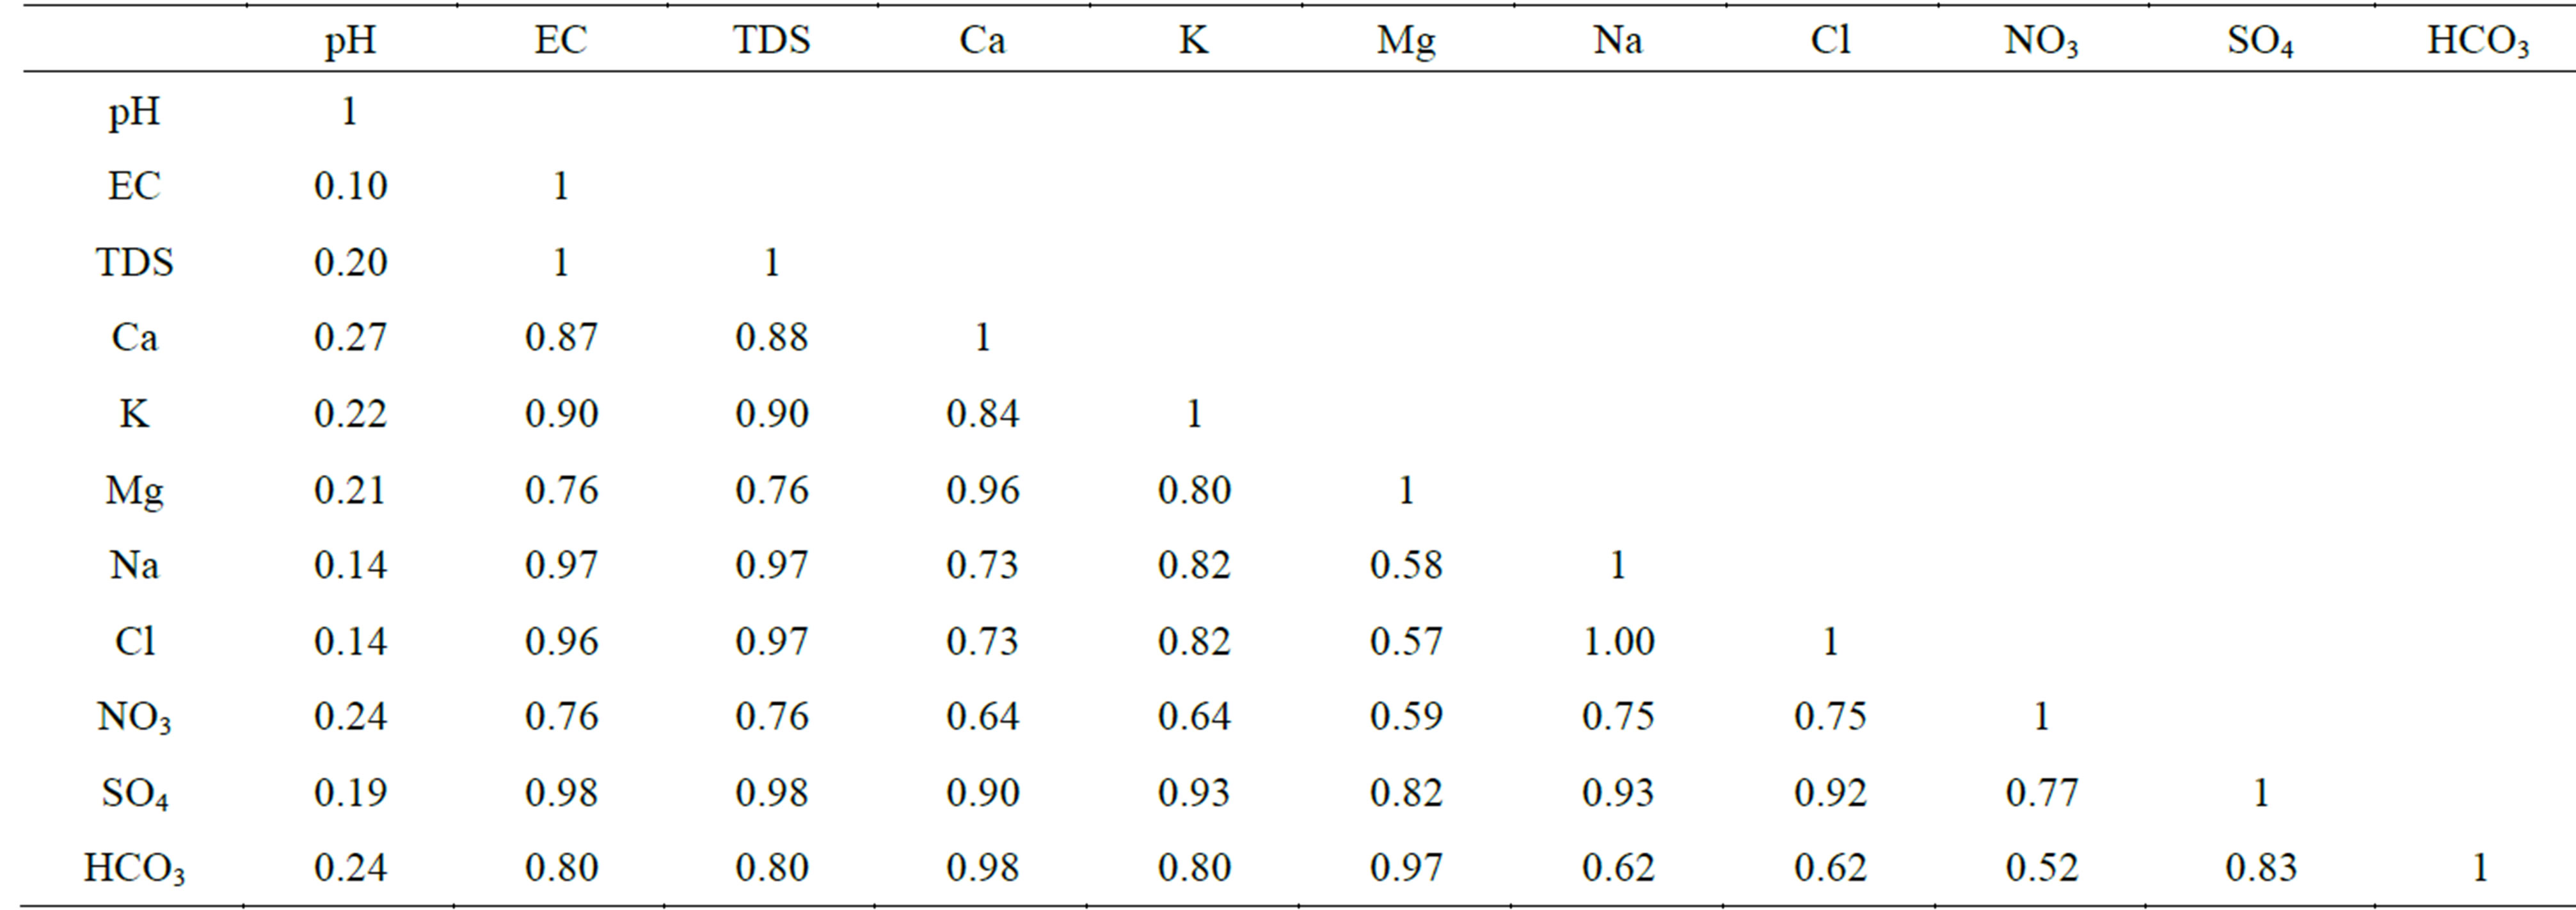
Table 3. Correlation coefficients among major parameters of surface water.
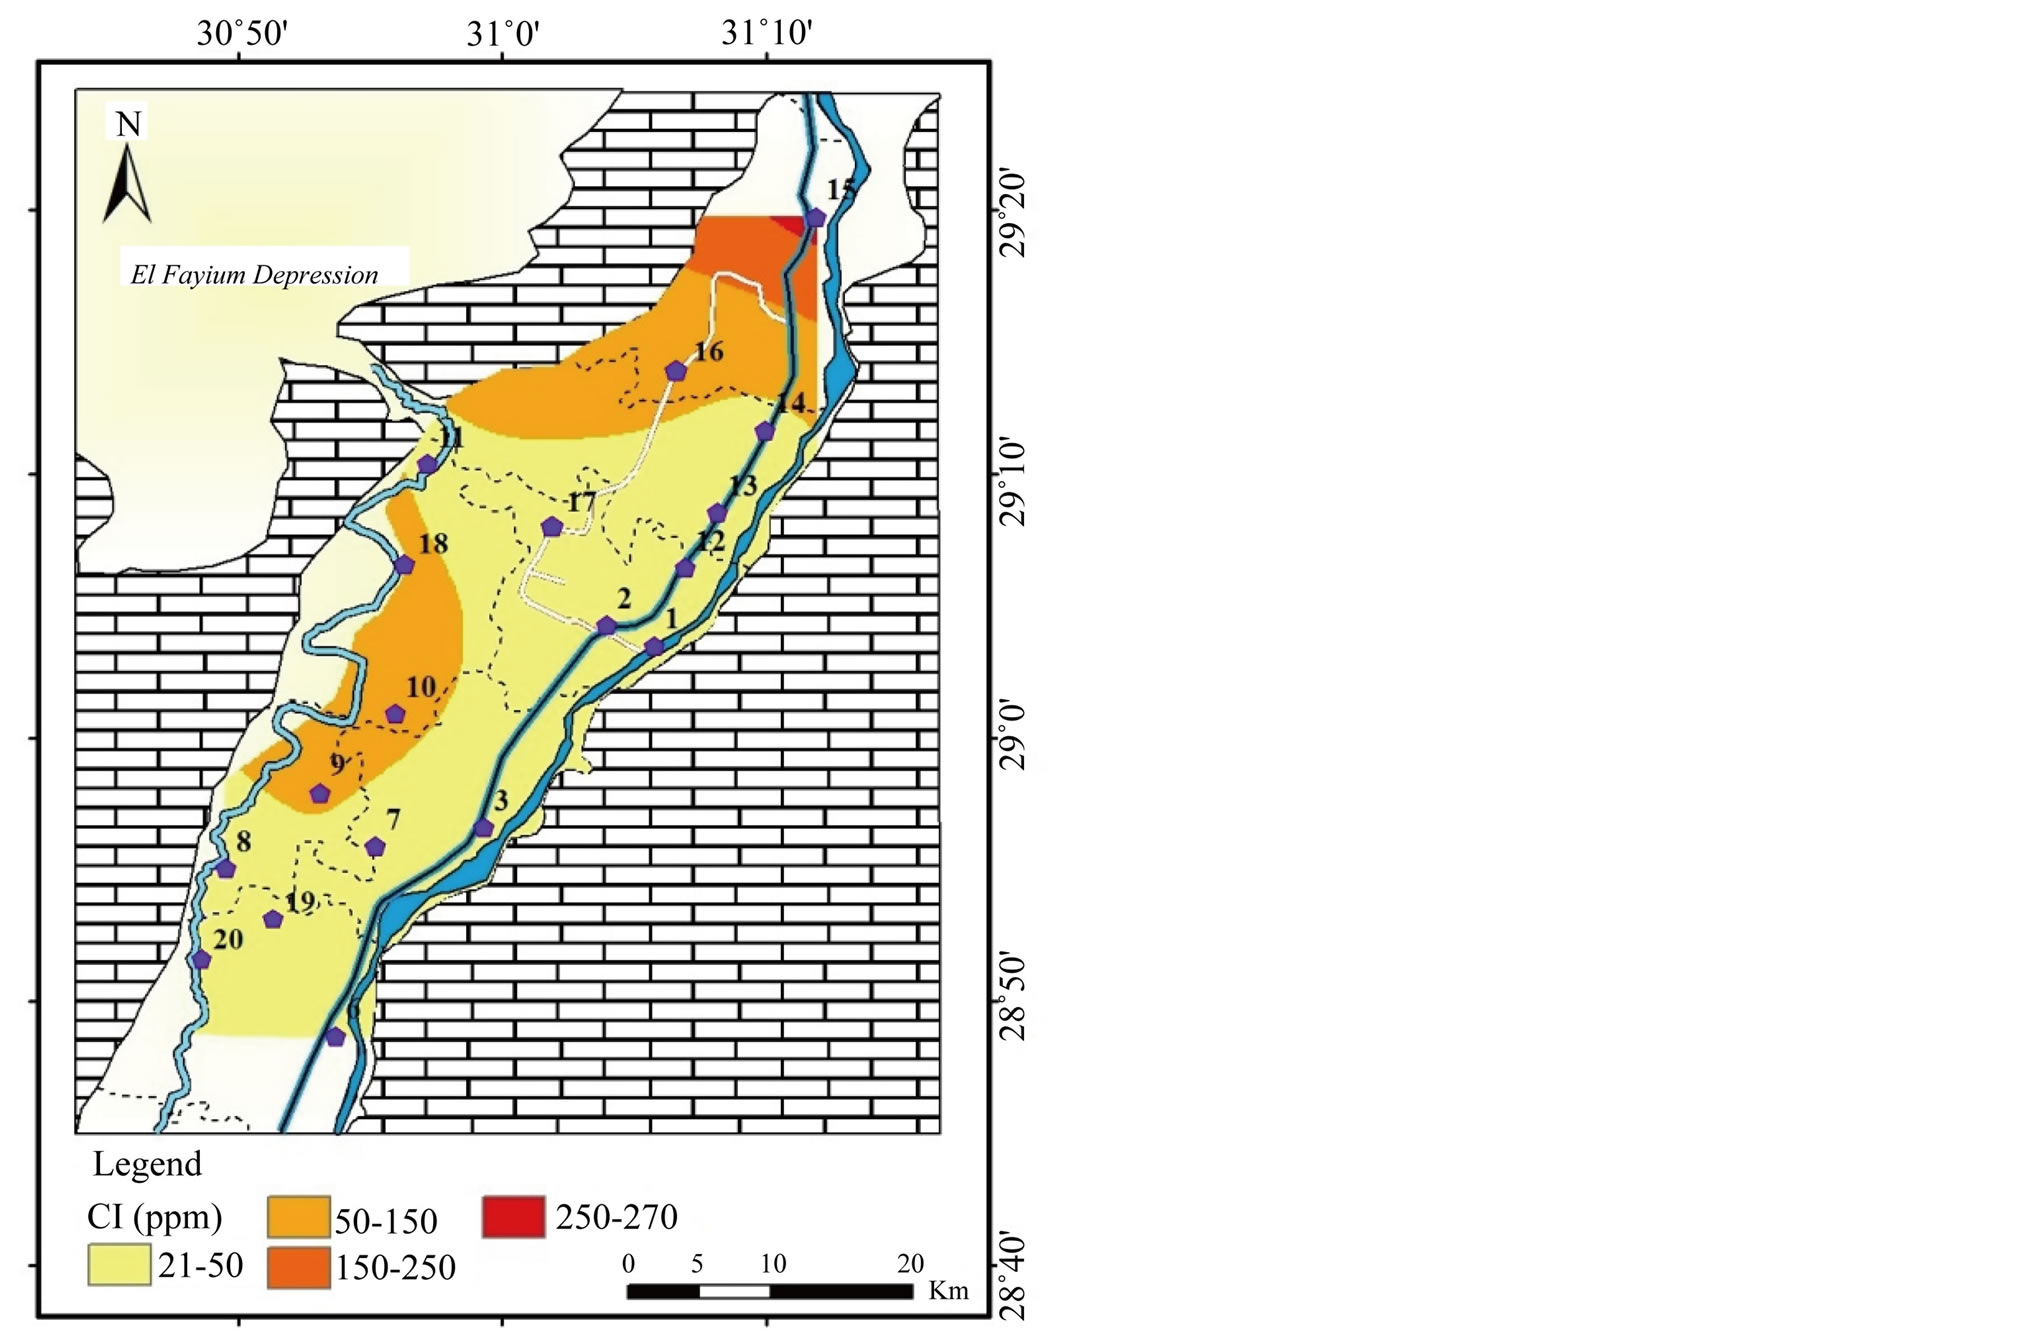
Figure 4. Geochemical map of Cl in the surface water in the study area.
4.2. Major Ions
The quantity of major ions (cations; Ca2+, Mg2+, Na+
and K+, and the anions; Cl−,
 ,
,
 and
and ) in water depends
primarily on the type of rocks or soil with which the water has been in contact
and the length of time of contact. Industrial effluents, irrigation drainage, fertilizers,
pesticide, septic tank, and other sources that result from the anthropogenic activities
are considered the additional sources of elements [11-13]. Relative to the distribution
of the highest concentration of major ions
) in water depends
primarily on the type of rocks or soil with which the water has been in contact
and the length of time of contact. Industrial effluents, irrigation drainage, fertilizers,
pesticide, septic tank, and other sources that result from the anthropogenic activities
are considered the additional sources of elements [11-13]. Relative to the distribution
of the highest concentration of major ions
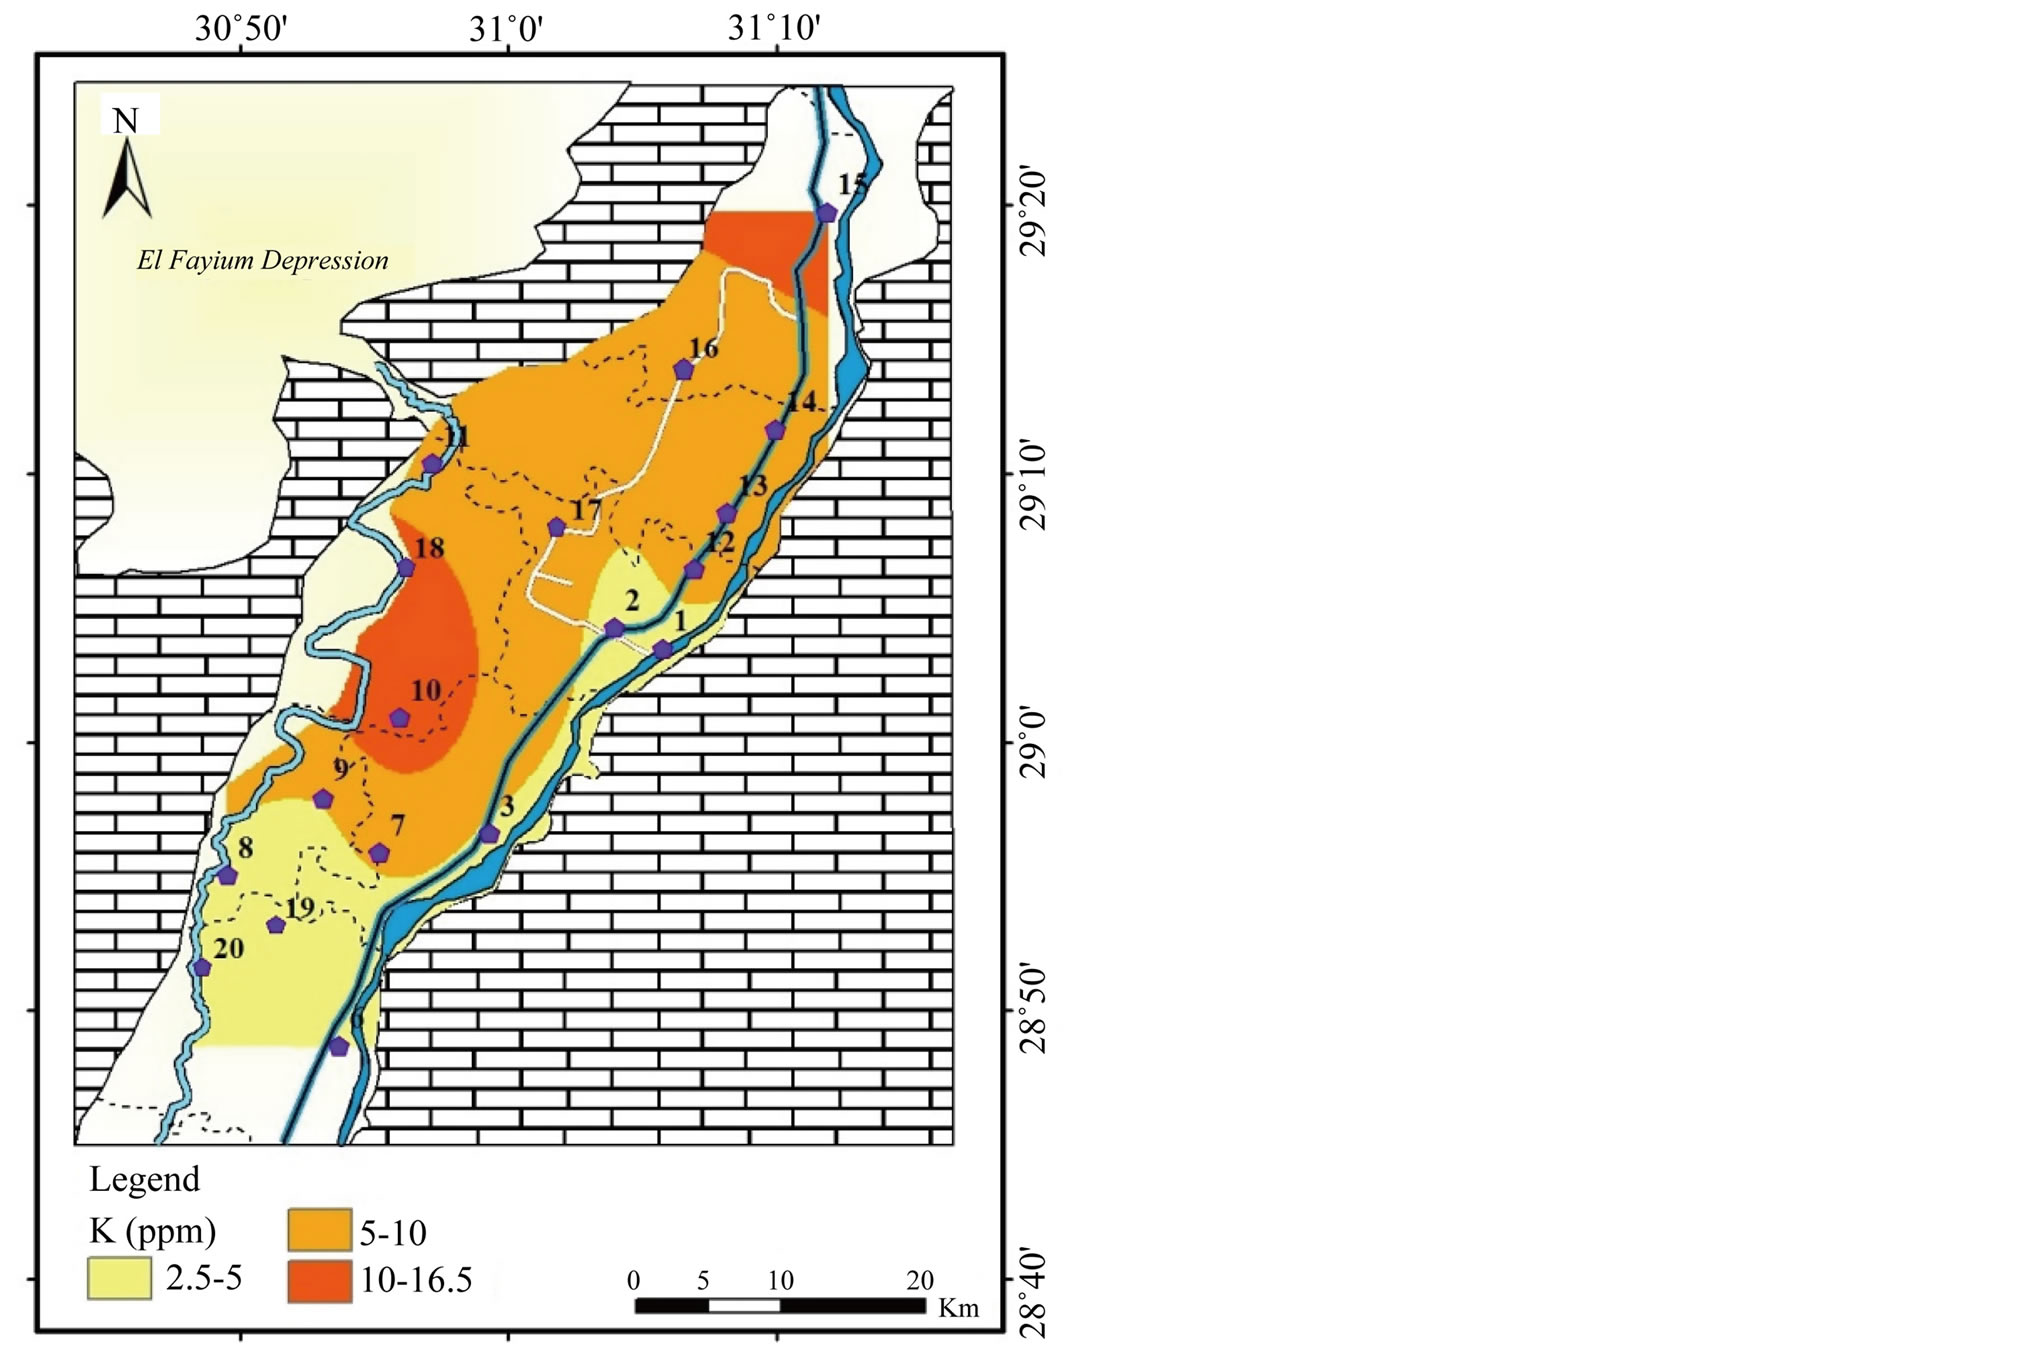
Figure 5. Geochemical map of K in the surface water in the study area.
in the study area, they could be classification into groups, namely:
1) The first group includes the ions; Na+, K+, Cl−,
 and
and , where the highest concentrations are recorded
in the north at El-Wasta center (El-Ibrahimia canal). Na+ concentration
ranges from 18 to 204 mg/l averaging 47 mg/l (Table 2 and
Figure 3). The concentration
of Cl− ranges from 21 to 274 mg/l with an average of 61 mg/l (Table 2,
Figure 4).
The perfect correlation between Na+ and Cl− (r = 1)
as well as between TDS and
, where the highest concentrations are recorded
in the north at El-Wasta center (El-Ibrahimia canal). Na+ concentration
ranges from 18 to 204 mg/l averaging 47 mg/l (Table 2 and
Figure 3). The concentration
of Cl− ranges from 21 to 274 mg/l with an average of 61 mg/l (Table 2,
Figure 4).
The perfect correlation between Na+ and Cl− (r = 1)
as well as between TDS and
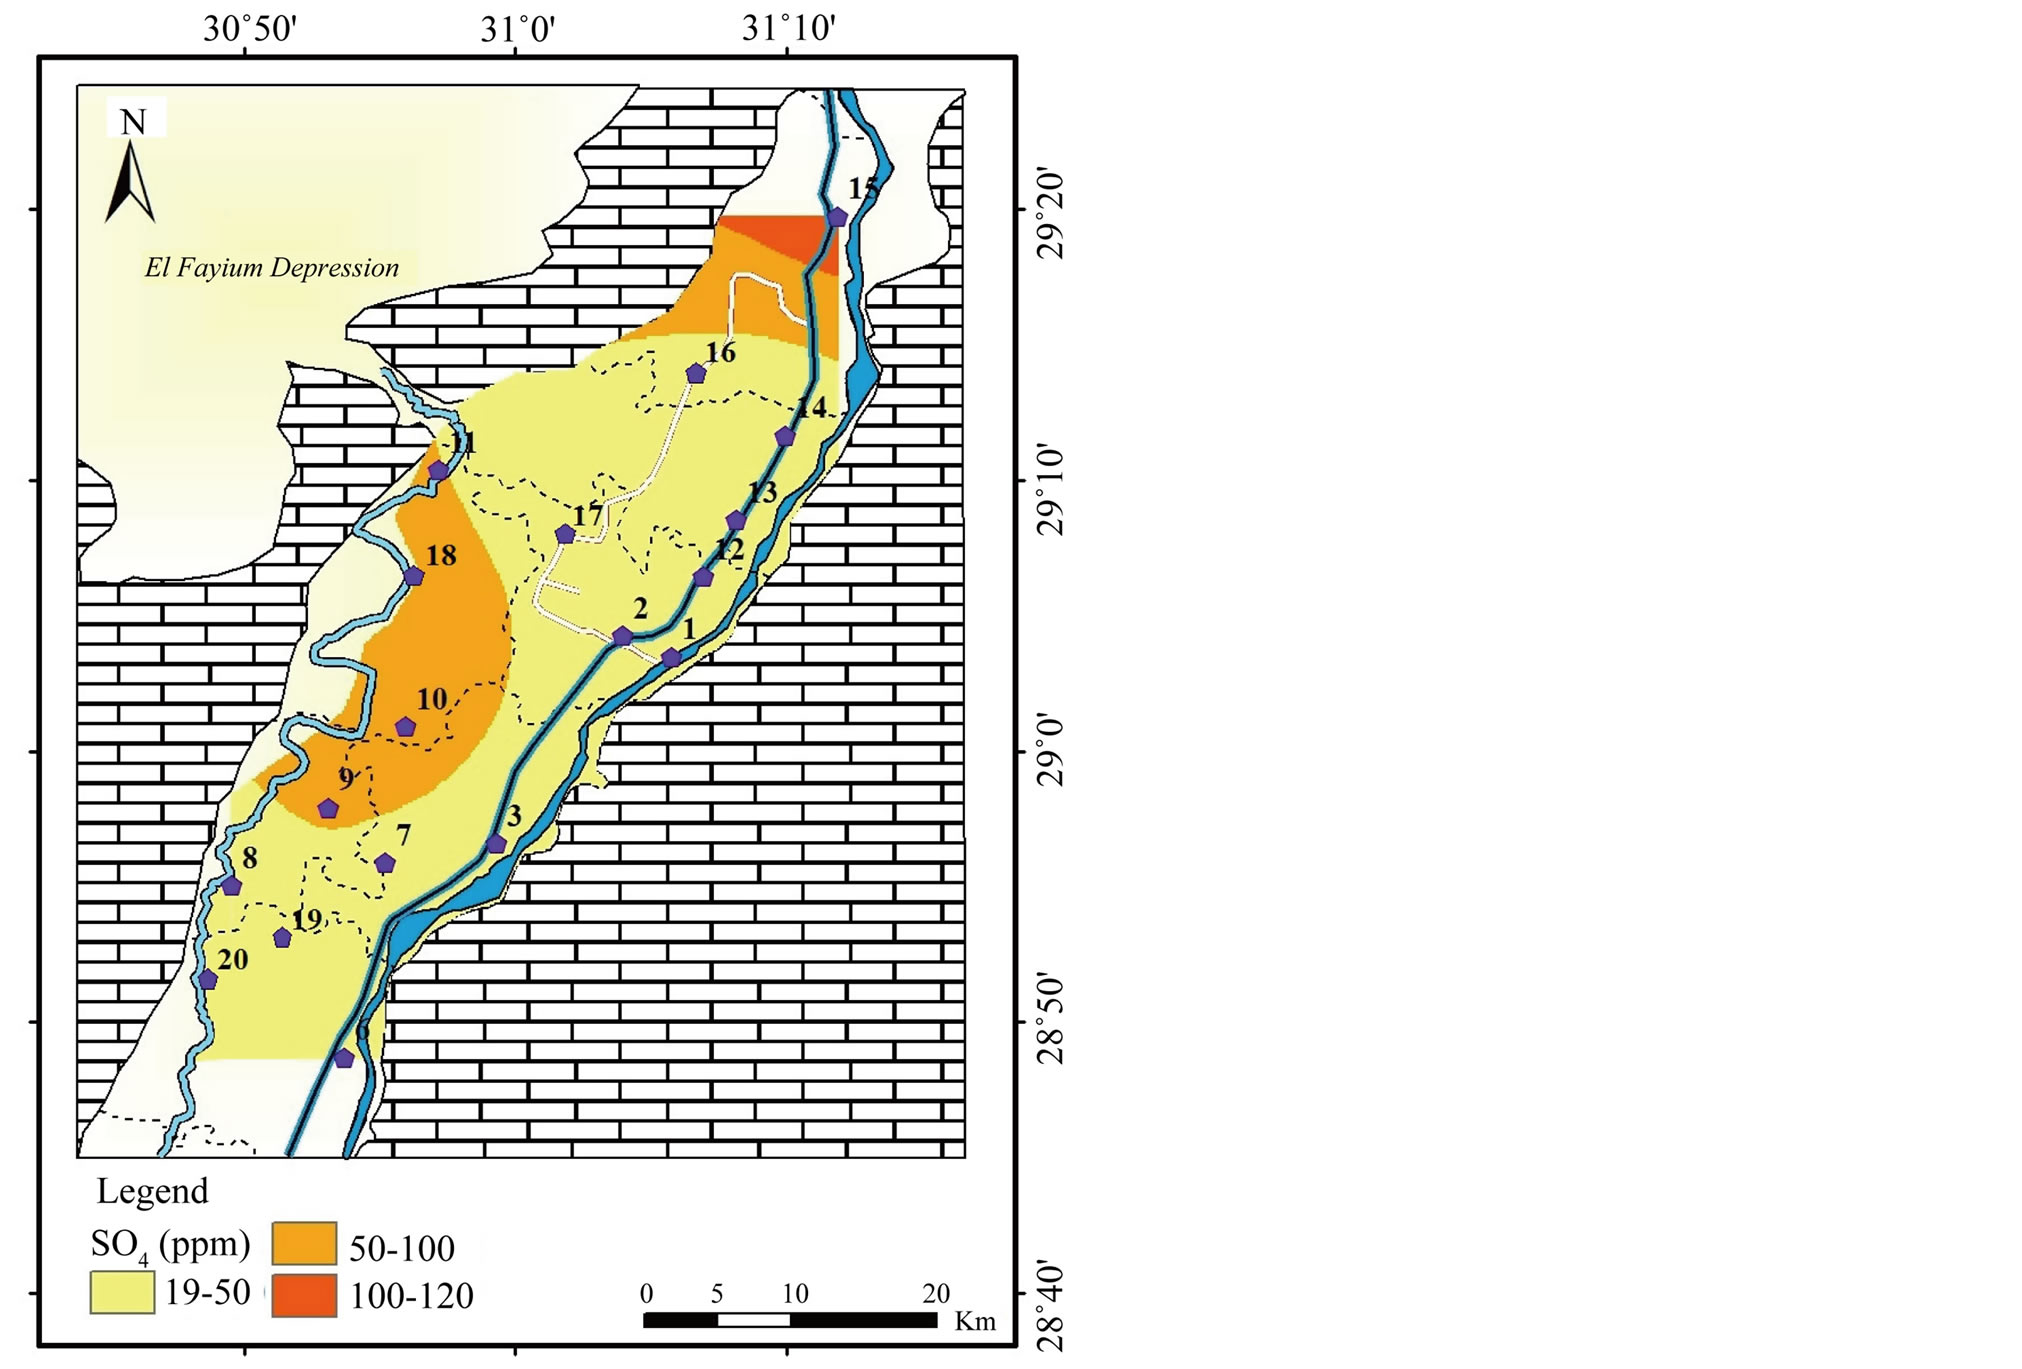
Figure 6. Geochemical map of SO4 in the surface water in the study area.

Figure 7. Geochemical map of NO3 in the surface water in the study area.
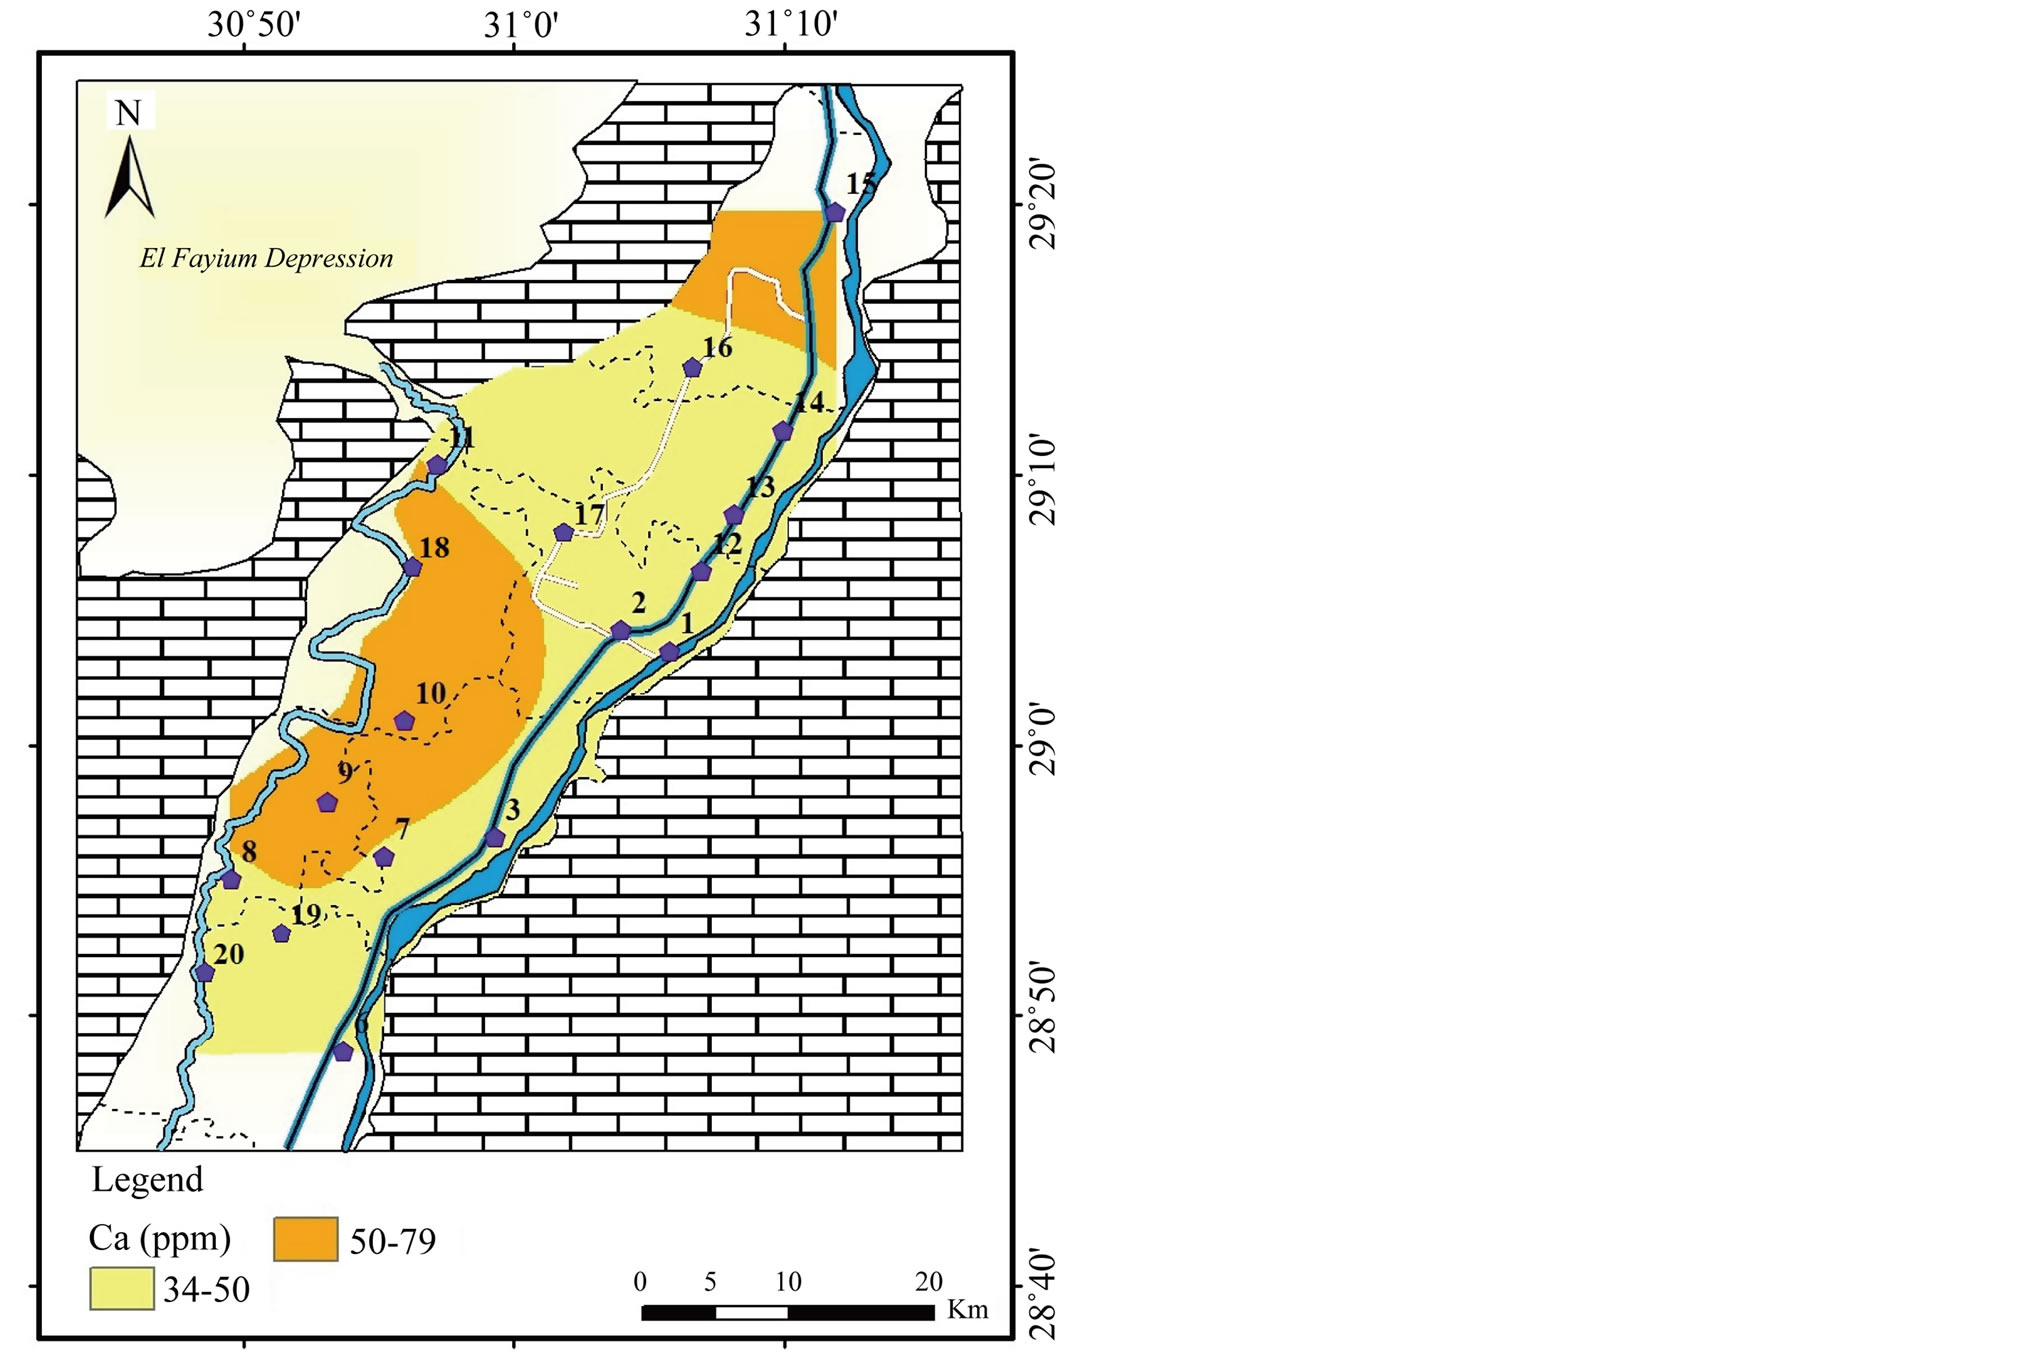
Figure 8. Geochemical map of Ca in the surface water in the study area.

Figure 9. Geochemical map of Mg in the surface water in the study area.
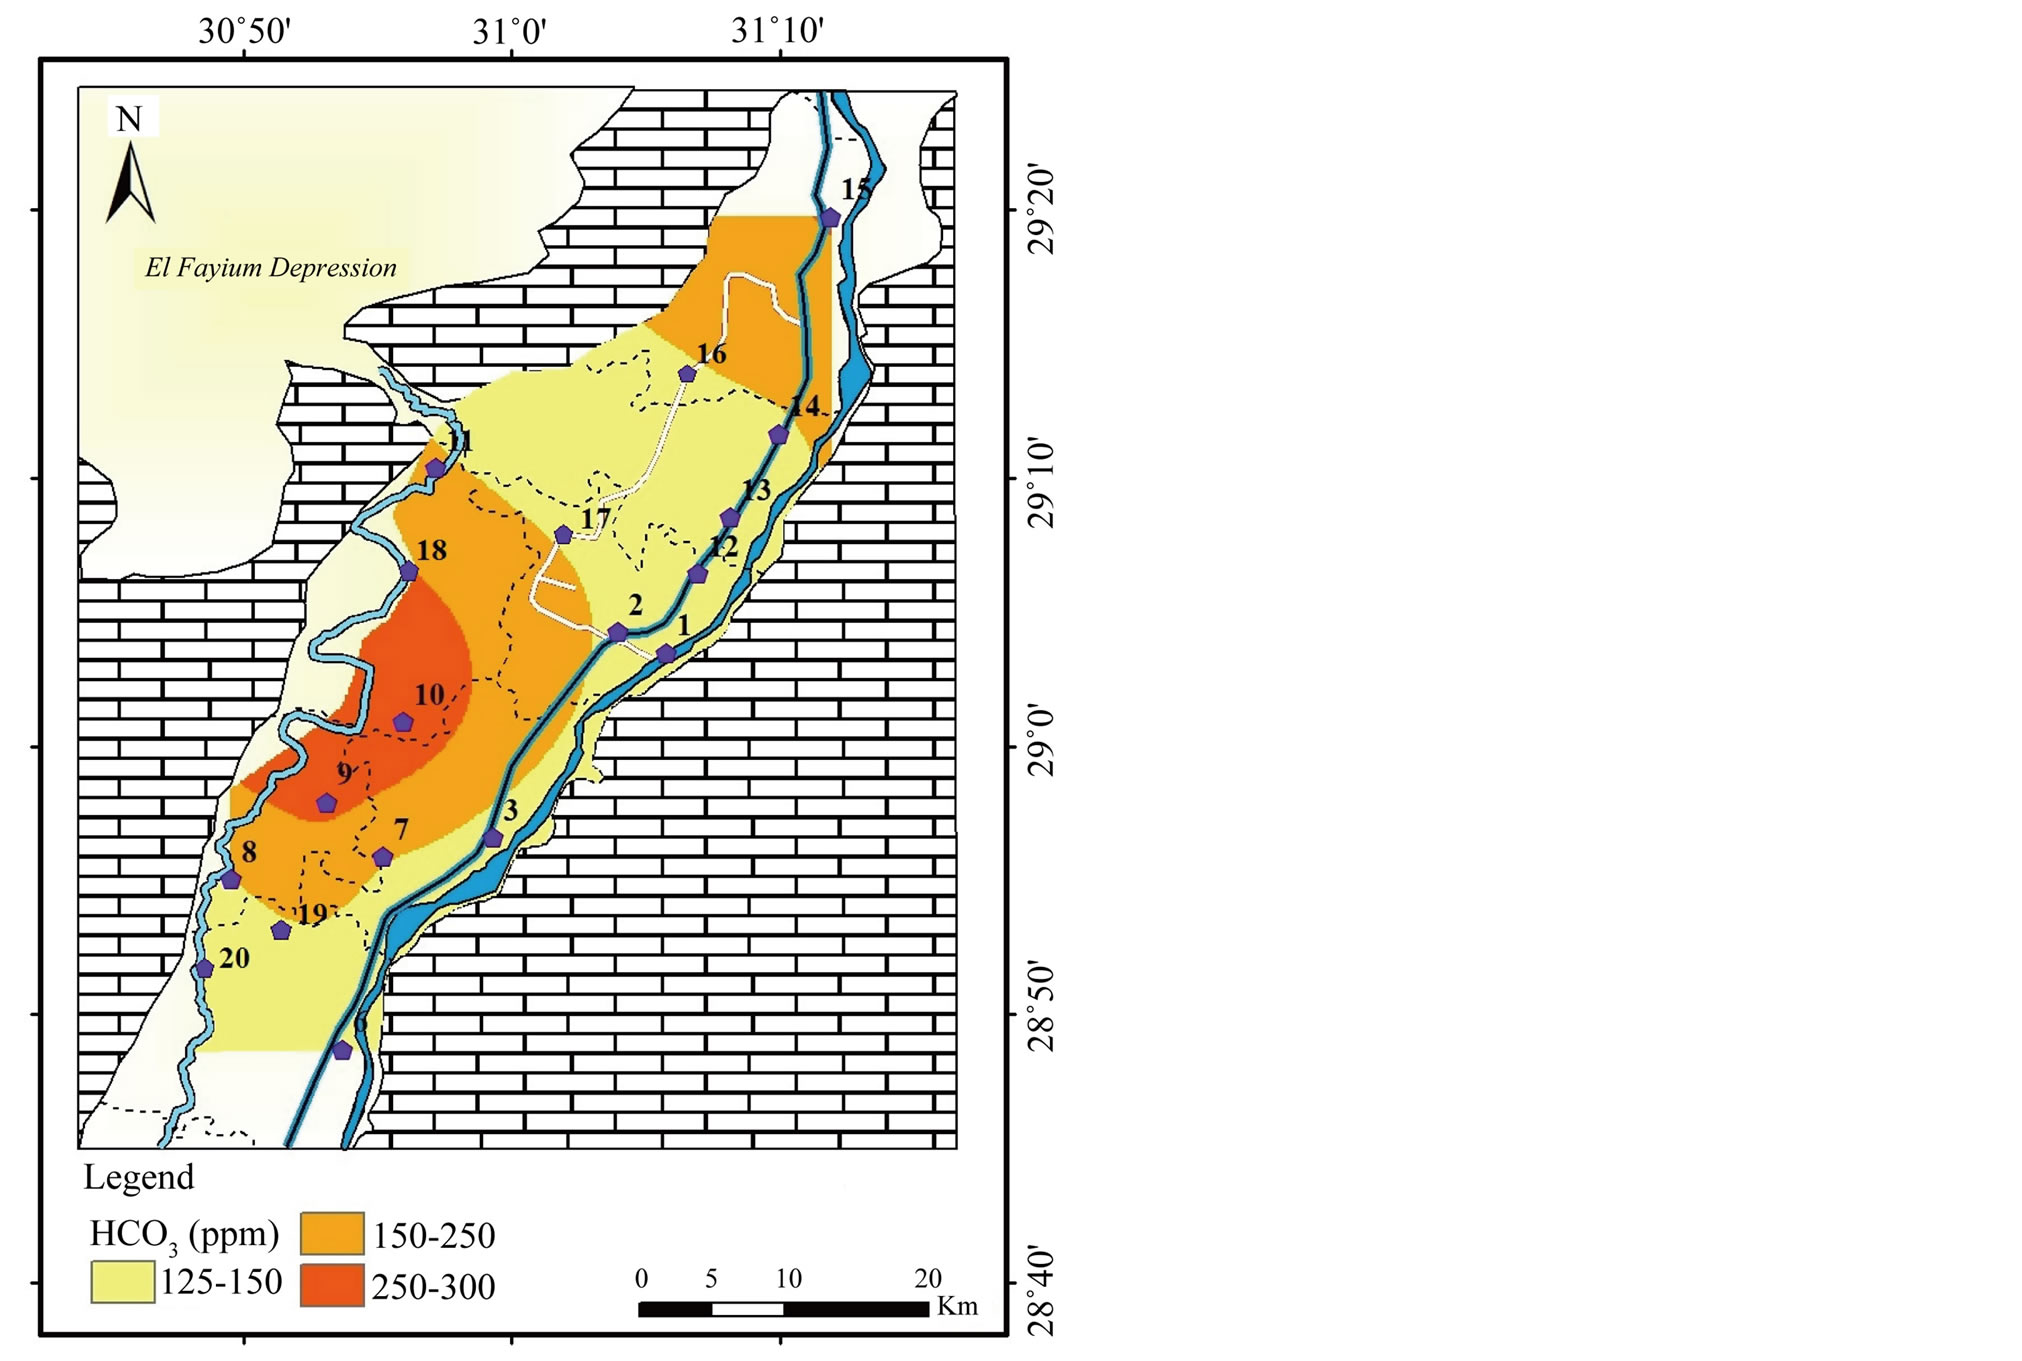
Figure 10.
Geochemical map of
 in the surface water in the study area.
both Na+ and Cl− (r = 0.97) point to the role of NaCl as main contributor to salinity of surface water (Table 3).
Leaching from clay minerals and sediments is one of the sources of Na+ and Cl−. Table 4 shows the concentration of major ions in soil samples that collected from positions 5 and 8 in study area (Figure 1). Agricultural output (irrigation drains, fertilizer and pesticide) and sewage effluent are other possible sources.
The concentration of K+ ranges between 2.5 and 16 mg/l with a mean value
of 7.3 mg/l.
 varies from 20 to 118 mg/l with an average
of 44 mg/l (Table
2 and
Figures 5 and 6). The concentration of
varies from 20 to 118 mg/l with an average
of 44 mg/l (Table
2 and
Figures 5 and 6). The concentration of
 ranges from 0.3 to 16 mg/l with an average of 7 mg/l (Table 2,
Figure 7).
ranges from 0.3 to 16 mg/l with an average of 7 mg/l (Table 2,
Figure 7).
Potassium is primarily from leaching of silicate minerals and in small amounts from evaporation minerals, fertilizers and rain water. Sulfate minerals, fertilizers, insecticide, irrigation water and sewage water are probable additional sources of sulfate in water. Sources of excess nitrate in water include fertilizers, septic systems, wastewater treatment ponds, animal wastes, industrial wastes and food processing wastes.
Strong correlations are perceived between
 and K+, Na+ (r = 0.93), Cl− (r = 0.92) and
 (r = 0.68), (Table
3). The highest concentrations of these ions in El-Ibrahimia
canals in the north can mainly be attributed to discharging of untreated sewage
water from El-Moheet drainage and sewage water from treatment plant in Beni Suef
city. In addition to the impact of fertilizers, pesticide and insecticide used in
agriculture.
(r = 0.68), (Table
3). The highest concentrations of these ions in El-Ibrahimia
canals in the north can mainly be attributed to discharging of untreated sewage
water from El-Moheet drainage and sewage water from treatment plant in Beni Suef
city. In addition to the impact of fertilizers, pesticide and insecticide used in
agriculture.
2) The second group involves Ca2+, Mg2+ and . The highest concentrations
of ions are noticed in the irrigation drainages in the west.
. The highest concentrations
of ions are noticed in the irrigation drainages in the west.
The concentration of Ca2+ ranges from 34 to 79 mg/l with an average of
48 mg/l while Mg2+ from 9 to 24 mg/l averaging 14 mg/l (Table 2
and Figures
8 and
9). The concentration of
 ranges between 128 and 297 mg/l with a mean value of 174 mg/l (Table 2
and Figure
10). The strong correlations between each of Ca2+
and Mg2+ with
ranges between 128 and 297 mg/l with a mean value of 174 mg/l (Table 2
and Figure
10). The strong correlations between each of Ca2+
and Mg2+ with
 (r = 0.98 and r = 0.97, respectively) indicate possible derivation from dissolution
of carbonate minerals (Table 3). The significant positive correlations
between Ca2+ and Mg2+ (r = 0.97) and among Na+,
K+, Cl− and
(r = 0.98 and r = 0.97, respectively) indicate possible derivation from dissolution
of carbonate minerals (Table 3). The significant positive correlations
between Ca2+ and Mg2+ (r = 0.97) and among Na+,
K+, Cl− and
 (r ranges from 0.57 to 0.90) propose leaching of Ca2+ and Mg2+
from clays of the Pleistocene sediments is essential source of these ions (Table 3).
(r ranges from 0.57 to 0.90) propose leaching of Ca2+ and Mg2+
from clays of the Pleistocene sediments is essential source of these ions (Table 3).
The highest concentration of Ca2+, Mg2+ and
 in irrigation canals in the west is attributed to the effect of irrigation effluent,
fertilizers and pesticide and sewage water that used in irrigation. In addition,
the cement industry in Beba, can be considered as source of Ca2+ and
in irrigation canals in the west is attributed to the effect of irrigation effluent,
fertilizers and pesticide and sewage water that used in irrigation. In addition,
the cement industry in Beba, can be considered as source of Ca2+ and . No health-based guideline values (GV) are
proposed for ions in drinking and irrigation water. However, guideline values have
been established for some ions that may cause taste or odor in drinking water such
as; Na+, Cl−,
. No health-based guideline values (GV) are
proposed for ions in drinking and irrigation water. However, guideline values have
been established for some ions that may cause taste or odor in drinking water such
as; Na+, Cl−,
 and
and
 [1]. In general, the concentrations of ions in the study area remain below the GV,
except Na+ and Cl− ions which exceed the limit (200
and 250 mg/l, respectively) only in El-Wasta due north of the study area. The increase
in sodium and chloride is accompanied with mutual increase in the TDS content that
is generally backed to the effect of wastewater coming from El-Moheet drainage.
High concentrations of Na+ and Cl− give a salty taste
to water and beverages.
[1]. In general, the concentrations of ions in the study area remain below the GV,
except Na+ and Cl− ions which exceed the limit (200
and 250 mg/l, respectively) only in El-Wasta due north of the study area. The increase
in sodium and chloride is accompanied with mutual increase in the TDS content that
is generally backed to the effect of wastewater coming from El-Moheet drainage.
High concentrations of Na+ and Cl− give a salty taste
to water and beverages.
4.3. Heavy Metals
In the surface water samples, the concentrations of many heavy metals; e.g., Cd, Fe, Mn, Co and Cu, exceed the maximum permissible limits for drinking and irrigation water (Table 2).
Cadmium (Cd): It may enter aquatic systems through weathering and erosion of soils and bedrock, atmospheric deposition direct discharge from industrial operations, leakage from landfills and contaminated sites, and the dispersive use of sludge and fertilizers in agriculture [14]. The concentration of Cd ranges from below detection limit (<1) to 400 μg/l with standard deviation (σ) equals 121 (Table 2). High concentrations of Cd have been recorded in most of the study area, whereas the low concentration

Table 4. Chemical analysis of soil samples (Major ions and heavy metals mg/kg).
of Cd occupies rather limited extent (Figure 11). The MPL recommended by WHO [1] for Cd for potable water is 3 μg/l, while FAO [2] quoted 10 μg/l for irrigation water.
Except that positions where the value of Cd below detection limit (<1 μg/l), the
concentration of Cd in the study area exceeds the MPL quoted by the WHO and FAO
in all samples and up to 135 fold. The kidney is the main target organ for cadmium
toxicity. It accumulates primarily in the kidneys and has a long biological halflife
in humans of 10 - 35 years [1]. The strong correlations between Cd and both Na+
and Cl− (r = 0.91) and its moderate correlations with TDS and
 (r = 0.84 and 0.81, respectively, Table 5) confirms that leaching from soil and
anthropogenic activities are the main sources of Cd in the study area. High concentration
of Cd has also been recorded in the analyzed soil samples (174 and 166 mg/l,
Table 4).
The industrial wastes and sewage water, which are discharged in the surface water
without being treated, are possible candidates for Cd pollution in the study area.
There are limited locations in the study area that do not have sewage system. They
discharge their wastes through septic tank. Moreover, the use of pesticides and
phosphate fertilizer in agriculture can be considered as a potential source of Cd
pollution [6,15-17].
(r = 0.84 and 0.81, respectively, Table 5) confirms that leaching from soil and
anthropogenic activities are the main sources of Cd in the study area. High concentration
of Cd has also been recorded in the analyzed soil samples (174 and 166 mg/l,
Table 4).
The industrial wastes and sewage water, which are discharged in the surface water
without being treated, are possible candidates for Cd pollution in the study area.
There are limited locations in the study area that do not have sewage system. They
discharge their wastes through septic tank. Moreover, the use of pesticides and
phosphate fertilizer in agriculture can be considered as a potential source of Cd
pollution [6,15-17].
Iron (Fe) and Manganese (Mn): Both Fe and Mn are commonly found in water and are essential elements required in small amounts by all living organisms. The presence of iron or manganese in drinking water can affect the taste, smell, or color of the water [18]. In the study area, the concentration of Fe varies between 13 and 1415 μg/l with σ equals 332 (Table 2). The concentration of Fe in the southwest increases toward the west in the irrigation canals, whereas in the northeast it increases toward the east at El-Ibrahimia canal (Figure 12). The WHO and FAO have estimated the MPL for Fe to be 300 μg/l for drinking purposes and 5000 μg/l for irrigation uses. The concentration of Fe surpasses the MPL for drink water in the most samples and still within the limit for irrigation water.
The concentration of Mn ranges from 37 to 713 μg/l with σ equals 154 (Table 2). Figure 13 shows the distribution of Mn in Beni Suef region. It is similar to the distribution of Fe, where it increases to the east in the northeast and toward west in the southwest. The highest value of Mn in the study area is recorded in the River Nile that exceeds the MPL for drinking water as given by
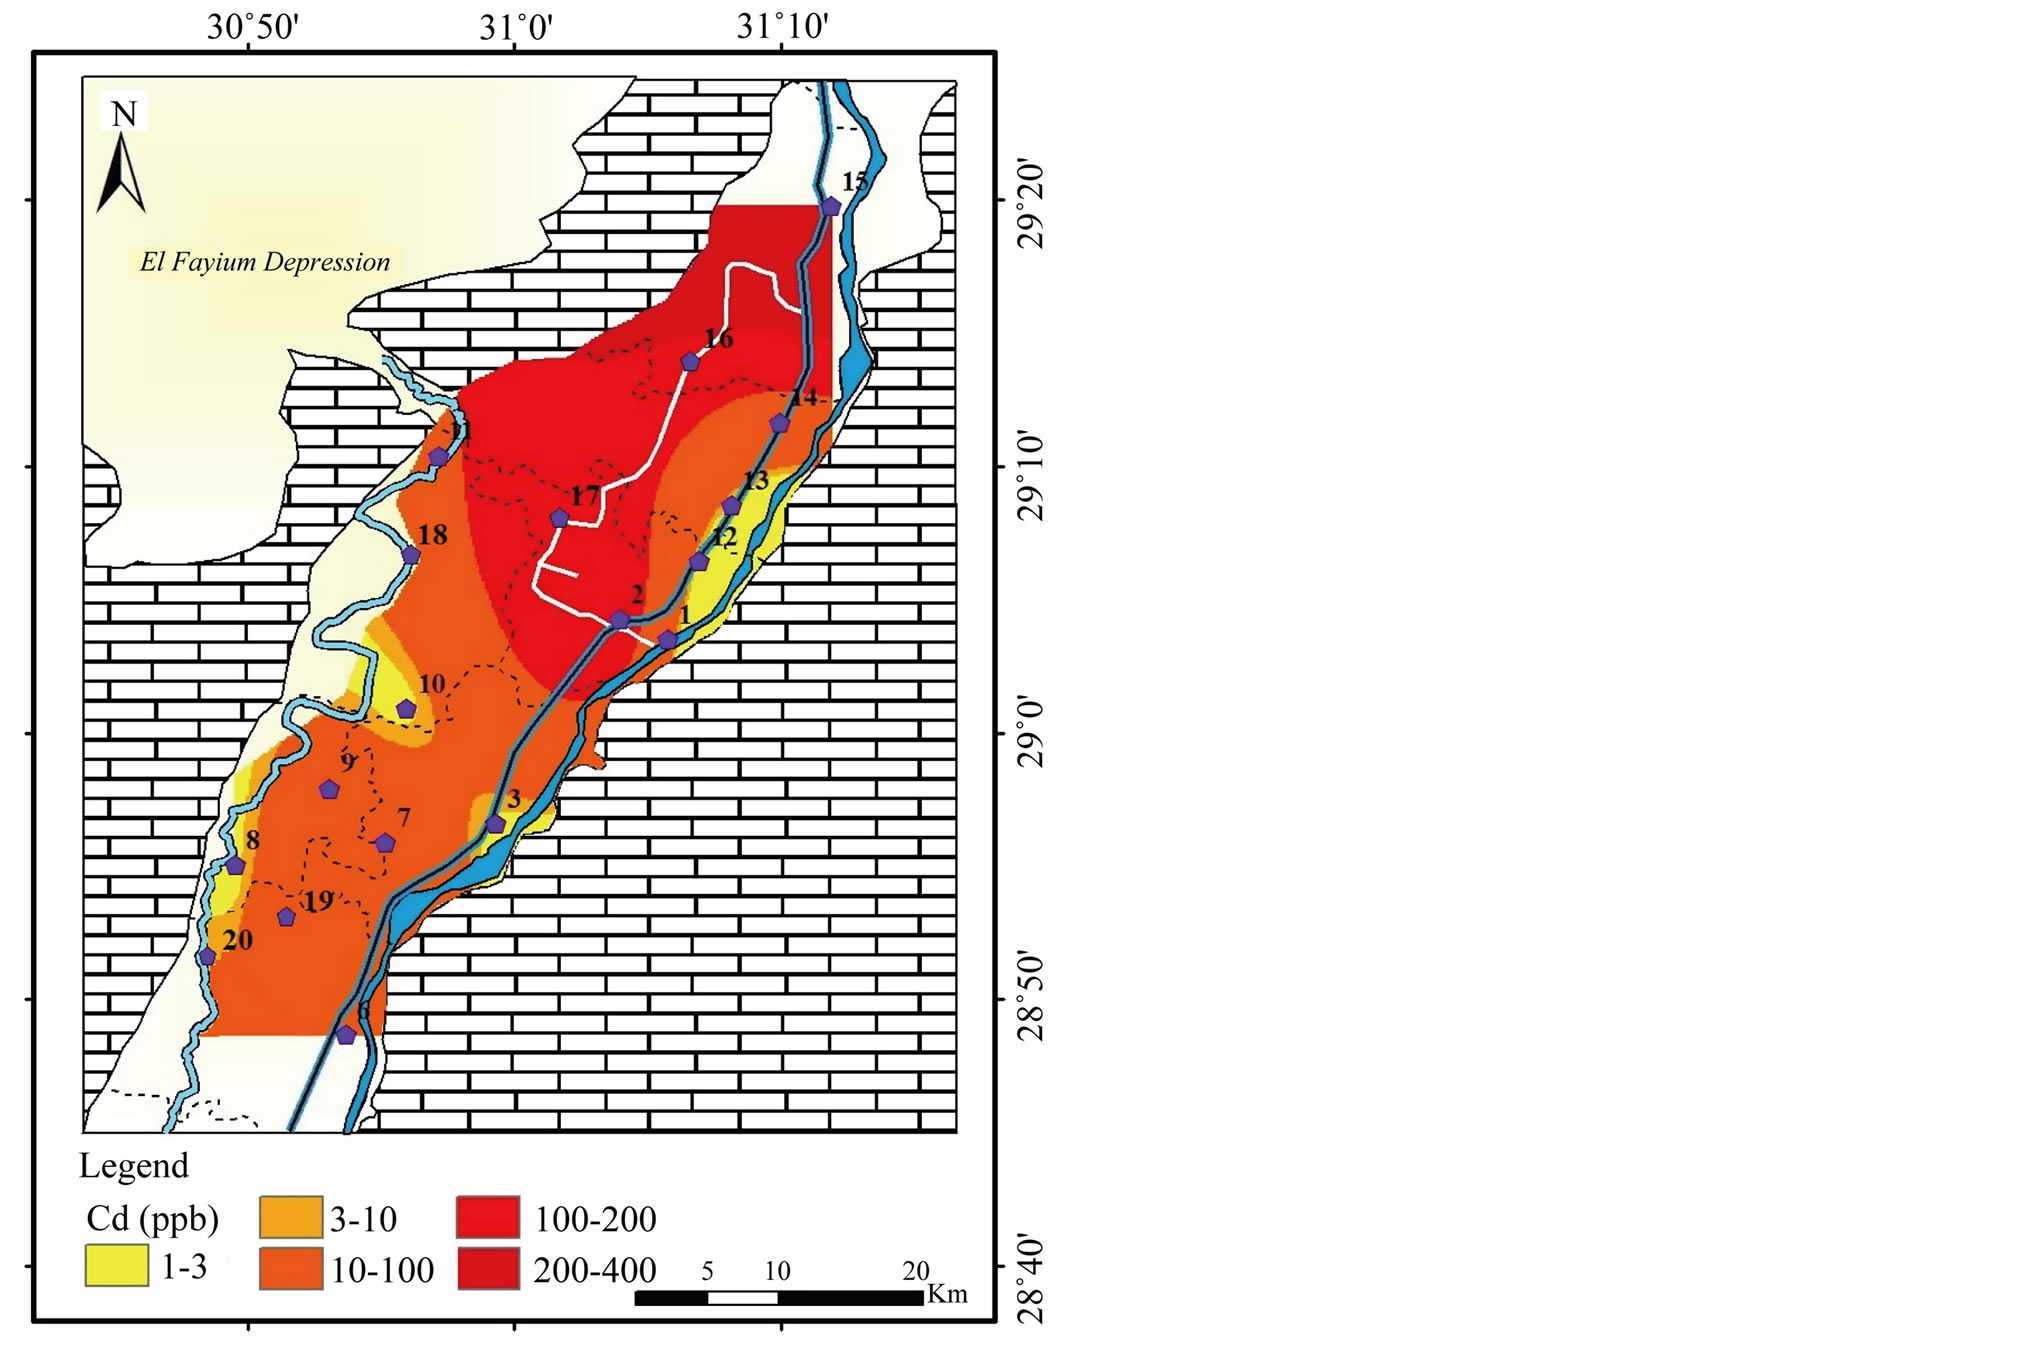
Figure 11. Geochemical map of Cd in the surface water in the study area.
WHO (400 μg/l), whereas the other values remain below the limit. The highest concentration of Mn in the River Nile can be attributed to low value of pH, where metals tend to be more soluble. This is supported by the strong negative correlation between Mn and pH (r = −0.86, Table 5). The value of Mn exceeds the MPL given for irrigation water by FAO [2] (200 μg/l) in irrigation canals.
The high concentrations of Fe and Mn are possibly backed to many sources including; interaction with sediments and soil, using of fertilizers, irrigation by untreated water, industrial and domestic waste and the metallic pipes that are used to transport water [1,17,19].
Copper (Cu): Copper can be released into the environment by both natural sources and human activities where it is widely used in numerous industrial and agricultural applications (mining, metal production, wood production and phosphate fertilizer production). It is often found near mines, industrial settings, landfills and waste disposals. Copper works its way into the water by dissolving from copper pipes in the household plumbing. Usually water soluble copper compounds occur in the
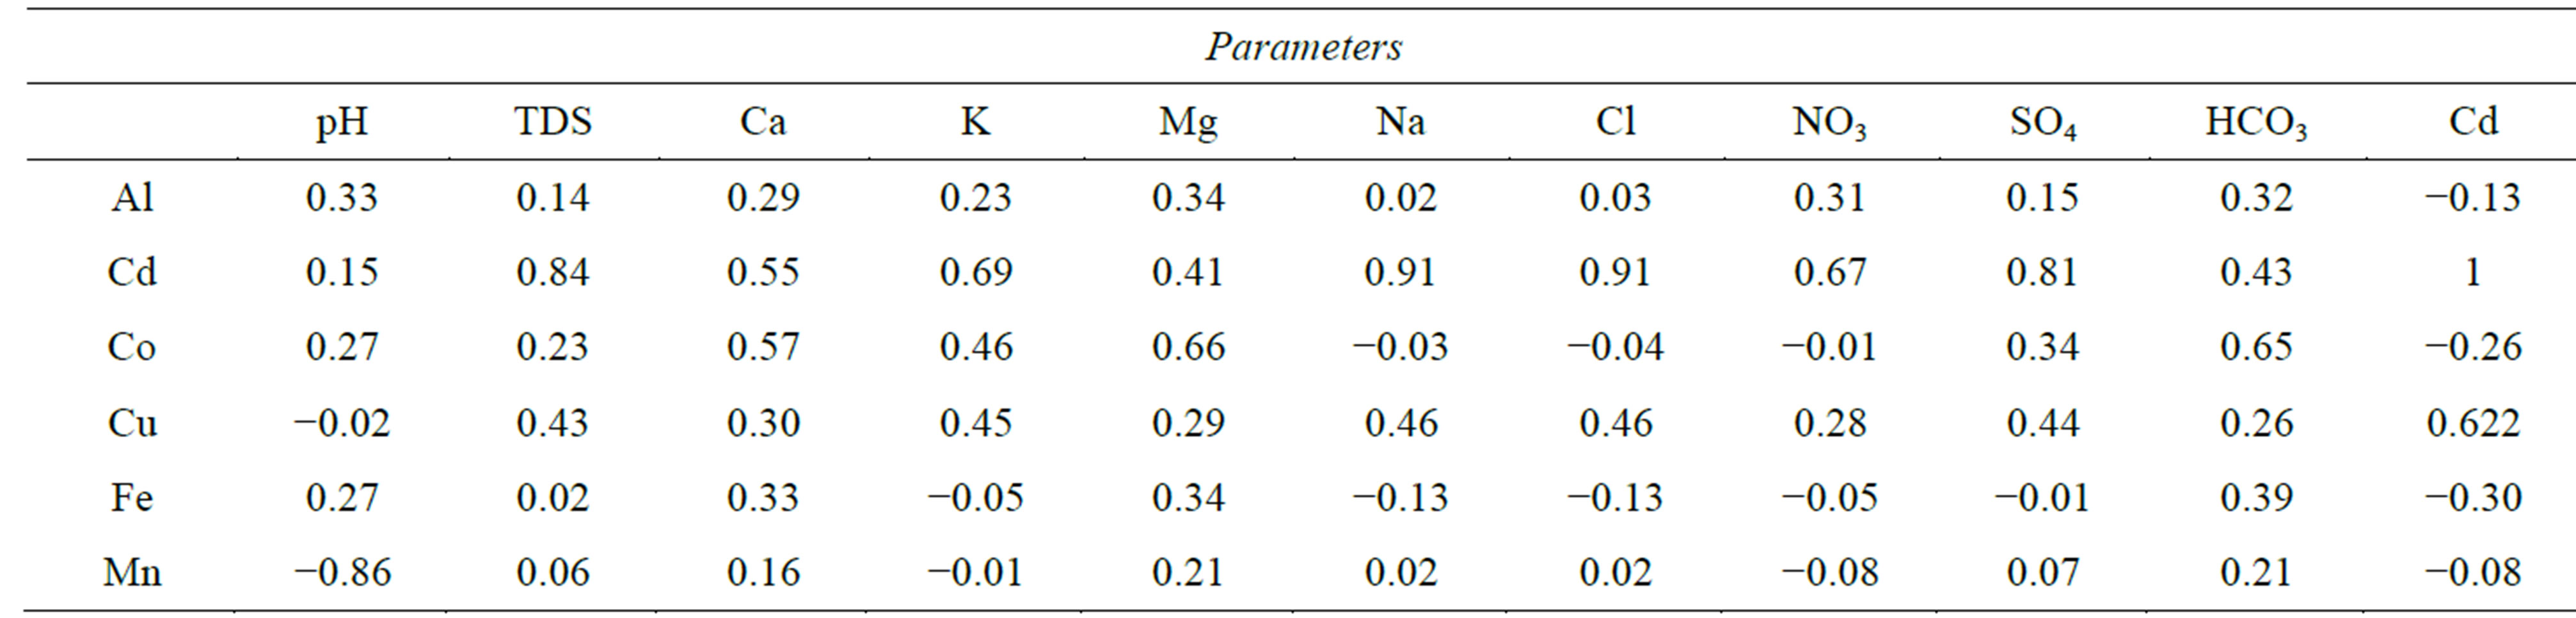
Table 5. Correlation matrix of major parameters and heavy metals of surface water.
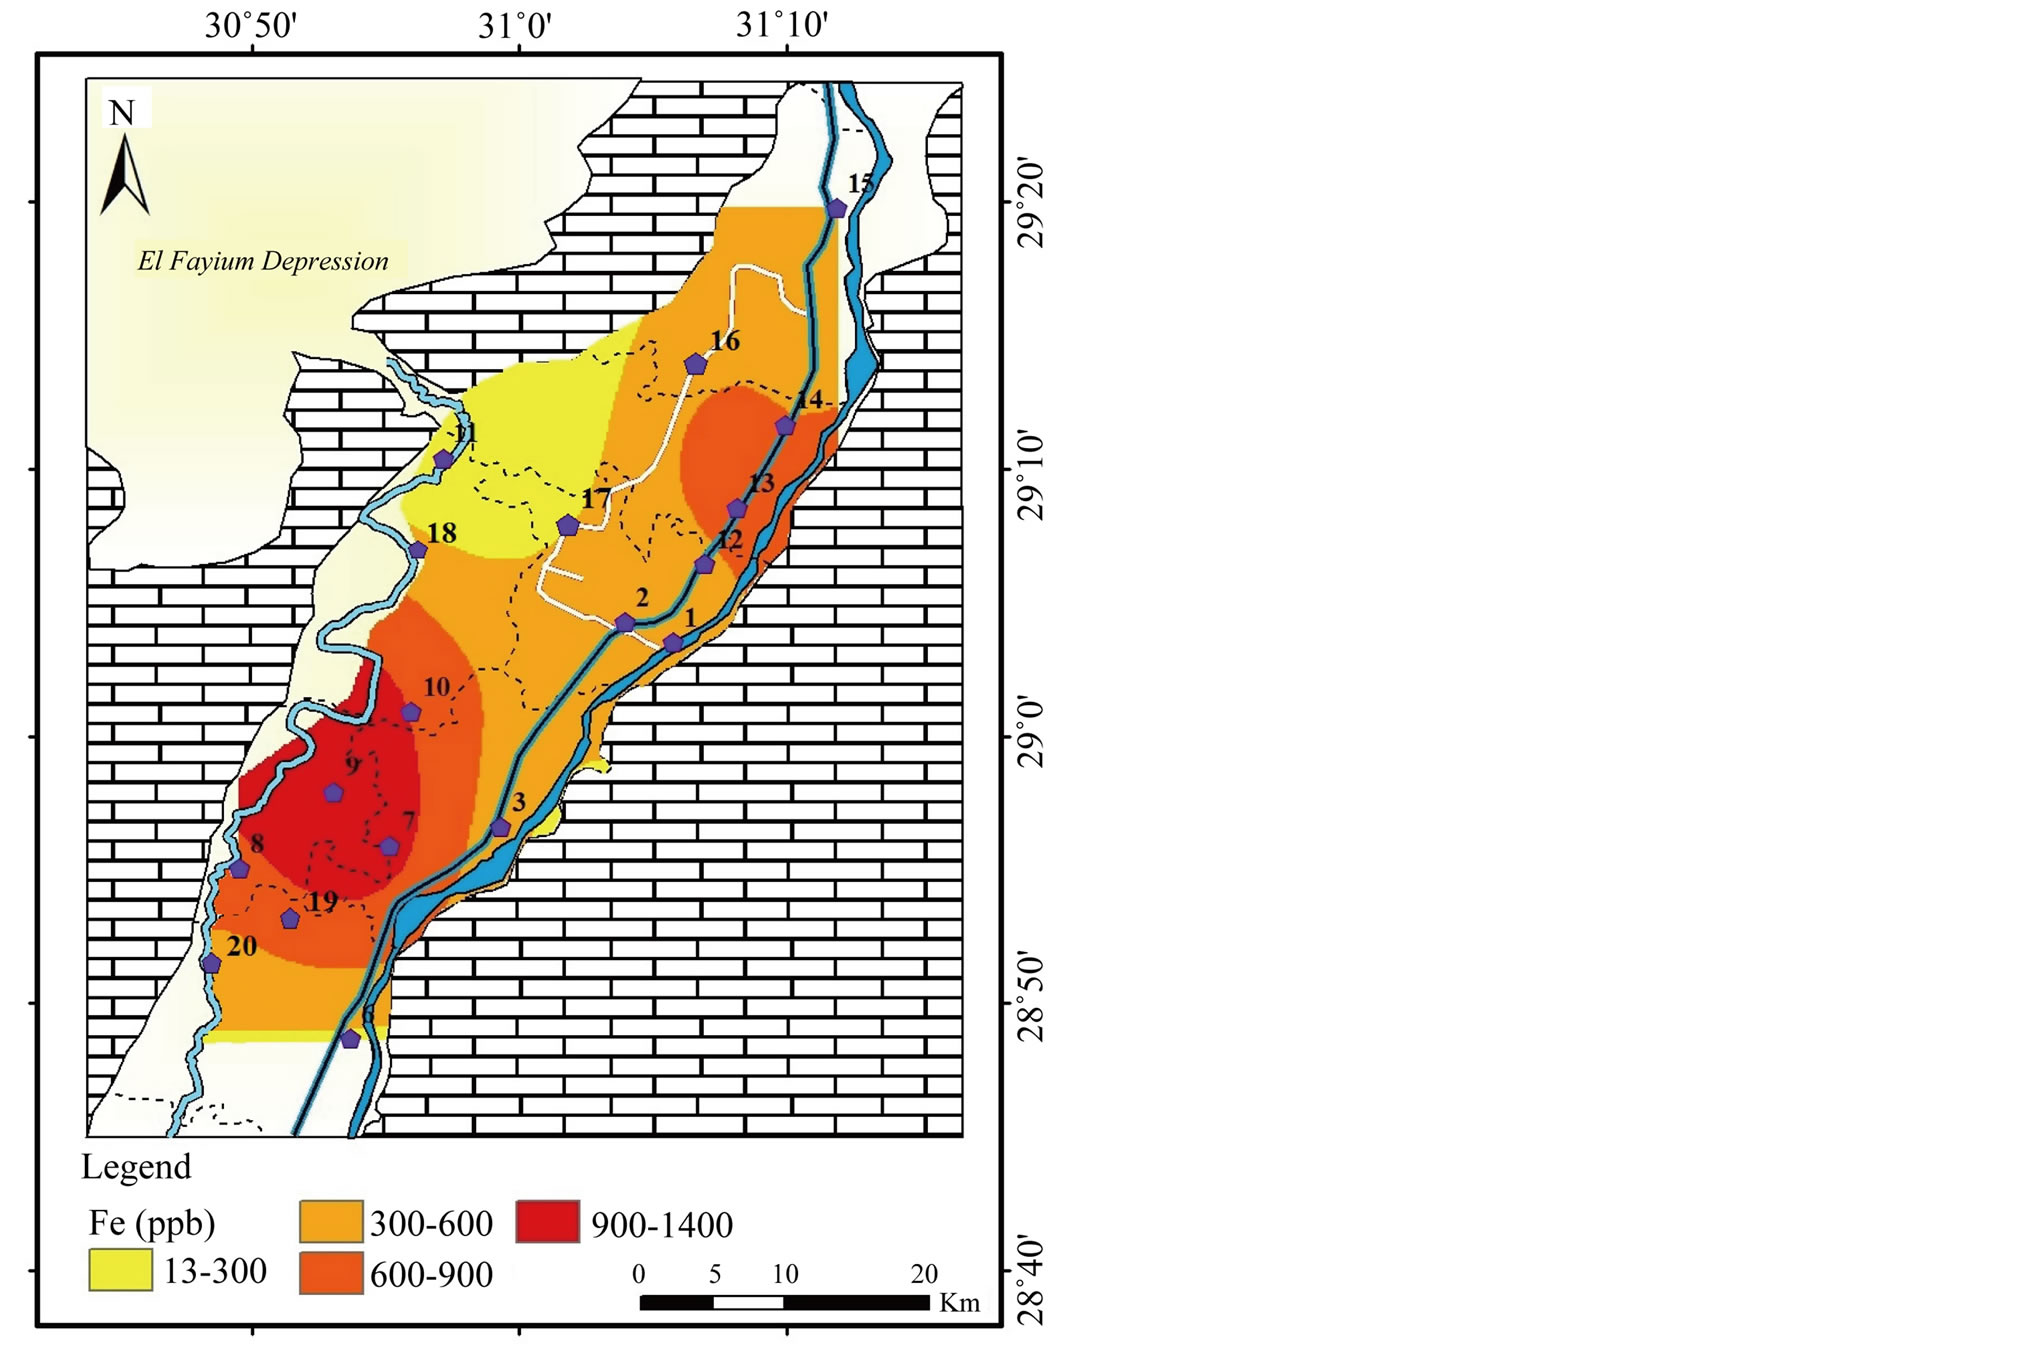
Figure 12. Geochemical map of Fe in the surface water in the study area.
environment after release through fertilizer application in agriculture [20].
It is an essential element for living organisms, including humans, and in small amounts necessary in our diet to ensure good health. However, too much copper can cause adverse health effects, including vomiting, diarrhea, stomach cramps, nausea, liver damage and kidney disease [21].
In the study area, the concentration of Cu in surface water ranges from <1 to 1080 μg/l with σ equals 368 (Table 2). High values of Cu are recorded in El-Ibrahimia canal at two positions; El-Wasta and Beni Suef (Figure 14). Cu was found to be less than 2000 μg/l (MPL in drinking water WHO [1] and higher than 200 μg/l (MPL in irrigation water FAO [2]. Moderate corre-

Figure 13. Geochemical map of Mn in the surface water in the study area.
lation between Cu and Cd (r = 0.62, Table 5). High concentrations of Cu in surface water are attributed to several factors; agricultural and industrial activities, waste disposal and wastewater from El-Moheet drainage.
Cobalt (Co): Cobalt is a relatively rare element of the earth’s crust. It is an essential micronutrient required for the formation of vitamin B12 and for its function in enzymatic processes. Small amounts of cobalt are present naturally in rock, soil, water, plants, animals and air. Natural sources of cobalt to the environment include volcanic eruptions, seawater spray and forest fires. Anthropogenic sources to the environment contain burning of fossil fuels, sewage sludge, phosphate fertilizers, mining and smelting of cobalt-containing ores and industrial processes that use cobalt compounds [22,23].
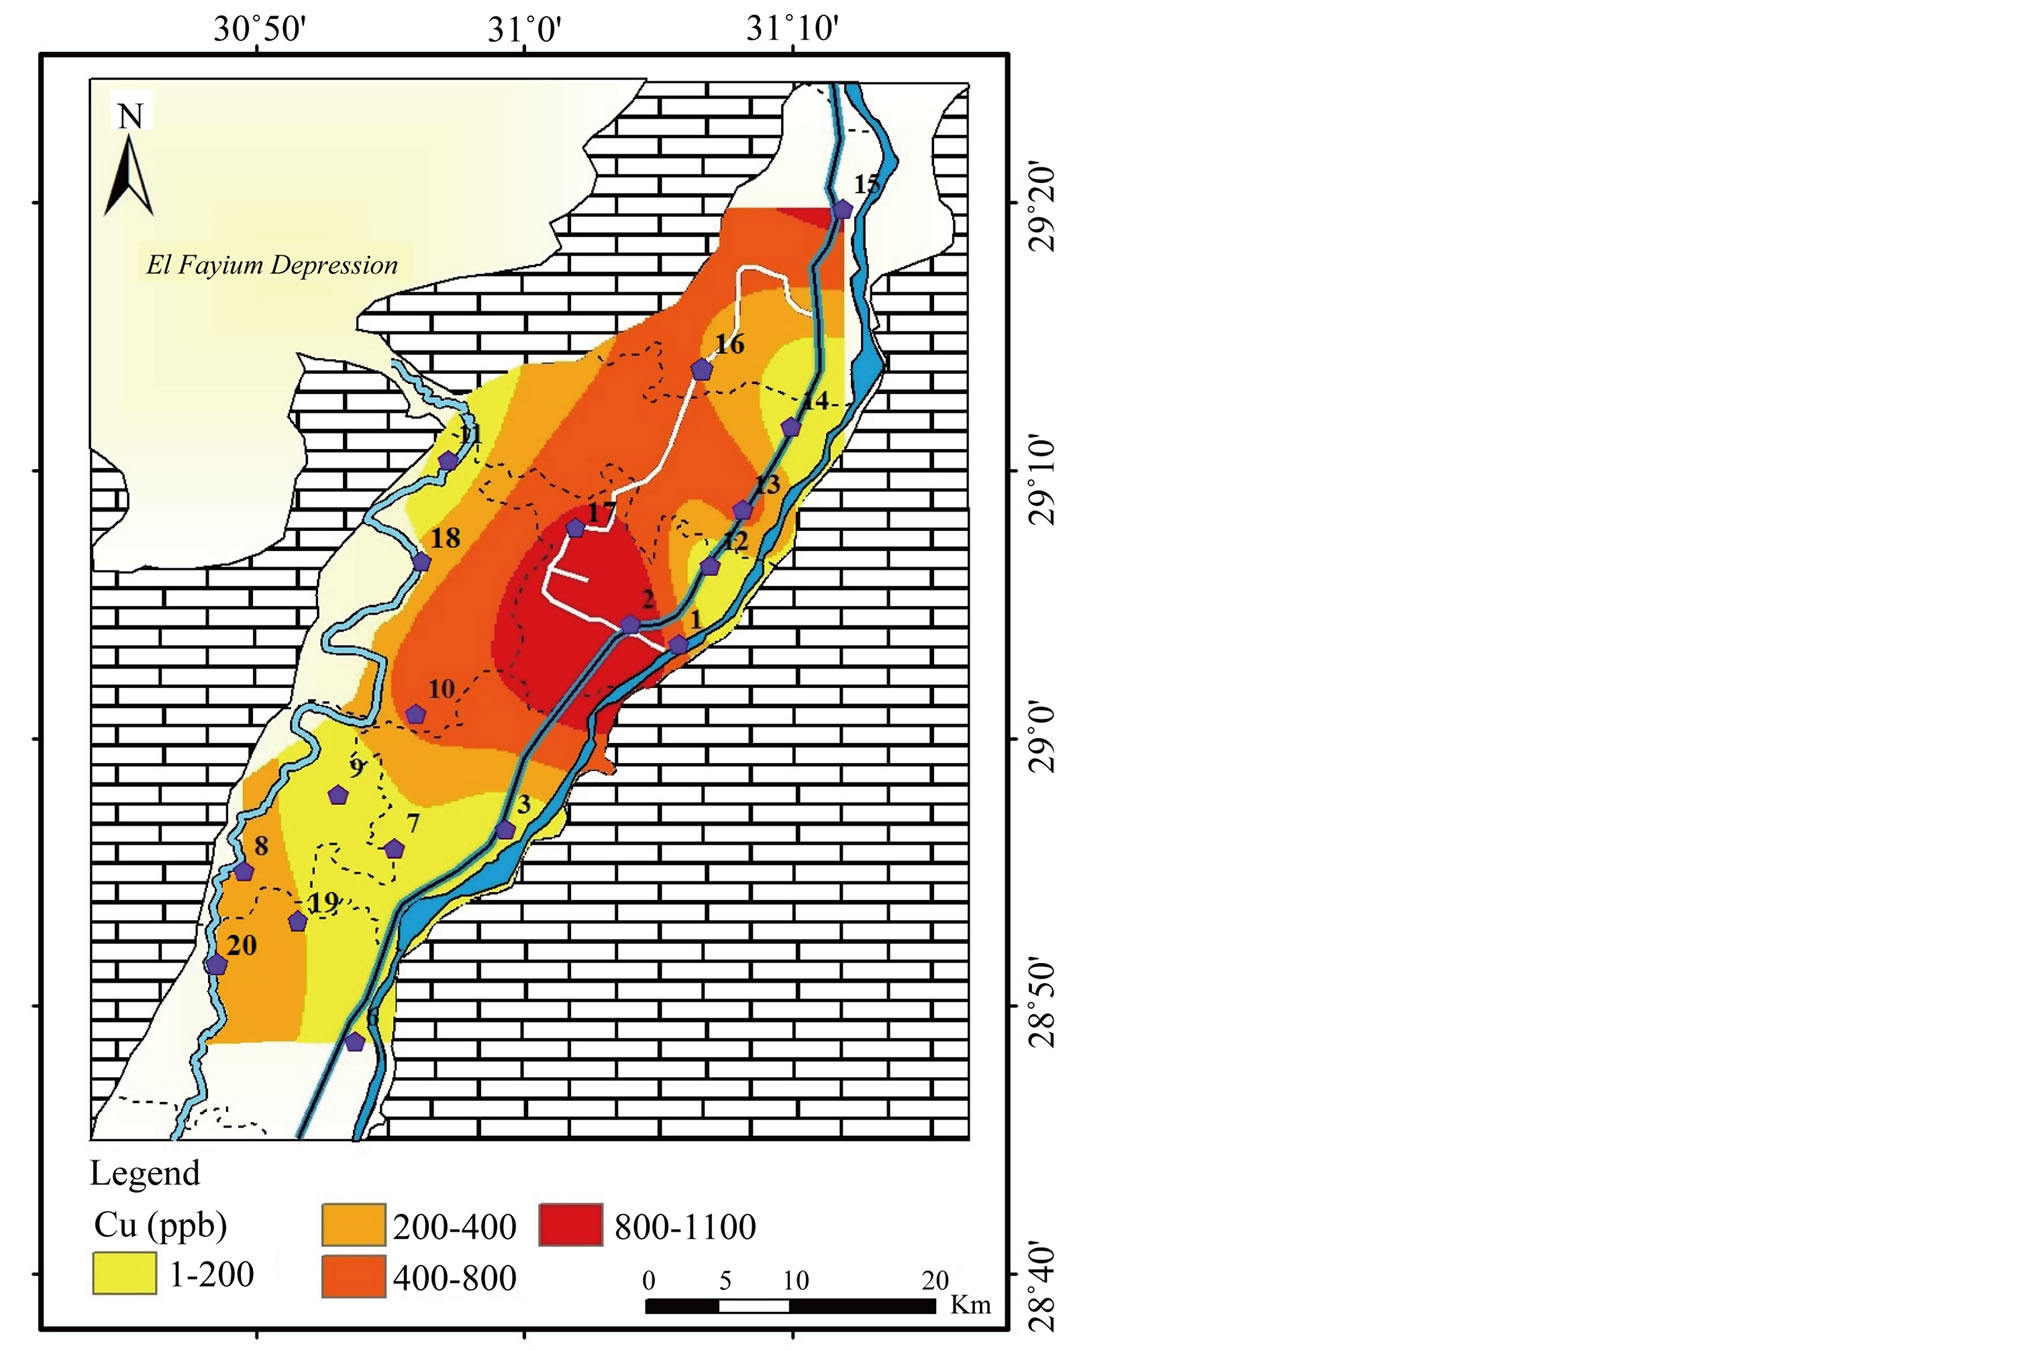
Figure 14. Geochemical map of Cu in the surface water in the study area.
In the study area, the concentration of Co varies between <5 and 239 μg/l with σ
equals 59 (Table
2). The highest concentration of Co appears in the west at irrigation
drains (Figure
15). Some values of Co exceed the MPL for irrigation water (50
μg/l). There is currently no guideline of cobalt for drinking water. The high concentration
of Co in the study area is attributed to anthropogenic activities such as using
of fertilizers and pesticide, waste disposal and industrial waste. The strong correlation
between Co and each of Mg2+,
 and Ca2+ (Table
5) confirms the anthropogenic contribution.
and Ca2+ (Table
5) confirms the anthropogenic contribution.
Aluminum (Al): The concentration of Al varies from 1608 to 2545 μg/l with σ equals 325 (Table 2). Figure 16 shows the distribution of Al in Beni Suef governorate where the highest concentrations are recorded in the southwest in irrigation canals and Bahr Youssef.
FAO organization [2] has recommended a MPL of Al to be 5000 μg/l for irrigation water. However, for drinking water a MPL of 200 μg/l was established for Al by WHO [1], based on aesthetic considerations. Al is not considered to be a heavy metal like lead, but it can be toxic in excessive amounts and even in small amounts if it is deposited in the brain. Many of the symptoms of Al toxicity mimic those of Alzheimer’s disease and osteoporosis [24].
In the study area, the concentration of Al is less than the MPL for irrigation. However, it exceeds the MPL for

Figure 15. Geochemical map of Co in the surface water in the study area.
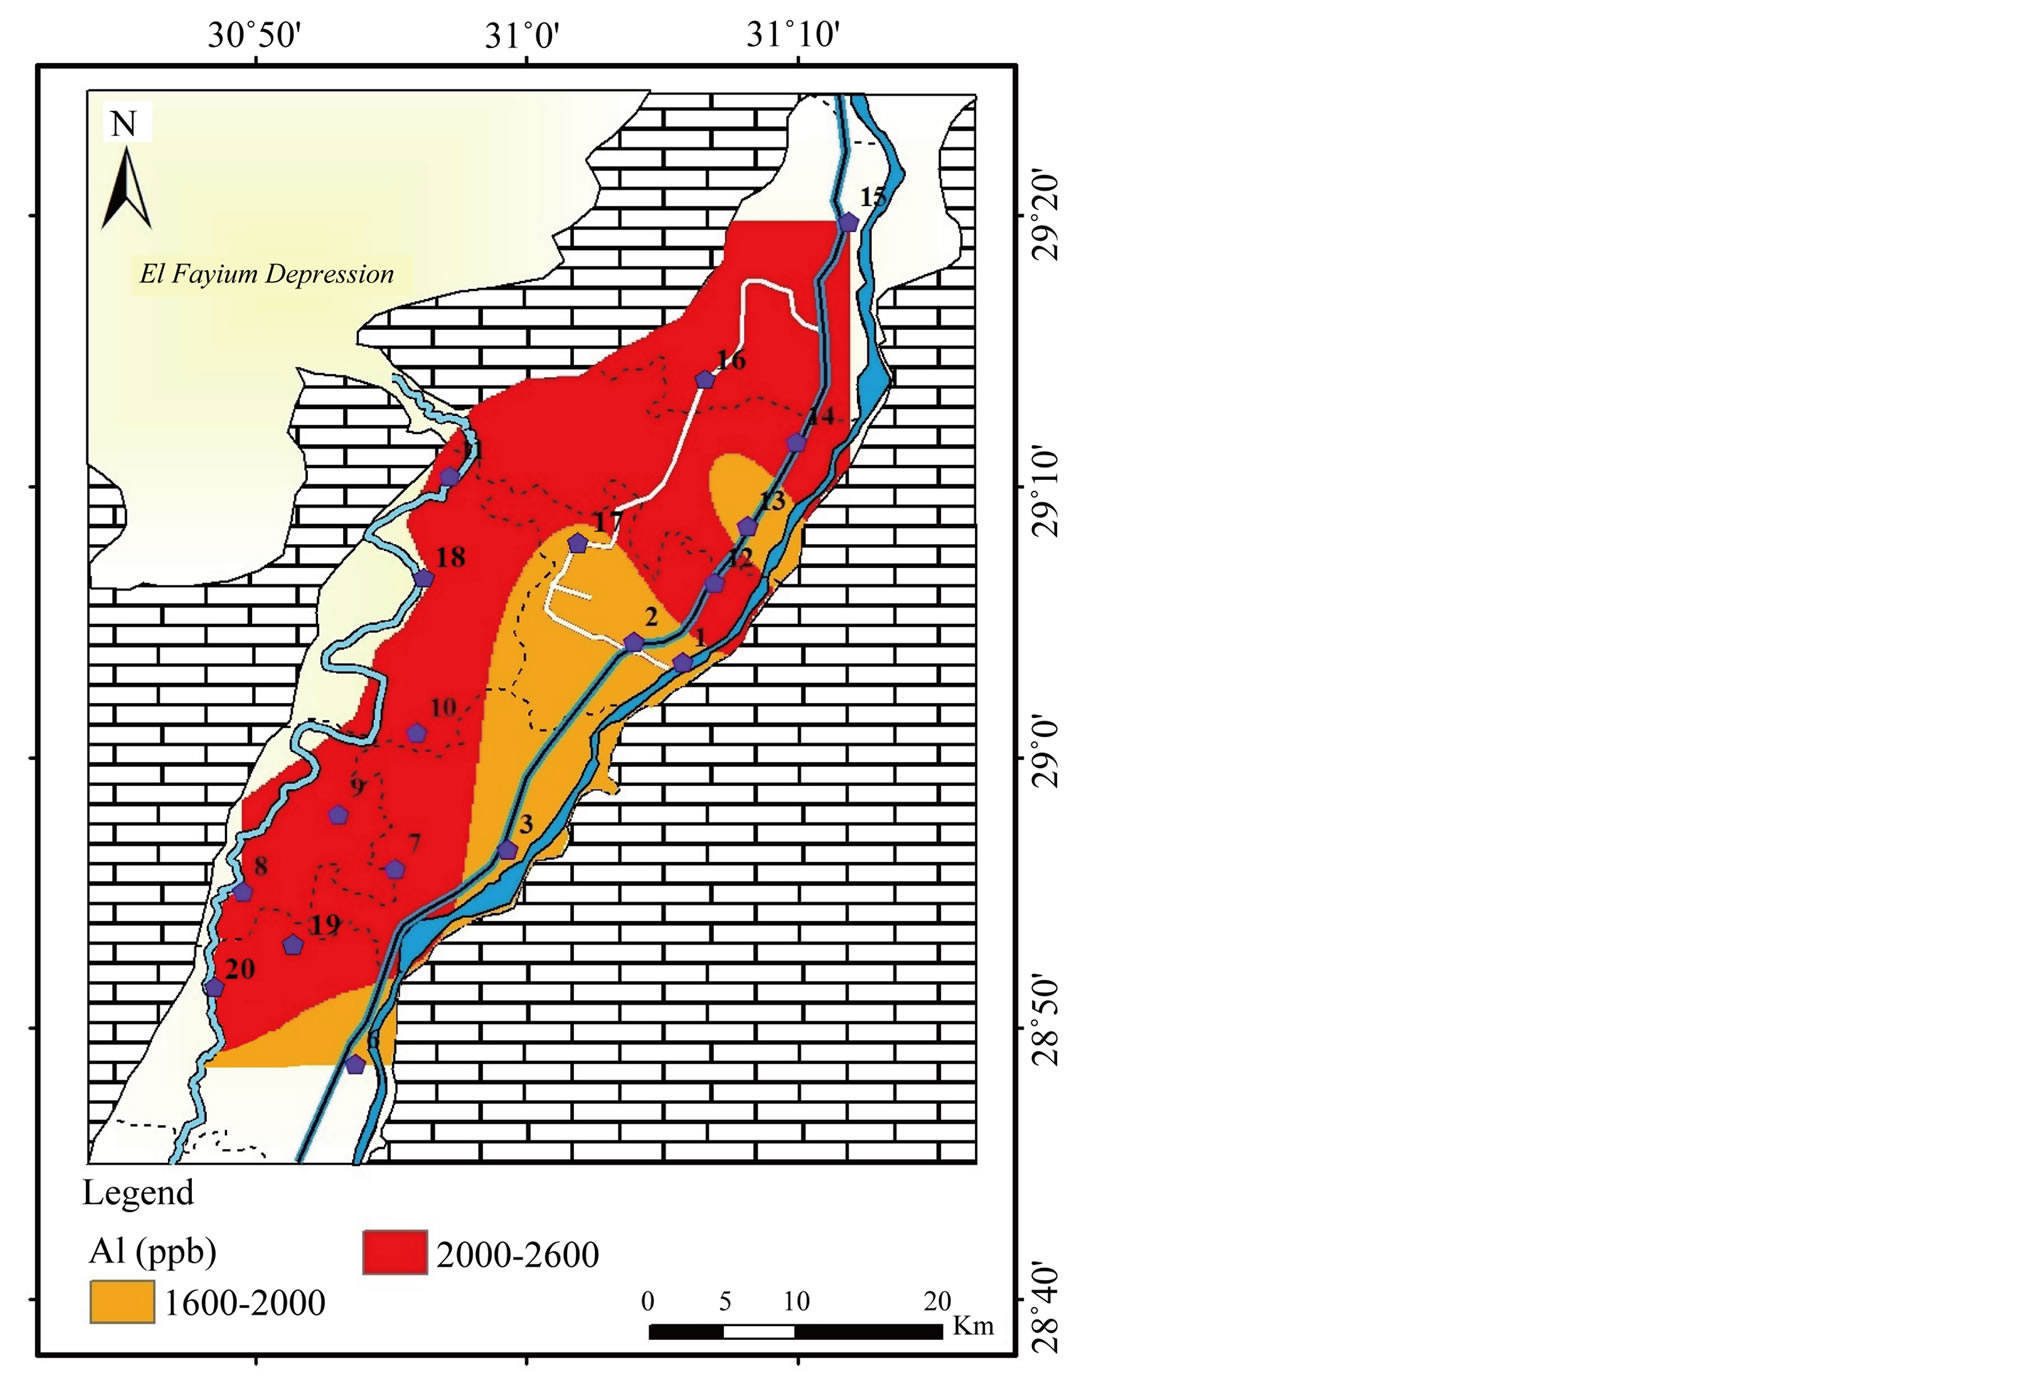
Figure 16. Geochemical map of Al in the surface water in the study area.
drinking water in all surface water samples (ten-fold the GV limit). Aluminum is the most abundant metallic element and constitutes about 8% of Earth’s crust. It occurs naturally in the environment as silicates, oxides, and hydroxides, combined with other elements, such as sodium and fluoride, and as complexes with organic matter. In addition to the natural sources of Al from soil (Table 4), this serious water pollution by Al (up to 2500 μg/l) is most probably provoked by anthropogenic activity, especially because there is no constrains on using Al for manufacturing household utensils in Egypt as well as most other Arab States. It is used in the transportation machinery, construction, a wide range of household items; from cooking utensils to watches; electrical conductors, explosives, pigments, paints, and in the coagulation process on water treatment to reduce organic matter, color, turbidity and microorganism levels. It is also used in food processing (baking powders, bleached flour, grated cheese, and table salt) and in aluminum cans [1,19,25].
Barium (Ba) and Zinc (Zn): the concentration of Ba and Zn range from 20 to 225 µg/l and <1 and 1700 µg/l, respectively (Table 2). The highest concentrations of Ba are noticed in the northeast and southwest (Figure 17). Whereas, the highest concentration of Zn is recorded in the southwest (Figure 18). Ba and Zn values were below the MPL for drinking and irrigation water [1,2].
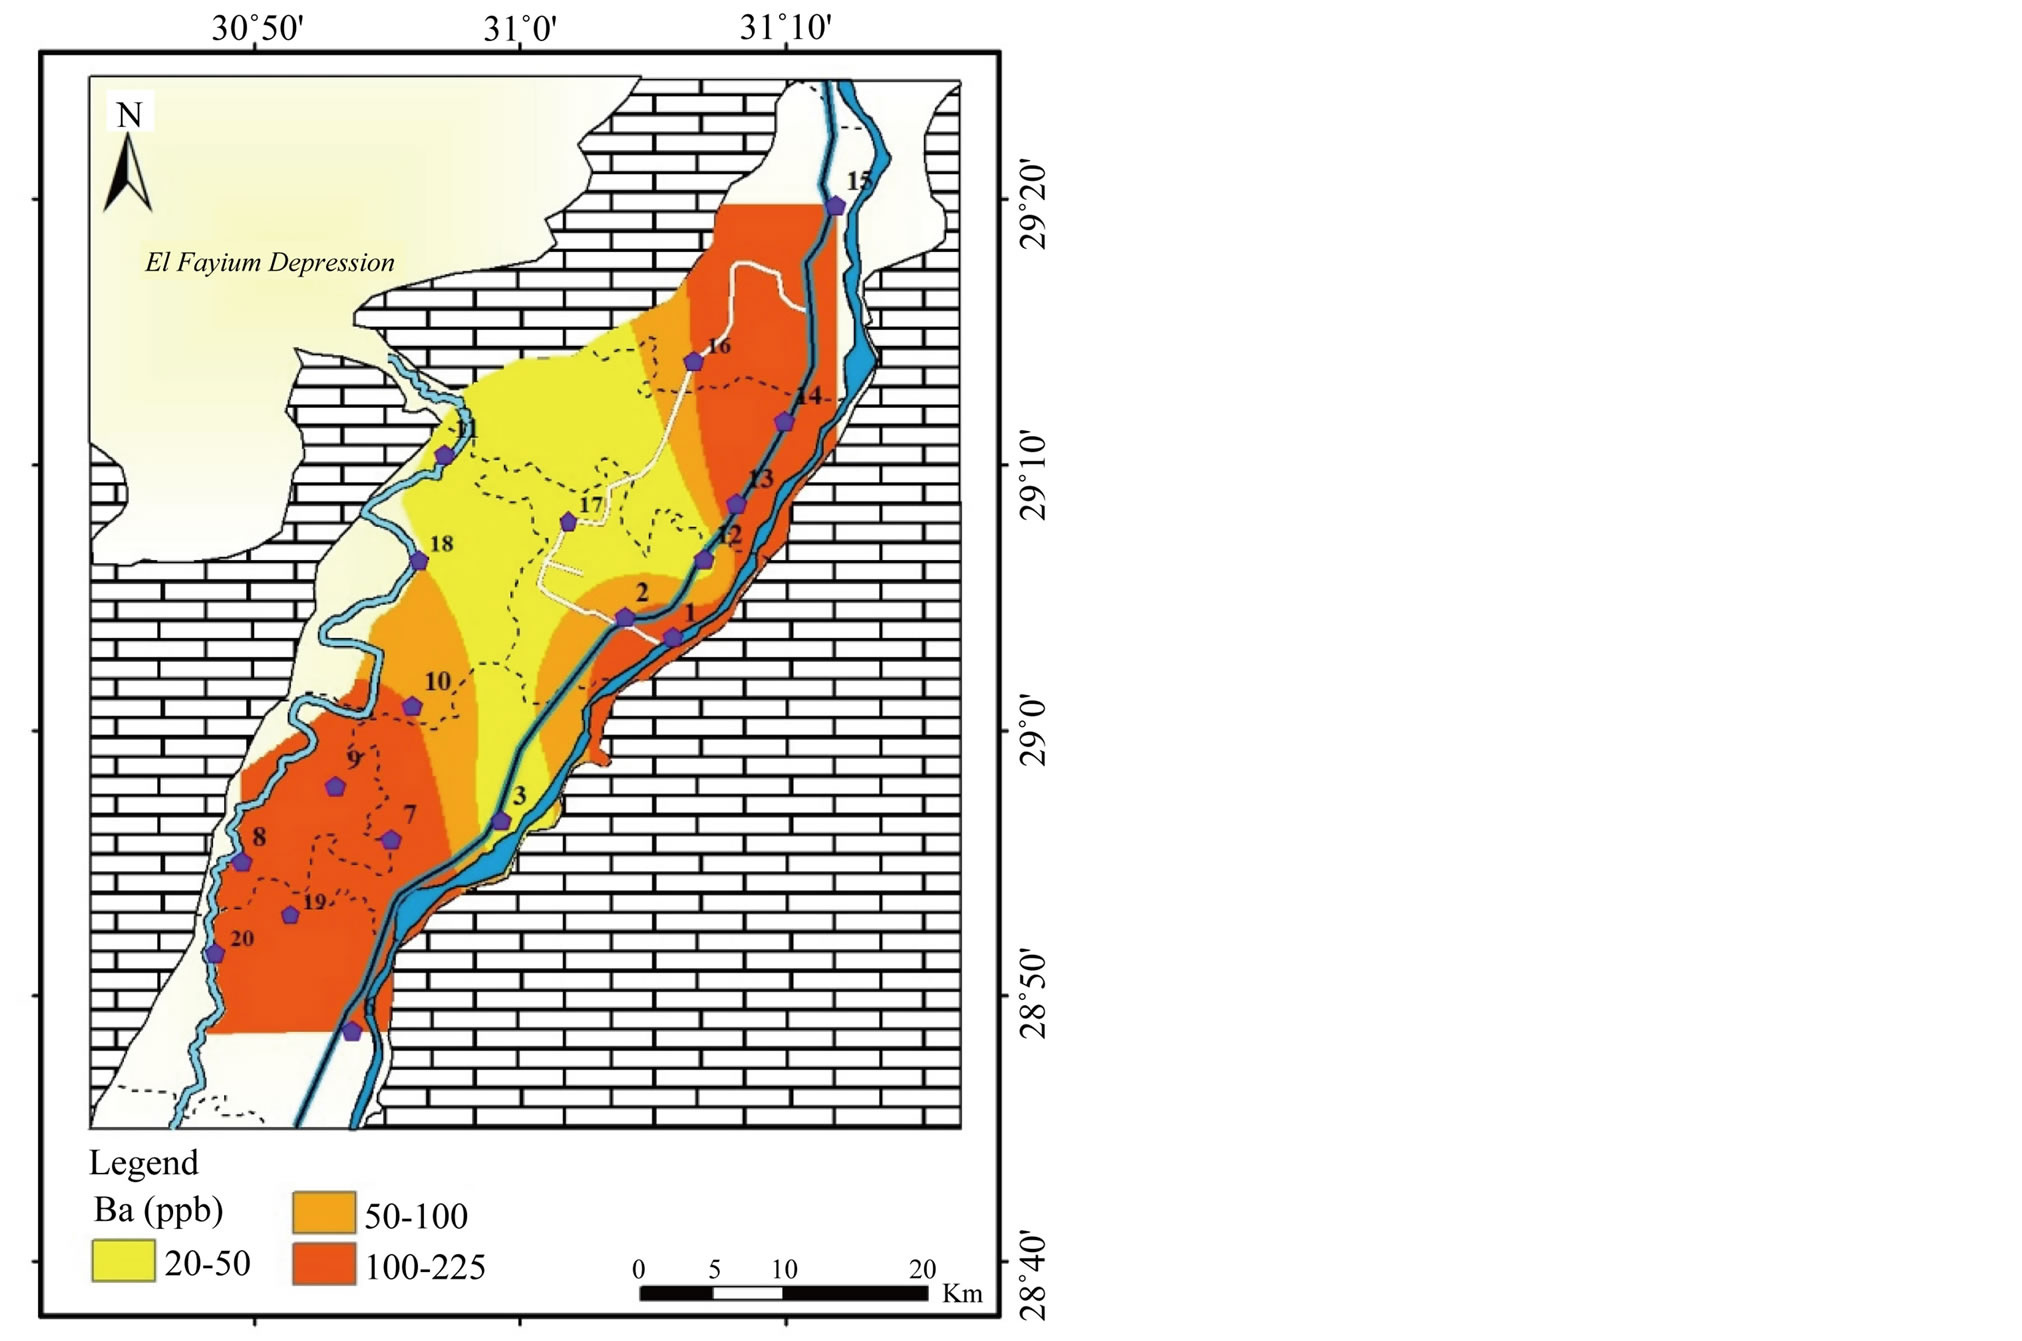
Figure 17. Geochemical map of Ba in the surface water in the study area.
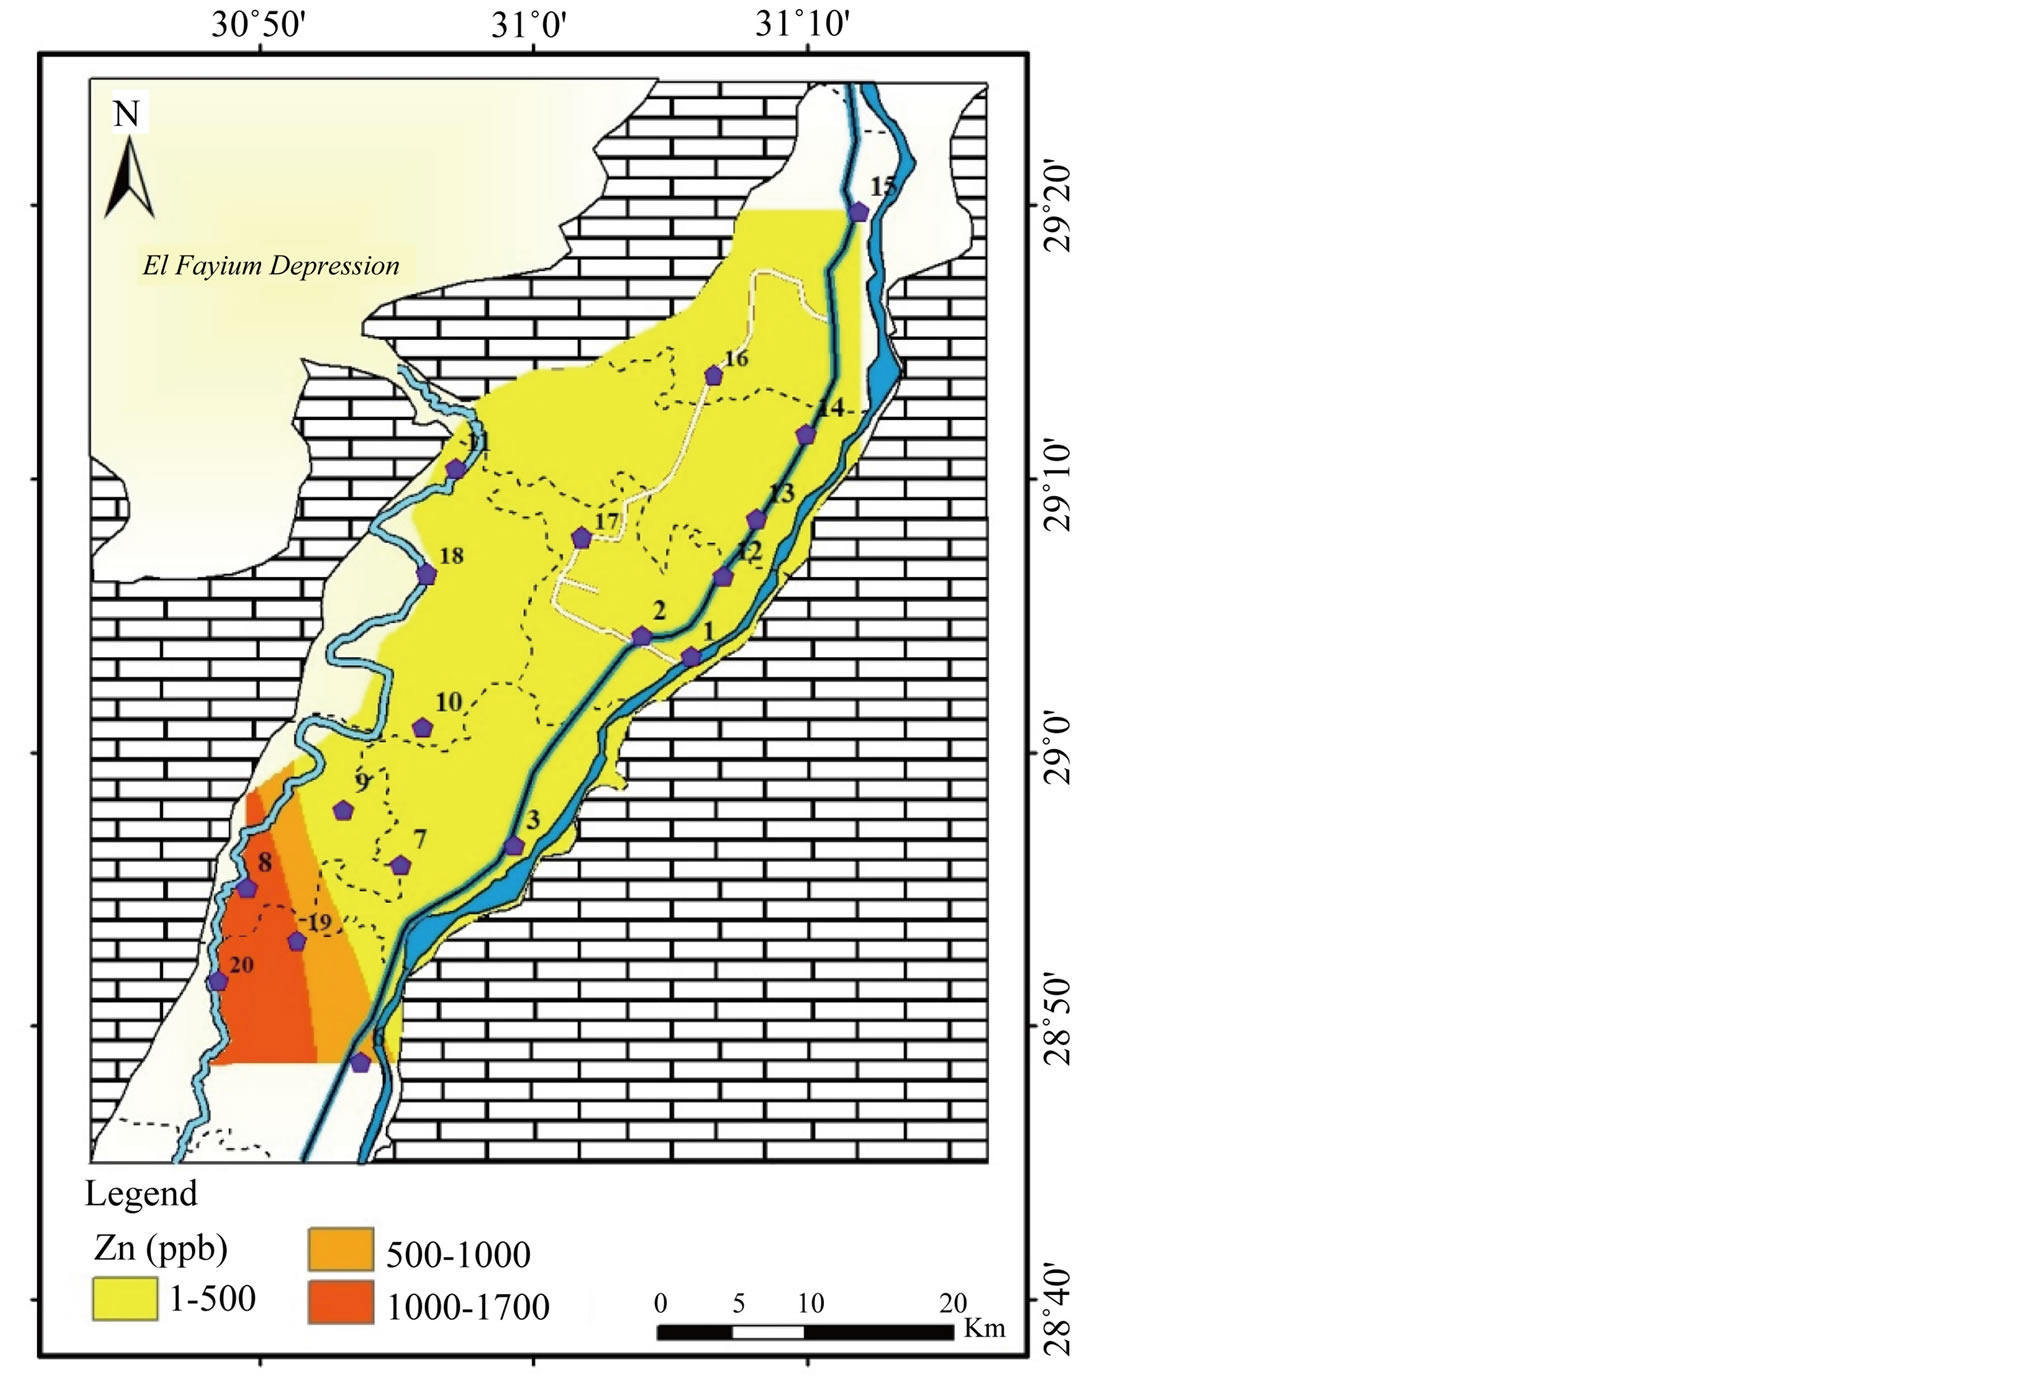
Figure 18. Geochemical map of Zn in the surface water in the study area.
Vanadium (V): The concentration of V varies between <5 to 187 µg/l, (Table 2) and highest value appears in the northeast (Figure 19). The concentration of vanadium in drinking-water depends significantly on geographical location.
To summarize the information in a smaller set of factors or components for prediction purposes, factor analysis (a multivariate statistical technique) has been utilized to examine the underlying patterns or relationships for the major ions and heavy metals in surface water. Five factors were extracted (Figure 20).
Factor 1 is highly positive loading with EC, TDS, Cd, Cu, V and major ions (Figure 20). It is attributed to influence of lithogenic and anthropogenic activities. It can be named lithogenic and anthropogenic factor. Factor 2 is highly positive loading with Co, Fe, Mg, Ca and HCO3 (Figure 20) being of common source (agriculture activities). It can be named agriculture factor. Factor 3 is highly positive loading with Mn and negatively with pH (Figure 20). It is caused by the impact of pH. Factor 4 is highly positive loading with Al and Fe and negatively with Cu (Figure 20). It may be attributed to the tools and material which made by aluminum that human used especially. Factor 5 is highly positive loading with Ba and Zn (Figure 20) which occur in water from industrial wastes.
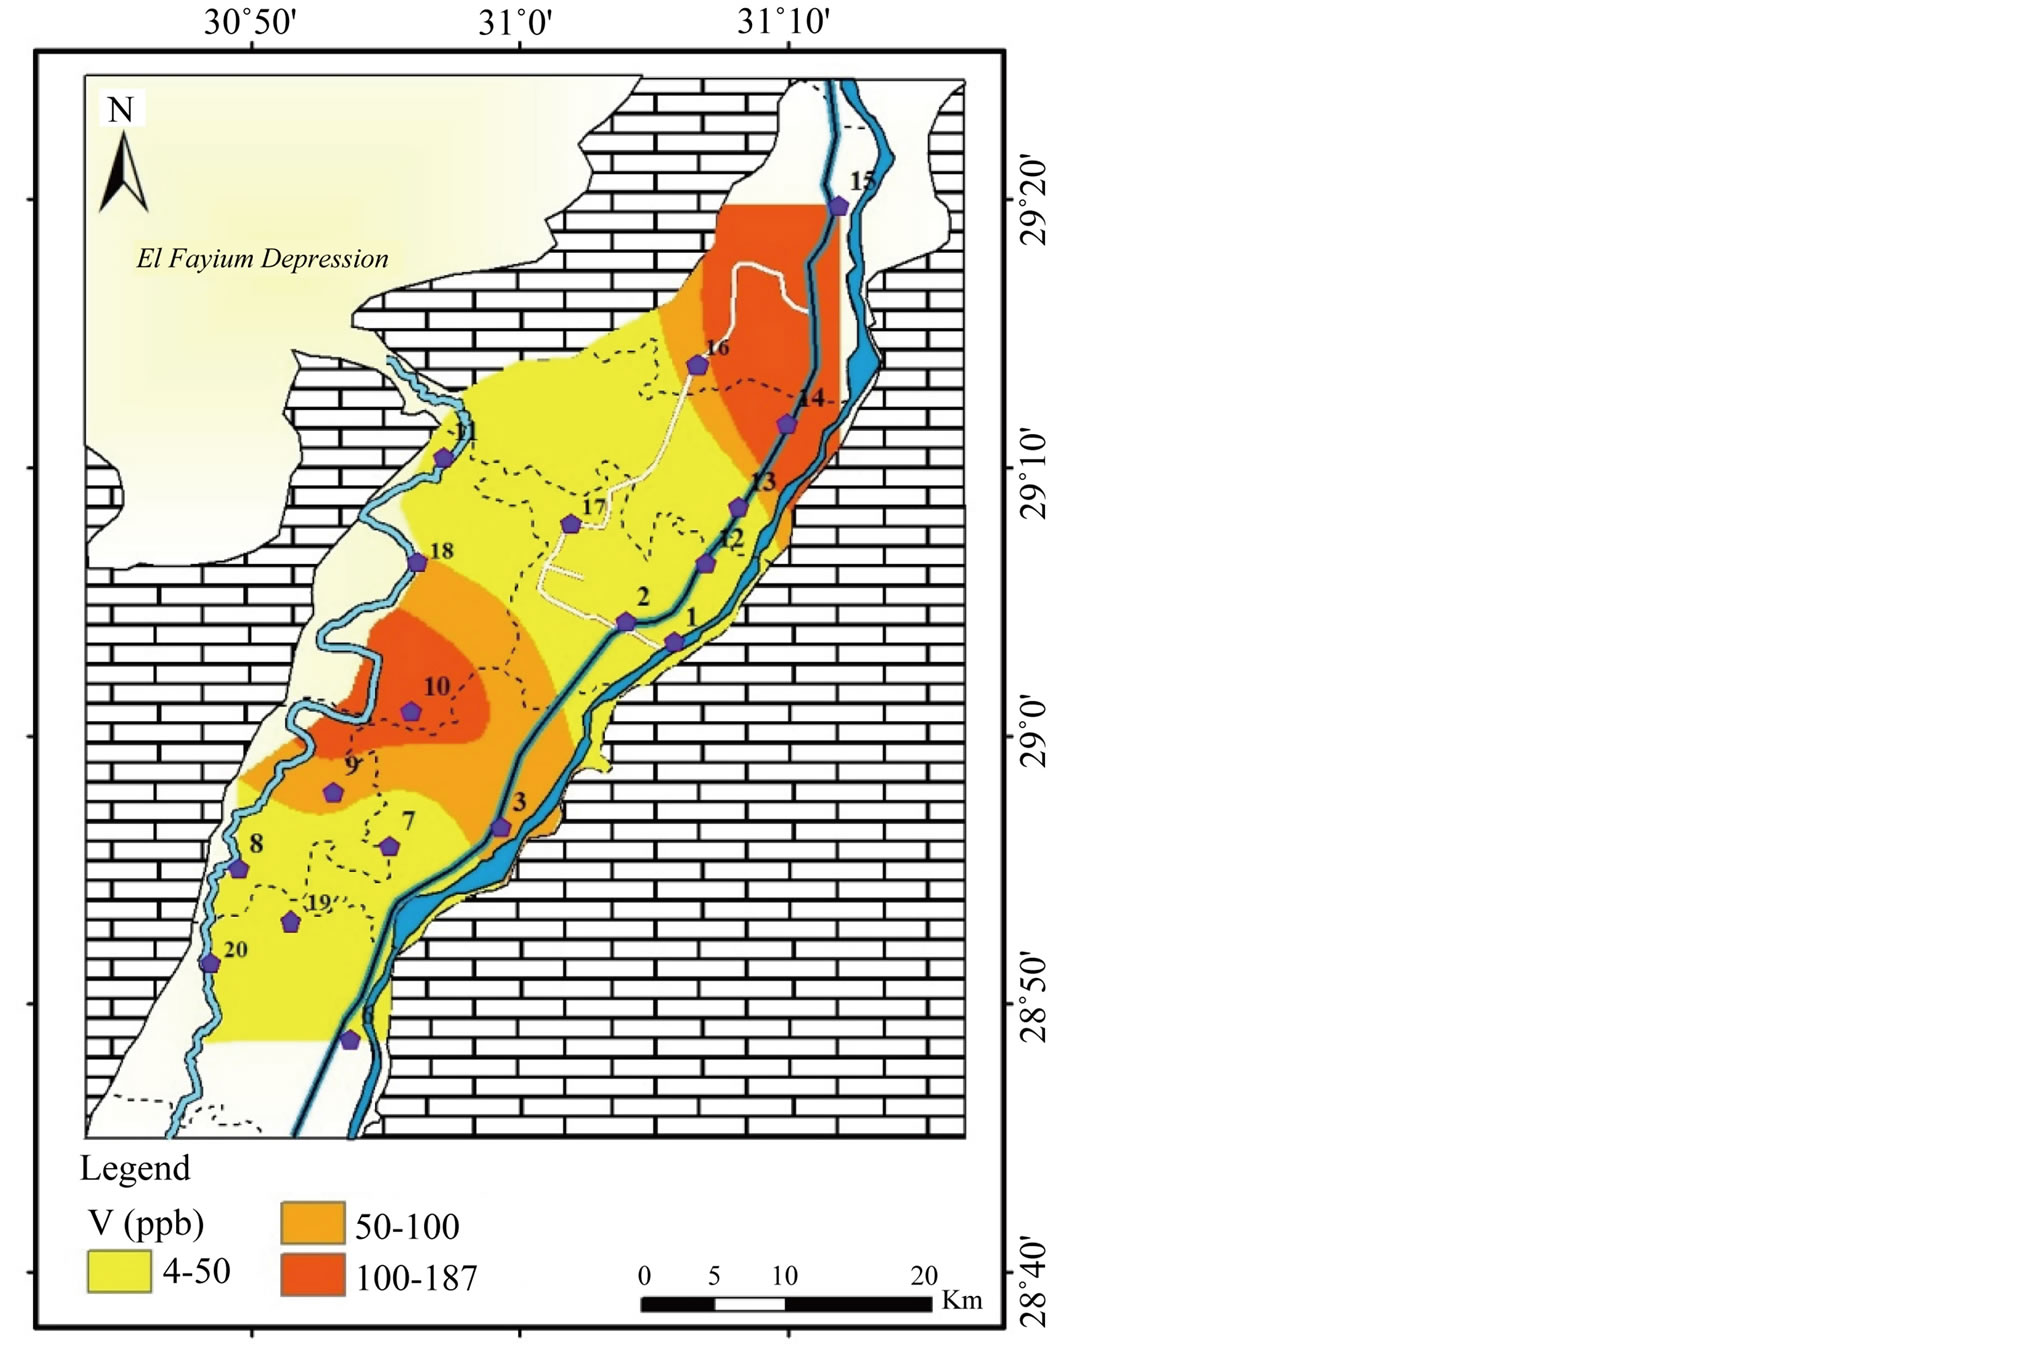
Figure 19. Geochemical map of V in the surface water in the study area.
4.4. Groundwater
The chemical analyses of two groundwater samples collected from Beni Suef Governorate (G4 and G5) at Beba and El-Fashn centers (Figure 1 and Table 6) suggest:
High values of pH, Ec, TDS and major ions (Ca2+, Mg2+, Na+,
K+, Cl−,
 ,
,
 and
and ) are noticed
in G4 sample at Beba center (Table 6). In spite of this increase, the values
are still below the MPL given by WHO [1]. As for the heavy metals, high concentrations
of Al and Mn are noticed in both samples (G4 and G5), higher than MPL given by WHO
[1] (200 and 400 µg/l, respectively). Besides, Cd, Fe and Pb concentrations
exceed the MPL for drinking water (3, 300, 10 µg/l, respectively) in G5 sample
at El-Fashn center (Table
6).
) are noticed
in G4 sample at Beba center (Table 6). In spite of this increase, the values
are still below the MPL given by WHO [1]. As for the heavy metals, high concentrations
of Al and Mn are noticed in both samples (G4 and G5), higher than MPL given by WHO
[1] (200 and 400 µg/l, respectively). Besides, Cd, Fe and Pb concentrations
exceed the MPL for drinking water (3, 300, 10 µg/l, respectively) in G5 sample
at El-Fashn center (Table
6).
The TDS and major ions in groundwater can mainly be attributed to leaching processes through the facies of the Quaternary water bearing formations (Holocene and Pleistocene deposits). In addition to the interaction with sediments and soil, the direct infiltration of surface water (irrigation water and wastewater from drains), seepage from septic tanks, construction of water pipes, use of fertilizers and pesticides and evaporation processes during flood irrigation contribute to the heavy metals content in groundwater especially in G5, being an agriculture area [11,13,17,19].
In addition to the previously mentioned hazardous
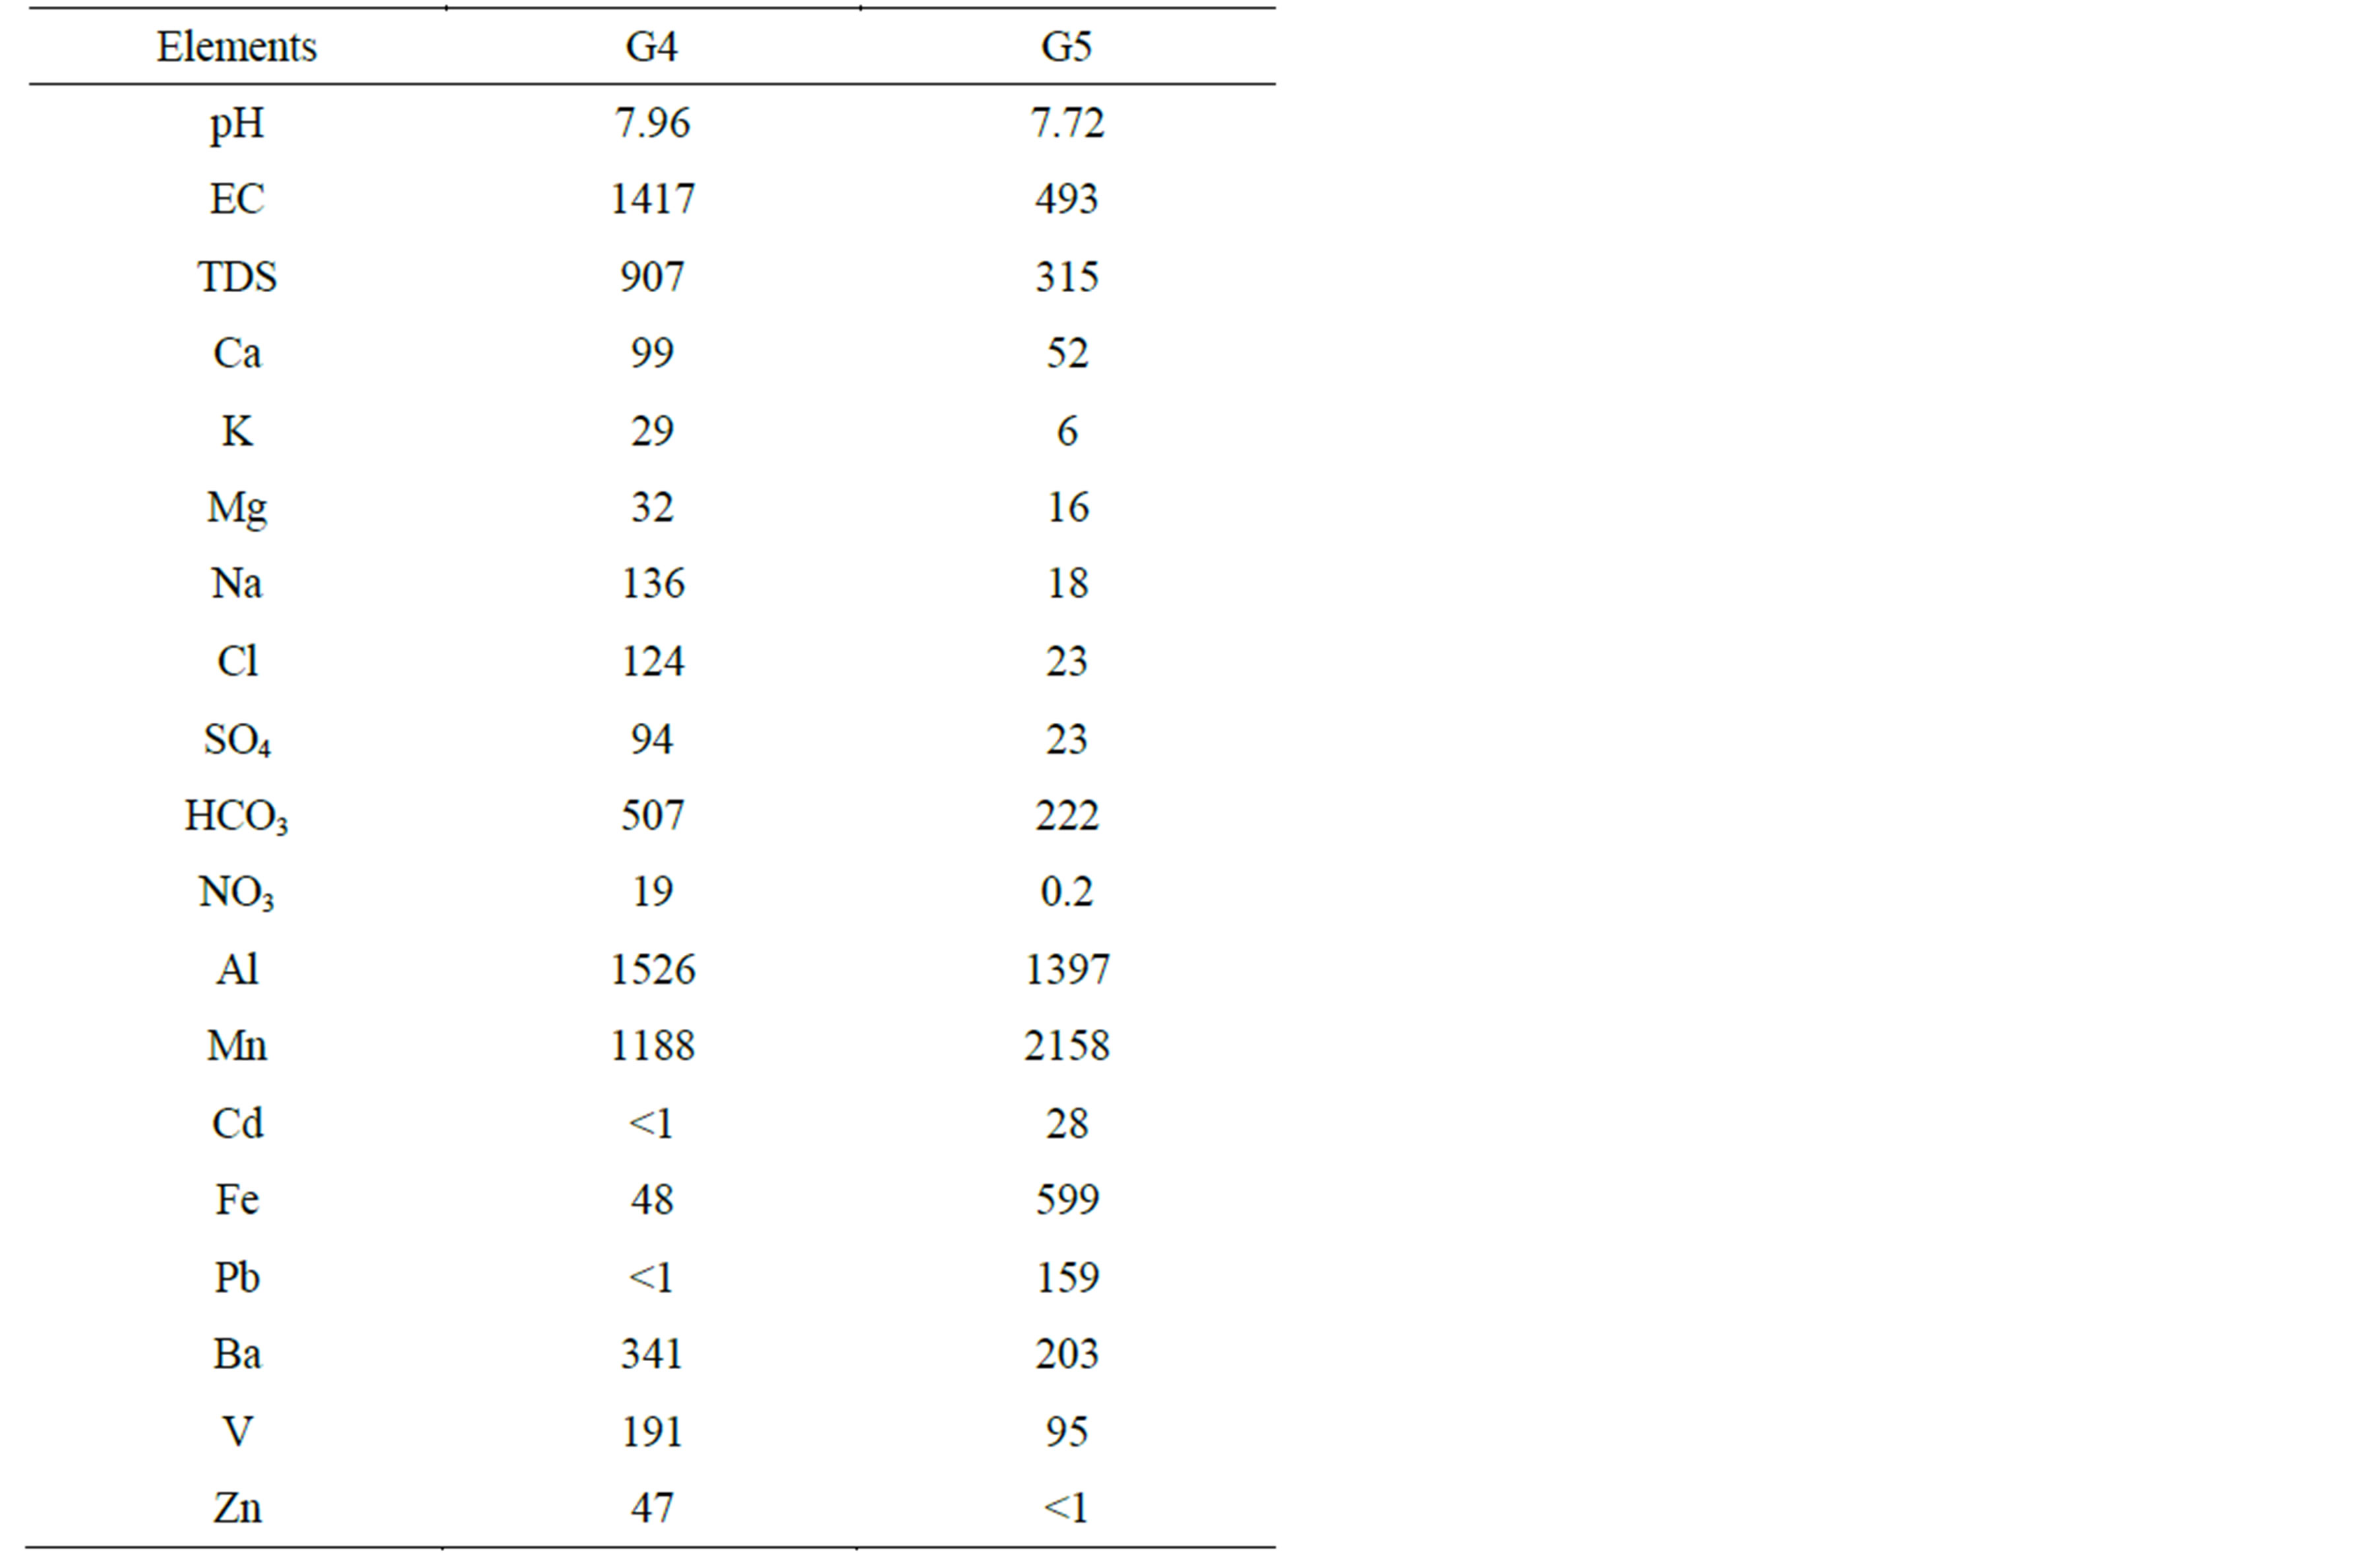
Table 6. Chemical analysis of groundwater samples. Note that major elements are given in mg/l while heavy metals in µg/l.
elements in surface and groundwater, some other elements have concentrations below their detection limit of the used analytical technique, i.e., ICP-MS, such as; As, Cr, Pb, Ni, Sb and Se (<1 μg/l), and Sn (<5 μg/l).
5. Conclusions
Beni Suef is one of the agricultural governorates in Egypt. It is mainly dependent on the surface water resources to supply its requirements (drinking, irrigation and industry). Surface and groundwater in the study area are considered potable for drink and irrigation based on the TDS and major ions concentrations.
Highest concentrations of TDS and major ions such as Na+, K+,
Cl−,
 and
and
 are recorded in El-Ibrahimia canal at El-Wasta center in the north. In addition
to high value of Cd. This is attributed to the effect of sewage water from El-Moheet
drainage. High concentrations of Mg2+, Ca2+ and
are recorded in El-Ibrahimia canal at El-Wasta center in the north. In addition
to high value of Cd. This is attributed to the effect of sewage water from El-Moheet
drainage. High concentrations of Mg2+, Ca2+ and
 appeared in the irrigation drains in the west accompanied with high values of Fe
and Co, which attributed to the effect of agriculture activities (irrigation effluent,
fertilizers and pesticide and sewage water that used in irrigation).
appeared in the irrigation drains in the west accompanied with high values of Fe
and Co, which attributed to the effect of agriculture activities (irrigation effluent,
fertilizers and pesticide and sewage water that used in irrigation).
Regarding the MPL quoted by the WHO [1], water resources in the study area are polluted by Al, Cd and Fe and by Co and Cu. High concentration (>MPL) of Mn was recorded in River Nile and groundwater samples.
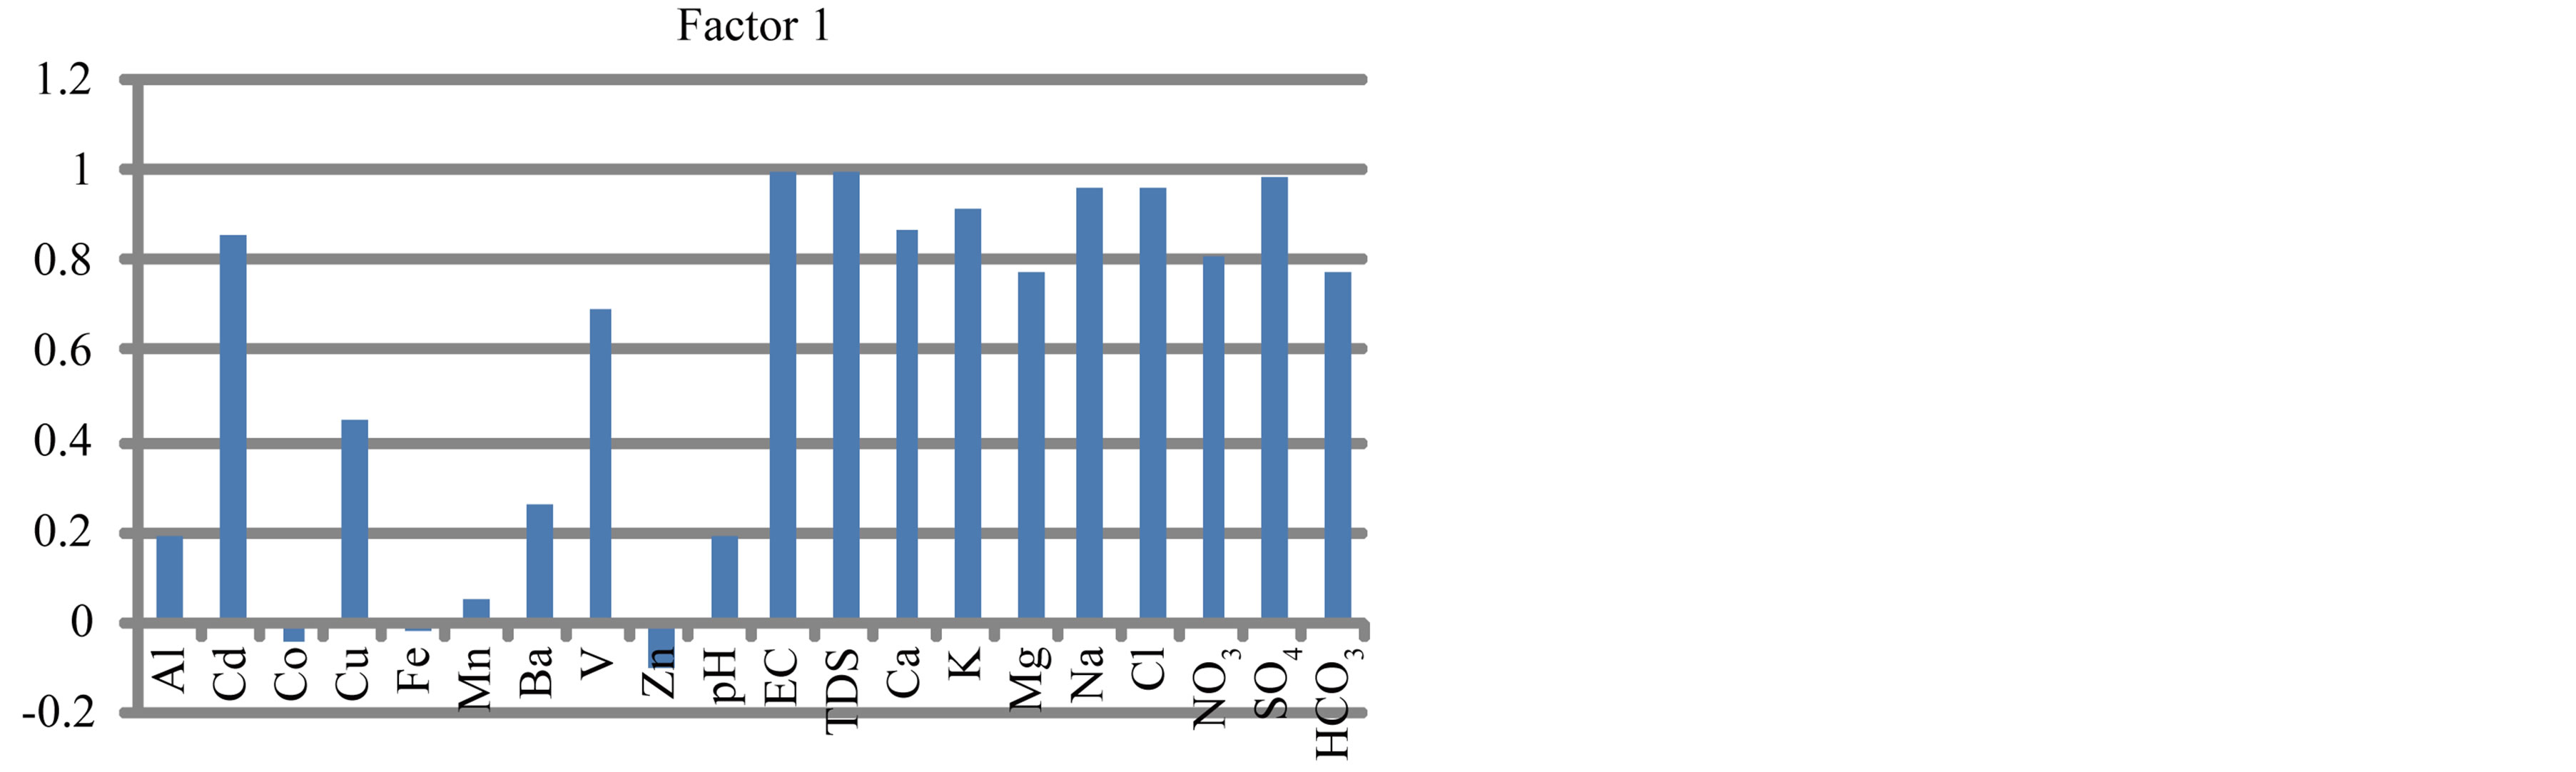


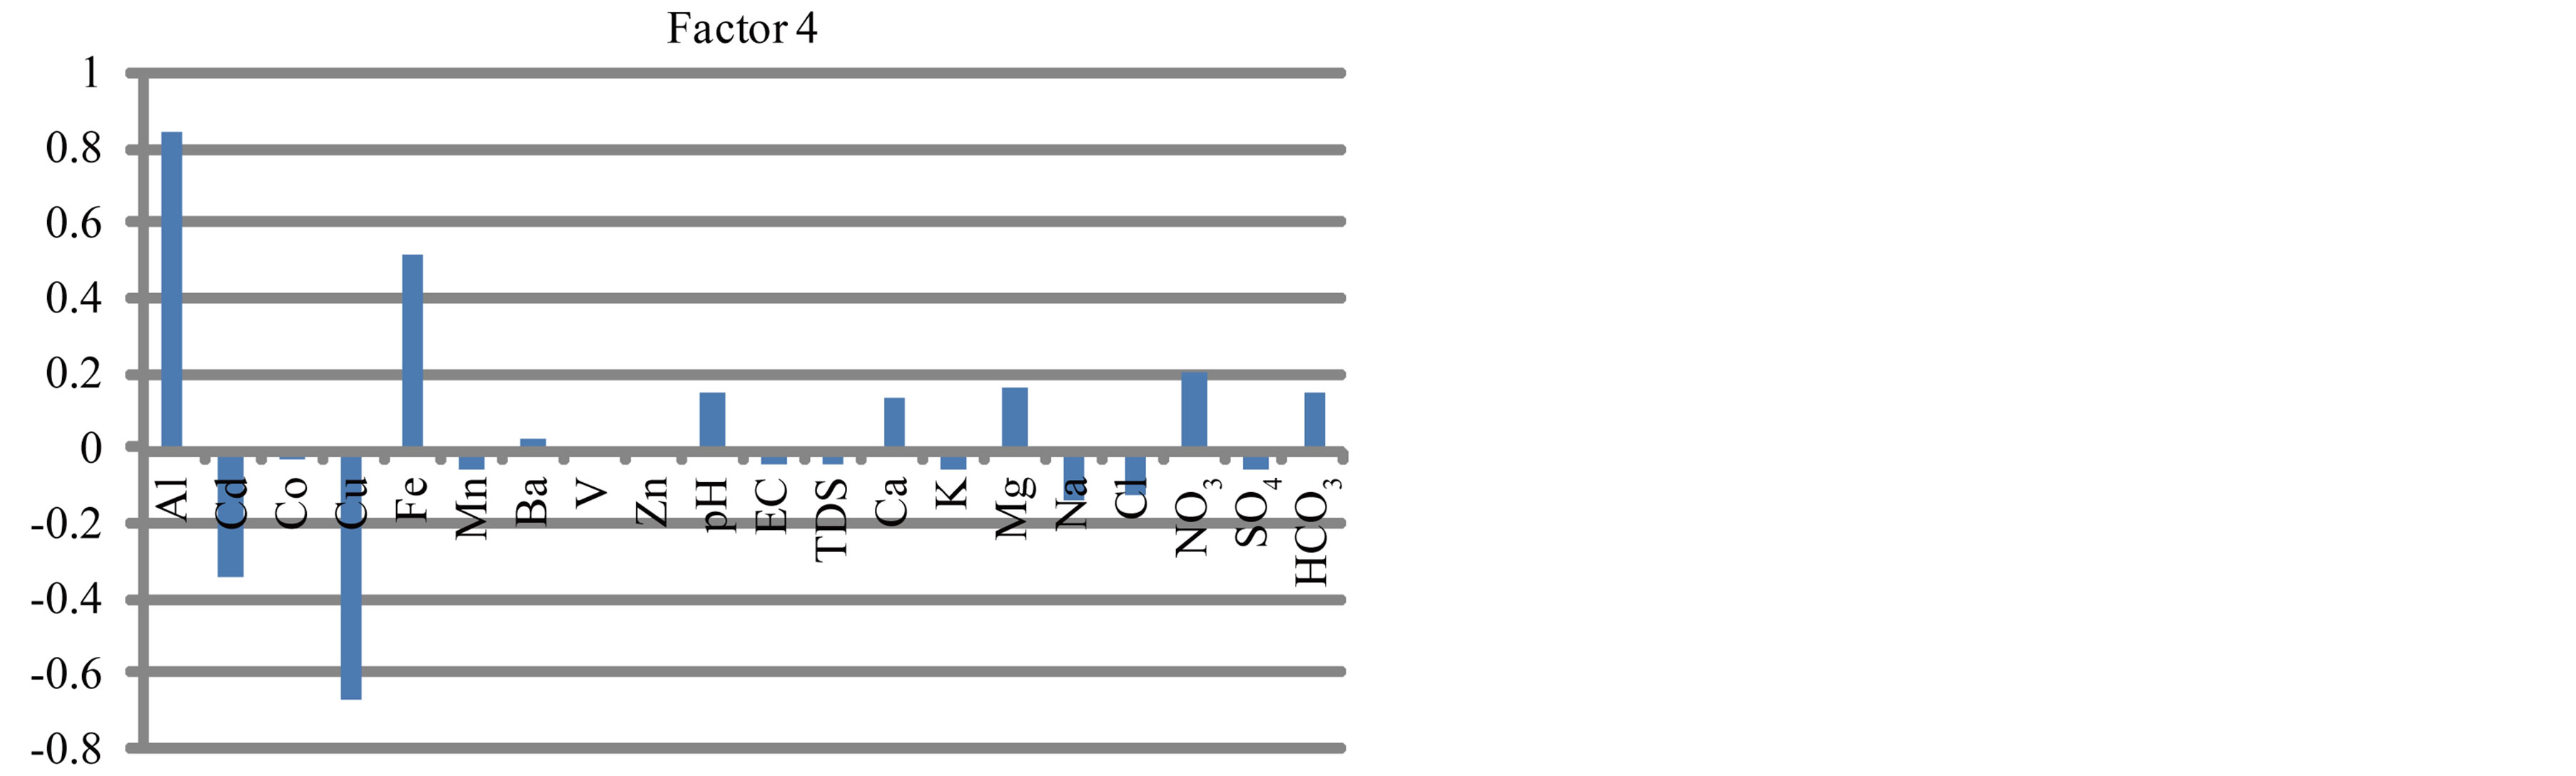

Figure 20. Factor analyses of surface water in study area.
The surface and groundwater in Beni Suef suffer from pollution due to the impact of unsupervised anthropogenic activities including excessive usage of fertilizers and pesticide, waste disposal and industrial waste, seepage from septic tanks, construction of water pipes, wastewater from El-Moheet drainage and evaporation processes during flood irrigation.
REFERENCES
- WHO, “Guidelines for Drinking Water Quality,” 4th Edition, World Health Organization, Geneva, 2011.
- FAO, “Water Quality for Agriculture,” Food and Agriculture Organization, Rome, 1994. http://www.fao.org/docrep/003/t0234e/t0234e00.HTM
- S. K. Das, M. K. Bhunia and A. Bhaumik, “Solvothermal Synthesis of Mesoporous Aluminophosphate for Polluted Water Remediation,” Microporous and Mesoporous Materials, Vol. 155, 2012, pp. 258-264. http://dx.doi.org/10.1016/j.micromeso.2012.01.034
- A. Melegy, “Adsorption of Lead (II) and Zinc (II) from Aqueous Solution by Bituminous Coal,” Geotechnical and Geological Engineering, Vol. 28, No. 5, 2010, pp. 549-558. http://dx.doi.org/10.1007/s10706-010-9309-5
- S. Wang and Y. Peng, “Natural Zeolites as Effective Adsorbents in Water and Wastewater Treatment,” Chemical Engineering Journal, Vol. 156, No. 1, 2010, pp. 11-24. http://dx.doi.org/10.1016/j.cej.2009.10.029
- M. Pirsaheb, T. Khosravi, K. Sharafi, L. Babajani and M. Rezaei, “Measurement of Heavy Metals Concentration in Drinking Water from Source to Consumption Site in Kermanshah—Iran,” World Applied Sciences Journal, Vol. 21, No. 3, 2013, pp. 416-423.
- Egyptian Environmental Affairs Agency, “Environmental characterization of Beni Suef Governorate,” 2003. (In Arabic) http://www.eeaa.gov.eg/arabic/info/report_gov_profiles.asp
- M. Abdel-Rahman, “Pliocene and Quaternary Deposits of Beni Suef—East Fayum and Their Relation to the Geological Evaluation of the River Nile,” Ph.D. Thesis, Cairo University, Giza, 1992.
- H. S. Hassan, “Geological Studies of the Pliocene-Quaternary Sediments in the Saff-Sukkara Area and Their Uses as Building Materials,” Ph.D. Thesis, Cairo University, Giza, 1994.
- G. Abdel-Mageed, “Hydrogeological and Hydrogeochemical Studies of the Nile Valley Area, Beni Suef Governorate, Egypt,” M.Sc. Thesis, Cairo University, Giza, 1997.
- M. El Kashouty, “Modeling of Limestone Aquifer in the Western Part of the River Nile between Beni Suef and El Minia,” Arabian Journal of Geosciences, Vol. 6, No. 1, 2013, pp. 55-76.
- N. S. Magesh, S. Krishnakumar, N. Chandrasekar and J. P. Soundranayagam, “Groundwater Quality Assessment Using WQI and GIS Techniques, Dindigul District, Tamil Nadu, India,” Arabian Journal of Geosciences, Vol. 6, No. 11, 2013, pp. 4179-4189.
- S. Salman, “Geochemical and Environmental Studies on the Territories West River Nile, Sohag Governorate— Egypt,” Ph.D. Thesis, Al-Azhar University, Cairo, 2013
- ICdA (The International Cadmium Association), “Level of Cadmium in the Environment,” 2013. http://www.cadmium.org/pg_n.php?id_menu=6
- J. Pan, J. A. Plant, N. Voulvoulis, C. J. Oates and C. Ihlenfeld, “Cadmium Levels in Europe: Implications for Human Health,” Environmental Geochemistry and Health, Vol. 32, No. 1, 2009, pp. 1-12.
- J. M. R. S. Bandara, H. V. P. Wijewardena, Y. M. A. Y. Bandara, R. G. P. T. Jayasooriya and H. Rajapaksha, “Pollution of River Mahaweli and Farmlands under Irrigation by Cadmium from Agricultural Inputs Leading to a Chronic Renal Failure Epidemic among Farmers in NCP, Sri Lanka,” Environmental Geochemistry and Health, Vol. 33, No. 5, 2010, pp. 439-453.
- A. Melegy, A. M. Shaban, M. M. Hassaan and S. A. Salman, “Geochemical Mobilization of Some Heavy Metals in Water Resources and Their Impact on Human Health in Sohag Governorate, Egypt,” Arabian Journal of Geosciences, 2013. http://dx.doi.org/10.1007/s12517-013-1095-y
- British Columbia, “Iron and Manganese in Groundwater,” Water Stewardship Information Series, 2007. http://www.env.gov.bc.ca/wsd/plan_protect_sustain/groundwater/library/ground_fact_sheets/pdfs/fe_mg(020715)_fin2.pdf
- A. El-Kammar, M. El-Kashouty, M. M. Yehia and Gh. Miro, “Environmental Hydrogeochemistry of Groundwater in Central Damascus Basin, Syria,” Journal of the Sedimentological Society of Egypt, Vol. 20, No. 1110-2527, 2012, pp. 73-81.
- Lenntech (Water Treatment Solution), “Copper,” 2013. http://www.lenntech.com/periodic/elements/cu.htm
- MDH Minnesota Department of Health, “Copper in Drinking Water, Health Effects and How to Reduce Exposure,” 2005. http://www.health.state.mn.us/divs/eh/water
- N. K. Nagpal, “Technical Report—Water Quality Guidelines for Cobalt,” 2004. http://www.env.gov.bc.ca/wat/wq/BCguidelines/cobalt/cobalt_tech.pdf
- Environment Canada, “Federal Environmental Quality Guidelines, Cobalt,” 2013. http://www.ec.gc.ca/ese-ees/default.asp?lang=En&n=92F47C5D-1
- L. Paul, “The Dangers of Aluminum Toxicity. Alternative Medicine Site,” 2011. http://www.bellaonline.com/articles/art7739.asp
- WHO, “Aluminum in Drinking Water: Background Document for Development of WHO Guidelines for DrinkingWater Quality,” Vol. 2, World Health Organization, Geneva, 2003.