Optics and Photonics Journal
Vol.06 No.07(2016), Article ID:68266,18 pages
10.4236/opj.2016.67017
Light Reflection by Cuticles of Chrysina Jewel Scarabs: Optical Measurements, Morphology Characterization, and Theoretical Modeling
W. E. Vargas1,2*, M. Hernández-Jiménez1, E. Libby3, D. E. Azofeifa1, C. Barboza4, Á. Solis5
1Centro de Investigación en Ciencia e Ingeniería de Materiales & Escuela de Física, Universidad de Costa Rica, San José, Costa Rica
2Academia Nacional de Ciencias de Costa Rica, San José, Costa Rica
3Centro de Investigación en Ciencia e Ingeniería de Materiales and Escuela de Química, Universidad de Costa Rica, San José, Costa Rica
4Centro de Investigación en Estructuras Microscópicas, Universidad de Costa Rica, San José, Costa Rica
5Museo Nacional de Costa Rica, San José, Costa Rica

Copyright © 2016 by authors and Scientific Research Publishing Inc.
This work is licensed under the Creative Commons Attribution International License (CC BY).
http://creativecommons.org/licenses/by/4.0/


Received 26 April 2016; accepted 10 July 2016; published 13 July 2016
ABSTRACT
Cuticles of some Chrysina scarabs are characterized by flat, graded, and twisted structures of nanosized chitin fibrils. As inferred from SEM images, each species has its own spatial period or pitch P which is dependent on the depth z through the cuticle. From Berreman’s formalism, taking into account the corresponding P(z) dependence, we evaluate reflection spectra of C. aurigans and C. chrysargyrea scarabs. The spectra display the main spectral features observed in the measured ones when small sections of the cuticles are illuminated with non-polarized light, for wavelengths between 300 and 1100 nm. By considering these twisted structures as 1D photonic crystals, an approach is developed to show how the broad band characterizing the reflection spectra arises from a narrow intrinsic photonic band width, whose spectral position moves through visible and near infrared wavelengths. The role of the epicuticle that covers the twisted structures is analyzed in terms of a waxy layer acting as an anti-reflecting coating that also shows low levels of light scattering.
Keywords:
Structural Color, Structural Chirality, Natural Broad Band Reflector, Circular Polarization, Jewel Scarab, Chitin Refractive Index, Uric Acid Refractive Index, Left-Handed Twisted Structure, Bouligand-Type Structure

1. Introduction
As seen in reflection or transmission modes, nanosized non-light absorbing materials can display specific colors when they form part of organized micrometric structures. Constructive light interference is the basic phenomenon behind this physical effect responsible for what is nowadays called structural color, which also includes diffraction by gratings [1] and scattering by natural photonic crystals [2] as mechanisms capable of producing color. In the natural world, this is the case of chitin nano-fibrils which are the main constituent found in the cuticle of scarab beetles, where the micrometric structure consists of a twisted arrangement that shows a left- or right- handed chirality. These helicoidal arrangements, denoted as Bouligand-type chiral structures [3] , are responsible for the circular polarization of the light reflected by the cuticles, an effect first detected by Michelson [4] . From the bottom of the epicuticle, the chitin nano-fibrils are locally organized in planes. In a given plane, the nano- fibrils are parallel to each other but for successive planes the azimuth orientation f of the nano-fibrils gradually changes until completing several cycles [5] . These micrometric structures resemble frozen versions of cholesteric liquid crystals, where the role of the chitin nano-fibrils is played by rod-like macromolecules interacting with each other [6] . There are examples where the chitin nano-fibrils, at a given depth through the cuticle, with the corresponding azimuth angle f specifying their orientation, are organized in extended planes. Cuticle of Chrysina aurigans scarabs is an example. A cut perpendicular or nearly perpendicular to the successive planes is seen in Scanning Electron Microscope (SEM) images as a multilayer structure, with the thinnest black layers corresponding to those depths where the orientation of the chitin nano-fibrils is parallel to the cut [7] . There are also cases where instead of planes of constant f, what is displayed in the SEM images are successive convex cuts of constant f. Cuticles of Chrysina gloriosa and Chrysina boucardi are examples of this type [8] [9] .
Helicoidal structures characterized by a constant pitch Po have been considered in literature [10] as well as arrangements with a small step in the pitch from some depth through the cuticle [11] . Our group has recently reported for Chrysina aurigans scarab beetles the presence of a pitch P that shows a smooth dependence with depth z through the cuticle [7] - [13] , i.e. P = P(z). Such dependence has been obtained from the SEM images that show a cut perpendicular or nearly perpendicular to the layered structure, by assuming a change of π in f when following the depth z from a black layer to the next one. A novel method has been recently reported to obtain the z-dependence of the pitch from SEM images showing an oblique cut of the plywood structure. The displayed images show successive rows of arc-patterns whose shapes depend on the angle of incision and on the local pitch [14] [15] . Helical arrangements with constant pitches will display narrow peaks in their reflection spectra and visual appearances characterized by iridescent colors. Twisted structures with graded pitches show broad bands in their reflection spectra and metal-like appearances. In this work we report on optical measurements carried out by normal illumination with non-polarized light of a small section of the surface of the scarab’s cuticle for golden-like and red C. aurigans, and for silver- and golden-like C. chrysargyrea scarabs (Section 2). Basic aspects of the theoretical framework are summarized in Section 3. The corresponding graded pitches are reported and used in Berremann’s formalism to evaluate reflection spectra of perfect left-handed chiral structures that display the main features observed in the reflection measurements (subsections 4.1 and 4.2). In Section 4.3 the helicoidal structure is treated as a one dimensional photonic crystal, and the dispersion relation characterizing this kind of twisted arrangements is reported. The contributions of non-perfect left-handed twisted arrangements to the reflection spectra are considered in subsection 4.4. A novel analysis of the optical role played by the epicuticle that covers each chiral structure is developed in the subsection 4.5.
2. Optical Measurements
The visual appearances of the four specimens of jewel Chrysina scarabs considered throughout this study are shown in Figure 1. The corresponding reflection spectra are depicted in Figure 2. A small local section of the cuticle’s surface(~0.8 mm2) was normally illuminated with non-polarized light as described elsewhere [16] , for wavelengths between 300 and 1100 nm covering the near ultraviolet, visible and near infrared wavelengths ranges. The number of spectral measurements is Nλ = 800, with a uniform step of 1.0 nm. Measurements were carried out using a fiber optic spectrophotometer (AvaSpec 3648) and a halogen Deuterium lamp (AvaLight DHc), with an aluminium specular reflectance standard (Ocean Optics STAN-SSH) for normalization. The uncertainty in the reflection measurements is around 1%. The background non-polarized Ro-reflection at short wavelengths is due to the epicuticle that coats the left-handed chiral structure.
Although the reflected intensities show some dependence with the illuminated site in the elytron, the differences

Figure 1. Specimens of golden-like and red Chrysina aurigans ((a) & (b)), and golden- and silver-like Chrysina chrysargyrea ((c) & (d)) scarab beetles.


Figure 2. Reflection spectra of the cuticle of: (a) golden-like C. aurigans, (b) red C. aurigans, (c) golden-like C. chrysargyrea, and (d) silver-like C. chrysargyrea scarab beetles normally illuminated with non-poarized radiation. The average reflection at short wavelengths (Ro) is indicated. The ultraviolet (UV) and near infrared (NI) spectral regions are labeled, and the color bar indicates the visible (V) spectral range. The spectral widths of shoulders, plateaus or peaks just after the reflection edges (Δλ') and of the fine structures contained in the reflection band (Δλ) are also indicated.
are not higher than 15% in the spectral regions of maximum reflection. The spectral features of the measurements do not show any dependence with the specific site considered [7] . The four spectra show broad reflection bands whose bandwidths are approximately given by Δλexp = 375 nm for the golden-like C. aurigans, Δλexp = 328 nm for the red C. aurigans, Δλexp = 463 nm for the golden-like C. chrysargyrea, and Δλexp = 334 nm for the silver-like C. chrysargyrea. Each  with Δλ' as an estimate of the spectral width of the shoulder, plateau or first peak displayed just after the reflection edge, and Δλ as an estimate of the spectral width of the rest of the bands that show fine structures. These spectral widths will serve us, in Section 4.3, as guide to analize later how the reflection band emerges from the photonic crystal behavior of the structures. The bandwidths Δλexp are about one order of magnitude larger than those found in cholesteric liquid crystals [6] . The spectra also display shoulders or plateaus: they begin just after the reflection edges for the first three cases, while for the silver-like C. chrysargyrea the plateau appears after three reflection peaks with lower values (which are between 550 and 625 nm). The first three bands display ripple structures superimpossed on the main oscillations in the regions of high reflections values, which cover the visible range or part of it, with their tails in the near infrared. The well defined ripple structures observed through the whole spectral range considered suggest that the reflected light is predominantly coherent. A wider fine structure has been observed in the reflection spectrum of C. optima scarabs when the cuticle is normally illuminated with visible light [17] [18] . A similar structure has been displayed in the spectral ellipticity and degree of polarization characterizing the reflection of light by the cuticle of Cetonia aurata scarabs [19] . Wider oscillations are observed through the reflection band of the silver-like C. chrysargyrea, with loss of coherence in the near infrared, where a reflection band is displayed with a less defined structure. Low reflection values (attributed to the epicuticle coating layer) are seen at short wavelengths, as indicated in the figures, with very abrupt reflection edges in the visible and more gradually decaying values towards the near infrared. As shown elsewhere, the light reflected by the C. aurigans’ cuticle is predominantly left-handed circularly polarized [7] , in the spectral range where the reflection bands are displayed. At short wavelengths, at the left sides of the bands, the reflected light is predominantly non-polarized.
3. Theoretical Formalism
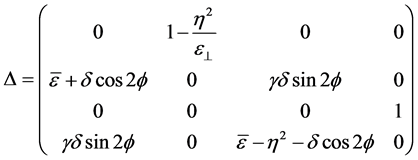
There are several formalisms to describe the propagation of light through chiral media [20] [21] . The propagation of electromagnetic waves through anisotropic plywood structures can also be described by the formalism developed by Berreman [22] . It consists of solving the eigenvalues’ equation
 (1)
(1)
where k = 2π/λ is the light wave number in vacuum, λ is the wavelength in vacuum, and  is a column vector whose four components correspond to the electric and magnetic intensity fields contained in the XY plane where the dielectric properties of the medium are uniform, and Δ as the Berreman’s propagation matrix [23] . Berreman initially writes the differential formulation of Maxwell equations (Faraday and Ampere laws) in a 6 × 6 matrix formalism which is then reduced to a 4 × 4 matrix approach by writing the z-components of the electromagnetic fields in terms of the tangential components involved in the definition of the four-vector
 . Thus, a 4 × 4 formalism is devised and the explicit form of the Berreman matrix is obtained in terms of the components of the tensor dielectric function (
 with
with  and
and ) [23] , and also in terms of the Euler angles θ and f which specify the direction of the unit director vector
 . For non-homogenous cholesteric-like stratified media, with θ = π/2,
  is in the plane XY and its azimuth orientation matches the average orientation of the chitin nano-fibrils at each depth z. Berreman’s matrix is given by [24]
 (2)
(2)
with , nw is the refractive index of the medium above the stratified media (in this case the waxy epicuticle coating),
  is the angle of incidence,
  for left- (right-) handed twisted structures. The azimuth angle is given by
  for twisted structures with a constant pitch, and
  for arrangements with a graded spatial period. Besides, the non-null elements of the tensor dielectric function are:
 ,
,  ,
,  , and
, and  with
with  and
and . The dielectric functions along and perpendicular to the unit director vector are calculated from the extraordinary (
 ) and ordinary (
 ) refractive indices respectively:
  and
and . The average refractive index of the medium is given by
  and the birefringence is
 . From these two previous equations one has that
  and
and . We are using the wavelength dependent average refractive index
  of chitin published elsewhere (see Figure 3(a) and [25] ), neglecting


Figure 3. Spectral dependence of the average refractive indices and extinction coefficients of chitin (dashed line) and uric acid (solid line) according to references [25] and [29] . The ultraviolet (UV) and near infrared (NI) spectral regions are labeled, and the color bar indicates the visible (V) spectral range.
absorption because of the small values of the extinction coefficient of chitin for visible wavelengths, which are of the order of 10−4 (see Figure 3(b)). Chitin’s birefringence for visible wavelengths has been reported close to  [26] . Uric acid has been found in some scarabs’ cuticles [27] . The presence of this substance, whose birefringence has been reported between 0.22 and 0.31 [28] , increases the effective birefringence of the medium. In these cases we evaluate the average refractive index
  and the effective birefringence
  by averaging the refractive indices of chitin and uric acid according to the volume fraction occupied by each material. From the spectral dependence of the average refractive index through the visible wavelength range, we evaluate its average value in the visible range:
 .
.
This means that the volume fraction of uric acid is used as a fitting parameter, by assuming it as a uniform distribution. The refractive index and extinction coefficient of uric acid have also been published elsewhere (see Figure 3 and [29] ). Figure 3 displays the spectral dependence of the refractive indices of chitin and uric acid that are used throughout our evaluations. Both materials show little dispersion through visible and near infrared spectral ranges. The solution of differential Equation (1) has the form  with
with  as a column constant four-vector. The evaluation of
  is greatly simplified from the four eigenvalues of the
  -matrix, whose explicit expressions have been given by Wöhler et al. [24] . Then, based on the continuity of the tangential components of the electromagnetic fields, the complete structure can be divided in very fine slices of thickness h, with h much smaller than the thickness of the complete plywood structure. The h-value is set small enough to ensure numerical convergence. In this way, a radiative transfer matrix formalism has been devised in order to evaluate, from the complex amplitudes for co-polarized (rLL and rRR) and cross-polarized (rRL and rLR) reflection of circularly polarized light [11] , the light reflection by these types of twisted arrangements:
  for incident non-polarized light, with
 ,
,  ,
,  , and
, and . A similar 6 × 6 matrix approach was developed to describe the propagation of harmonic mechanical waves through chiral layered structures [30] . This formalism has been applied to study the mechanical properties of millimeter-sized chiral structures found in the dactyl club of mantis shrimps [31] [32] .
4. Modeling of Reflection Spectra
In this section the reflectance spectra of the four scarab beetles being considered are modelled from the formalism of Berreman briefly described in the previous section. The optical constants of chitin and uric acid enter in this approach, as well as the spatial period characterizing the left-handed chiral structures. First, the method to obtain the pitch of each structure in terms of the depth through the cuticle is reviewed and improved to take into account that the SEM images used could correspond to inclined cuts. The angles of inclinations are obtained from optimization of the spectral position of the reflection edges or plateaus. Then, the optimized pitches are again introduced in the Berreman’s formalism to evaluate reflection spectra under normal illumination with non-polarized light. A novel characterization of the photonic band gap of the C. aurigans scarabs is carried out to show how an effective broad band in reflection emerges from an intrinsic narrow band width that shows a dependence of its spectral position on the depth through the endocuticle. The contribution of defects to the reflection spectra is also considered as well as the presence of the epicuticle which shows to be an anti-reflecting coating as well as a weakly scattering layer covering the twisted structures.
4.1. Spatial Periods or Pitches
As seen from the previous section, the key aspects to apply Berreman’s framework are the knowledge of the optical constants and birefringence of the materials, as well as the pitches of the structures which in this case are dependent on the depth z through the cuticles. In the second paragraph of the Introducción we briefly mentioned how the pitch is obtained from SEM images, with additional details published elsewhere [12] [13] . We report here a revised version of the method previously followed. SEM images of the cuticle of golden-like and red C. aurigans specimens as well as golden- and silver-like C. chrysargyrea scarabs have been taken, as shown in Figure 4. We assume that each SEM image corresponds to a cut carried out nearly perpendicular to the layered structure. We specify the deviation of the cut from the normal to the surface by means of a small angle β (see Figure 5) which is used as a fitting parameter as explained later. If β has large values, successive rows of arc-paterns will be displayed instead of a layered structure, and β would be the complementary angle to α, the incision angle as defined by Aguilar and Rey [14] [15] . Each SEM image was used, by means of the PhotoShop® tools, to put a fine line in the middle of each dark layer (see Figure 2 in [12] ). These marks are used to measure the depth z for each dark layer, from the number of vertical pixels counted from the bottom of the epicuticle to the position of the dark layer. The thicknesses of the dark layers are around 20 nm. As an example, a scale of 202 pixels/μm was used through the analysis of the images for the C. chrysargyrea scarabs. The locations of the fine lines centered at positions of the dark layers have uncertainties corresponding to 1 pixel or equivalently . This is the uncertainty in the measurements of the pitch for the C. chrysargyrea scarabs and for the red C. aurigans beetle. For the golden-like C. aurigans we estimate an uncertainty of 7 nm. From one line in the middle of a dark layer to the next one, the angle f changes in π radians. The pitch is given by
  and then the uncertainty in the pitch determination is
 . This gives values close to 10 nm at small z-values and uncertainties close to 1 nm when the z-coordinate approaches the thickness of the structure. In this way the apparent values of the pitch [P(β, z)] and their uncertainties were obtained from the SEM images. Their dependences with the depth through the cuticle are shown in Figure 6. The spectral position of the reflection edge or the plateau is sensitive to the smaller values of the pitch. This fact is used to optimize the β-value, with the real pitch given by
 . Through small depths, the pitches of both aurigans varieties are similar, with maximum values at ~1 μm depth. Beyond the 3 μm depth the pitch of the red aurigans is larger than that of the golden-like scarab, with a difference close to 50 nm between minimum values at depths close to 9 μm. Due to the normal dispersion in the chitin and uric acid refractive indices for visible wavelengths, the minimum values approximately define the spectral location of the reflection edge. Close to the reflection edge, where the reflection band starts its deployment, the Bragg condition under normal incidence establishes that
  (with
(with  as the average refractive index in the spectral neighborhood of λ).

Figure 4. SEM images showing cuts through the cuticles of golden-like and red C. aurigans ((a) & (b)), and golden- and silver-like C.chrysargyrea ((c)&(d)) scarab beetles. The horizontal side width of each figure is close to 5.0 μm.


Figure 5. Schematic representation of vertical (abcd) and inclined (abef) planes. From the vertical planes, an anticlockwise or a clockwise angle β is defined (left and right figures, respectively). For both cases one obtains L = h/cosβ from the right triangles bce, and the equivalent relation at a local level is P(z) = P(β, z)/cosβ with P(β, z) as the apparent pitch obtained from the SEM image and P(z) as the real pitch.


Figure 6. Depth z-dependence through the procuticle of the apparent spatial period or pitch for specimens of (a) C. aurigans and (b) C. chrysargyrea scarabs as obtained from SEM images.
This, along with a greater birefringence, would explains why the reflection edge is found at around 625 nm for the red scarab and at about 525 nm for the golden-like beetle. Some authors have speculated about the red coloration of the C. aurigans in terms of an irregular distribution of uric acid in the exocuticle [33] . Our analysis shows that this hypothesis could be only part of the explanation, and that the main reason of the red variant of C. aurigans is the larger minimum values of the pitch as compared with those of golden-like specimens. The depth dependence of micrometer-sized pitches of milimiter-sized chiral structures found in the dactyl club of mantis shrimps has been measured [31] .
4.2. Reflection Spectra of Perfect Left-Handed Twisted Structures
The computed reflections spectra that correspond to the measured ones depicted in Figure 2 are displayed in Figure 7, with the parameters corresponding to each figure reported in Table 1. The parameter f specifies the


Figure 7. Calculated coherent reflection spectra (Rc) showing the maximum contribution of left-handed circularly polarized reflected light by: (a) golden-like and (b) red C. aurigans, (c) golden-like and (d) silver-like C. chrysargyrea scarabs. In figure (d) the solid line corresponds to δn = 1.0 × 10⁻² as well as the dashed line at short wavelengths. For the spectrum drawn by dots, δn = 5.0 × 10⁻². The ultraviolet (UV) and near infrared (NI) spectral regions are labeled, and the color bar indicates the visible (V) spectral range.

Table 1. Parameters used to calculate the reflection spectra depicted in Figure 7 by solid lines: volume fraction of uric acid (f), visible average refractive index (nv), birefringence (Δn), maximum value of the refractive index fluctuations (δn), optimized value of the angle β(in degrees) that corresponds to the plane displayed in the SEM image, thickness of the structure (hs), and number of spatial periods (N).
volume fraction of uric acid. For low values of f, the shoulders or plateaus tend to be reflection peaks with values significantly larger than those displayed in the rest of the band by the ripple structure. Their widths  depend on the effective birefringence and on the minimum values of the pitches. This fact has been used to optimize the f-value. For each trial value of f, the effective refractive index of the structure is given by
  for each wavelength λ considered, with
  and
and  as the refractive indices of chitin and uric acid respectively (see Figure 3(a)). The effective birefringence is
  with
with , and
, and  as indicated before. The average refractive index in the visible range (
 ) is reported in Table 1. Small fluctuations in the ordinary and extraordinary average refractive indices (
 and
and ) are considered:
  and
and  where re and ro are random numbers uniformly distributed in the range [1 − δn, 1 + δn]. The number of pitches in the structure (N) is characteristic of the corresponding z-dependence of the spatial period and the thickness hs of the structure. The angles β have been optimized in order to have coincidence between the spectral positions of the plateaus in the reflection spectra, the measured and the calculated ones.
The spectra displayed in Figure 7 do not include the reflection contribution due to the epicuticle, the Ro indicated in Figure 2. These spectra correspond to perfect left-handed chiral structures. As seen, the plateaus approach a reflection value of 50% while they are close to 30% in the measured spectra (see Figure 2). Apart from this fact, the general spectral features observed in the measured spectra are reproduced in the model, including the ripple structures displayed in the spectra of the C. aurigans and golden-like C. chrysargyrea. These fine spectral structures have been qualitatively attributed to the presence of graded pitches through the cuticles by McDonald et al. when they considered the reflection of light by the cuticle of Chrysina optima scarabs [18] , a fact previously established from a quantitative approach by Libby et al. [12] . As mentioned before, fine structures are displayed in the ellipticity and degree of polarization spectra of Cetonia aurata beetles [19] . In this case, the authors attribute the fine structure to “interference oscillations due to the overall thickness of the cuticle”, and they characterize the chiral structures with a main single pitch value when analyzing their ellipsometric data.
As also shown elsewhere [12] [13] , the presence of defects through the chiral structures contributes with left-handed non-coherent light to the reflected spectra. The measured left-handed circularly polarized reflection spectra have a contribution of predominantly coherent light with a small fraction of non-coherent radiation. Besides, for both C. aurigans and the golden-like C. chrysargyrea, the presence of the largest pitches at the first spatial periods means that the infrared reflection is mainly determined by the first twisted layers of the structure. The reflection in the visible spectrum is mostly determined by the medium sized pitches located toward the center of the structure. The calculated reflection spectrum of the silver-like C. chrysargyrea scarab shows a reflection peak at short wavelength, in the near ultraviolet (UV), which is not observed in the measured spectrum (see the dashed line in Figure 7(d) for wavelengths lower than 370 nm). The presence of a light scattering and absorbing waxy epicuticle covering the chiral structure, and the absorption of light by the uric acid in the near ultraviolet, can explain the absence of this reflection peak at short wavelengths. Both chitin and uric acid display very little absorption through visible and near infrared wavelengths. Figure 7(d) displays two calculated reflection spectra: the solid line for a left-handed chiral structure with small fluctuations in the refractive index ( ), and the other spectrum (depicted by dots) calculated by assuming larger fluctuations (
 ). Low (large) fluctuations allow us to obtain a calculated reflection spectrum very similar to the measured one in the visible (near infrared). Due to the monotonically increasing pitch of the structure with the depth z through the procuticle, the reflection beyond the plateau is due to multiple reflections from the deepest spatial periods. Following a calculation method similar to that previously reported to analyze the spectral variation with the depth z in the reflection spectra of the C. aurigans [13] , we have observed that for the silver-like C. chrysargyrea the reflection in the near infrared is determined by the deepest pitches located beyond
 . We conclude that through the last 3.3 μm of the structure the volume fraction of uric acid is larger than a value close to 0.59 which characterizes the rest of the structure, with larger fluctuations in the average refractive index. This leads to a reflection band in the near infrared with a less defined spectral composition, which is associated to loss of coherence.
4.3. Broadening of the Photonic Band Gap
In this Section we consider the left-handed helicoidal structures of the C. aurigans scarabs as one-dimensional photonic crystals. A similar analysis for the other two scarabs being considered will be published in the near future. The dispersion relation for circularly polarized electromagnetic waves of angular frequency ω and wave number k propagating through a chiral structure characterized by a single pitch value Po is given by [5]
 , (3)
, (3)
with  and where
 ,
,  ,
,  ,
,  for left- (right-) handed circularly polarized propagating radiation, and c is the speed of light in vacuum. Figure 8(a) shows the two branches [
 and
and ] associated with the two roots of ω2 depending of the sign “+” or “−” taken in the previous equation. The wavelength range of the photonic band gap is obtained from the limits:
  and
and  which lead to
  and
and , respectively.
The middle of the band gap corresponds to the wavelength  and its width is given by
 . The dispersion relation [Equation (3)] comes from the Hemholtz’s wave equation satisfied by the two orthogonal left- and right-handed circularly polarized components of the electric field [34] :
 , (4)
, (4)
with ,
,  as the complex amplitudes of the electric field components, and
  as a 2 × 2 tensor dielectric function whose components are the matrix elements εxx, εxy, εyx, and εyy previously mentioned in Section 3.
When the chiral structure is characterized by a graded pitch [P=P(z)], within a zero order approach of the photonic band width, we suppose that qo must be replaced by  in Equation (3) and the effective wavelength range of the band gap will be displayed between
  and
and  with Pmin and Pmax as the minimum and maximum values of the spatial period respectively. The width of the band gap, given in terms of the corresponding wavelength range, is
 . This relation can be written in the form
 , (5)
, (5)
with  and
and . This Equation (5) is an extended version of the previous formula for Δλ when the chiral structure has a single valued pitch. The second term in the right side quantifies the broadening of the band gap due to the presence of a graded pitch. Equation (5) is valid for the so-called chirped structures with smooth linear variations of the pitches with the depth z. Table 2 shows the values of the parameters used to evaluate the wavelength ranges of the band widths that correspond to the reflection spectra displayed in Figure 2. The real minimum and maximum values of the pitches [Pmin and Pmax respectively] are obtained from the apparent minimum and maximum values [Pmin(β) and Pmax(β) respectively] displayed in Figure 6, and the optimized β-angles reported in Table 1. When comparing the Δλ-widths reported in the penultimate column


Figure 8. Diagrams of the dispersion relation of circularly polarized electromagnetic waves propagating through a chiral medium. The diagrams are shown in terms of the relative frequency (a) or wavelength (b). The values of the parameters used to evaluate Equation (3) were set to: Po = 443 nm, ε? = 2.93, and ε┴ = 2.36 which correspond to the golden-like C. aurigans according to data reported in Table 1, for a wavelength of 700 nm. The value of Po corresponds to the average value of the pitch for this golden scarab.
of Table 2 with the band widths of the reflection spectra depicted in Figure 2, we observe that Δλ corresponds approximately to the width of the wavelength range through which the ripple structure is displayed, i.e. . The values of λmin confirm this fact. This is at least true for the C. aurigans beetles and for the golden-like C. chrysargyrea scarab. The spectral widths of the shoulders or plateaus are approximately given by the relation
 .These calculated spectral widths (
 and
and ) reported in Table 2 can be compared with corresponding ones estimated from the reflection spectra depicted in Figure 2, and
  can be compared with Δλexp. The agreement is quite good, with relative differences lower than 5%. The exception is the silver-like C. chrysargyrea whose reflection spectrum shows a broad reflection band in the near infrared with few spectral structures. Regarding the golden-like C. aurigans, the presence of a depth dependent spatial period leads to a broadening of the photonic band gap, which goes from 580 to about 900 nm (see both horizontal lines displayed in Figure 9), but within our zero order approach this is not sufficient to explain the broader width of the reflection band only in terms of
 .
.
Our next approach to display a larger broadening of the photonic band gap, by taking into account the graded pitch, is based on substituting q(z) by Q(z) in Equation (3), with
 . (6)
. (6)
This relation is obtained when deriving twice the  components involved in Equation (4) and writing the new dispersion relation (when
 ) in the form
Table 2. Apparent and real values of the minimum and maximum pitches of the four chiral structures being considered, and corresponding averages and differences, as well as birefringence and average refractive index used to calculate the band widths according to Equation (5). The values of all parameters are given in nm, except those of the dimensionless Δn and nv.


Figure 9. Variation of the photonic band gap Δλ with the depth z through the cuticle for golden-like (a) and red (b) C. aurigans beetles whose depth dependent pitches are shown in Figure 6(a). In terms of wavelength, both solutions of Equation (7), the bands λ+(z) and λ-(z) are also displayed. Δλb and Δλa are the wavelength band gaps at those depths where the spatial period displays its maximum and minimum values respectively. The dielectric function values for the golden-like (red) are: ε? = 2.96 and ε┴ = 2.39 (ε? = 2.98 and ε┴ = 2.36).
 , (7)
, (7)
with
 . (8)
. (8)
In this way the photonic band gap depends on the local value of the spatial period, and on its first and second derivatives whose evaluations have been carried out by means of finite differences with a step  and
and . From the
  values obtained from Equation (7), the corresponding
  values are calculated as a function of the depth z through the cuticle of the scarab, with an uncertainty close to 8 nm due to the uncertainty in the pitch measurements.
Figure 9(a) & Figure 9(b) show how the wavelength band gap changes with the depth through the cuticle, with P(z) corresponding to the real pitch of the golden-like (red) C. aurigans scarab. Although the wavelength range of the band gap [ ] at each specific depth z is small, with an average value close to 75 nm (89 nm),its spectral position depends on z having a larger effective broadening which covers a large spectral range from 530 to 1150 nm (620 to 1100 nm). The uncertainty in the wavelength band gap values is close to 1 nm, due to the uncertainty in the measurements of the pitch. The evaluations were carried out using the average values of
  and
and  in the visible wavelength range. The spatial periods contained through the first 1.8 μm (1.7 μm) in depth contribute with reflection in the near infrared. The visual appearance of the cuticle is determined by pitches located from 1.8 to 11.2 μm (1.7 to 8.5 μm). The spatial periods at the bottom of the structure, from 11.2 to 16.0 μm (8.5 to 14 μm), additionally contribute to the near infrared reflection. The agreement between these behaviors of Δλ as a function of z and the spectral ranges of the measured broad reflection bands (see Figure 2(a) and Figure 2(b)) is remarkable. There is also a noticeable correlation between the z-dependence of Δλ and the evaluation of the reflection in terms of z [R(z)] recently reported by Azofeifa et al. [13] for the golden-like C. aurigans. Other noteworthy feature is this: the Δλb and Δλa shown in Figure 9(a) are the wavelength band gaps at those depths where the spatial period displays its maximum and minimum values respectively. If one defines the ratio between these two band gaps as
 , then
 . On the other hand, the ratio between maximum and minimum values of the pitch (
 ) is
) is . The results corresponding of the red C. aurigans are
  and
and . These apparent coincidences are really manifestations of the scaling invariance of Maxwell’s equations, as discussed by Joannopoulos et al. [35] . This effect, a photonic band gap whose spectral position depends on the depth through the structure, was observed from radiative transfer matrix computations by Fan et al. when considering multilayers of silver nano-particles embedded in a TiO2 matrix [36] . In this case, the graded property of the system is the effective refractive index of the composite layers, described by an effective medium approach, which is tailored by changing the volume fraction of the metal particles.
5. Contributions of Non-Perfect Left-Handed Twisted Structures
The presence of defects through the twisted structures corresponding to C. aurigans (both red and golden-like) and golden-like C. chrysargyrea contributes to the spectra by adding a small amount of non-coherent left-handed reflected light, with a broad band centered at 800 nm in the near infrared. In the case of the silver-like C. chrysargyrea, a broad reflection band in the near ultraviolet is displayed, with its tail in the visible. The presence of a light scattering and absorbing epicuticle above the twisted structure would probably contribute to suppress this reflection at UV and short visible wavelengths. Defects in these cases mean deviations from the perfect rotation of the azimuth angle through depth z. Our simulations of the defects’ contributions are based on carrying out, at each specific depth considered, small variations of the azimuth angle: , where r is a random number uniformly distributed in the range [1 − μ, 1 + μ]. We have taken values of μ between μmin = 0.01 and μmax = 0.20, with a step Δμ = 0.01. Then, we assume a normal distribution f(μ) of the azimuth angle deviations with average value μo and standard deviation σ [
 ]. From the calculated Nμ = 20 reflection spectra, each one for a specific value of μ in the mentioned range, we evaluate the average reflection spectra that allow us to incorporate the effect of randomly distribuited defects on the resultant reflection spectra:
 , (9)
, (9)
with . Figure 10 shows the results obtained when μo = 0.12 and σ = 0.06 together with the other parameters reported in Table 1. Figure 11 displays the superposition of both contributions to obtain the resultant calculated reflection spectra:
 . The F-values are evaluated from the ratio between the average measured reflectance values through the shoulders or plateaus (Figure 2) and those displayed in the calculated reflection spectra that corresponds to the perfect chiral structures (Figure 7).
The non-coherent contributions introduce weak modulations of the largest contributions due to the perfect left handed-chital structures. As seen, the general spectral features displayed in the measured reflection spectra are reproduced in the model. The values of the different parameters required by the model (volume fraction of the uric acid f, birenfringence Δn, largest value of the refractive index fluctuations δn, and angle of inclination β) correspond to a good level of optimization carried out from extensive numerical calculations.
We suppose that these values are very close to the true ones, and they have been used to show how the main spectral features of the measured reflection spectra can be approached by following the method reported in this work. In fact, a better morphological characterization would be required to incorporate in a more rigorous way the contribution of defects to the resultant light reflection spectra.
6. The Epicuticle: An Anti-Reflecting and Weak Light Scattering Coating
Research works that report the optical properties of epicuticles are scarse [37] . In a previous publication we have taken into account the contribution by the epicuticle in terms of a single reflection at the front illuminated interface:  with nw as the refractive index of the waxy epicuticle as mentioned above [13] . This assumption neglects the effect of the second interface between the epicuticle and the chiral structure, and the consequent multiple reflections. We now extend our interpretation of the role that the epicuticle has in terms of its contribution at short wavelengths to the reflection spectra. The low measured values of Ro reported in

Figure 10. Non-coherent reflection spectra (Rnc) of the twisted structures corresponding to cuticles of the four scarab beetles considered throughout this study, by incorporating deviation in the azimuth angle that specify the orientation of the nano-fibrils of protein-chitin. The average deviation and standard deviation were set to μo = 0.12 and σ = 0.06. The ultraviolet (UV) and near infrared (NI) spectral regions are labeled, and the color bar indicates the visible (V) spectral range.


Figure 11. Calculated total reflection spectra [ ] with contributions from a perfect left-handed twisted structure and a similar structure with defects through the cuticle of: (a) golden-like C. aurigans, (b) red C. aurigans, (c) golden-like C. chrysargyrea, and (d) silver-like C. chrysargyrea. The corresponding values of the weighting factor F are: 0.53, 0.65, 0.65, and 0.70 respectively. The ultraviolet (UV) and near infrared (NI) spectral regions are labeled, and the color bar indicates the visible (V) spectral range.
Figure 2 suggest that the epicuticle acts as an anti-reflecting layer that coats the chiral structure. Under this assumption, the refractive index of the epicuticle is  [38] , where
  is the average refractive index of the twisted arrangement and the collimated reflection by the epicuticle is [39] [40] .
 , (10)
with  as the reflection coefficient in the illuminated air-epicuticle interface. The reflection coefficient in the interface between the epicuticle and the chiral structure is
 , he is the thickness of the epicuticle, and κ is its extinction coefficient per unit length, i.e. the sum of scattering plus absorption. Rcc is denoted as the collimated-collimated reflectance component in the context of four-flux radiative transfer models [40] [41] . From the previous equation, with the wavelength dependent values of
  used in the context of Berreman’s formalism and the experimental values of Ro = Rcc at short wavelengths reported in Figure 2, we have used an inversion procedure to obtain the extinction coefficient for the golden-like C. aurigans whose epicuticle has a thickness he = 0.8 μm.
Figure 11(a) shows the spectral dependence of the extinction coefficient at UV and short visible wavelengths. The low values displayed through the extinction band characterize the epicuticle as a weakly scattering medium. The weak scattering of light is probably related to the presence of nano-sized pores and channels used to transport wax towards the top of epicuticle [42] . When modeling ellipsometric measurements, Arwin et al. have attributed this extinction to scattering, modeling the scattering coefficient through an equivalent absorption coefficient described by an Urbach tail towards visible wavelengths [13] . They set the edge of the extinction band in λo = 400 nm with no justification. Our results suggest that the edge of the extinction band is in the ultraviolet, perhaps close to 200 nm. With this correction in the parameter λo, values of the equivalent absorption coefficient become similar to values depicted in Figure 12(a) when approaching the middle of the visible range. The noise in the measurements, at short wavelengths where the reflection values are small, introduces a large relative uncertainty in these evaluations. We estimate uncertainties no larger than 15 percent. In fact, the noise for wavelengths lower than 360 nm does not enable us to evaluate the extinction coefficient at shorter wavelengths. On the other hand, beyond 505 nm the effect of the chiral structure dominates over the epicuticle’s contribution. Once the extinction coefficient has been obtained, and by assuming that extinction is due entirely to scattering, the collimated-collimated component of the transmission (Tcc) can be evaluated from
 . (11)
For a weakly scattering medium, it is reasonable to assume that the average path-length parameters characterizing both the forward and backward propagating diffuse radiation are close to unity [43] . These parameters account for the average distances travelled by the forward and backward diffuse radiation as compared to the collimated beams, and for highly scattering materials they depend on the polar angle dependent diffuse intensities. By also assuming that the forward scattering ratio for diffuse radiation is equal to the forward scattering ratio for collimated beams [44] , the collimated-diffuse component of the reflection can be calculated from
 , (12)


Figure 12. (a) Spectral dependence at short wavelengths of the extinction coefficient of the epicuticle (0.8 μm thick) of a golden-like C. aurigans scarab beetle. The solid line corresponds to the smoothed curve obtained from the data (dots). (b) Collimated and diffuse components of the light reflected by and transmitted through the epicuticle of a C. aurigans scarab (Rcc and Tcc, Rcd and Tcd respectively).
where rd [Rd] is the internal reflection coefficient for diffuse radiation in the epicuticle-air [epicuticle-chiral structure] interface [45] . The collimated-diffuse transmission is then obtained from: . Figure 12(b) shows the results. The collimated and diffuse components of reflection are very small: Rcc = Ro is about 3% and Rcd is close to 1%. The diffuse component of the transmission (Tcd) reaches largest values close to 30% for wavelengths close to 430 nm, with decreasing values towards the near ultraviolet and the middle of the visible. The collimated component of the transmission (Tcc) displays its lower values close to 67% near 430 nm. In this spectral region the amount of light reaching the chiral structure decreases up to 33%. Most of the incidentlight is transmitted through the epicuticle as collimated radiation, for wavelengths approaching the near ultraviolet and beyond the middle of the visible wavelength range. Once traveling through the chiral structure, this collimated component is attenuated due to the absorption by the uric acid, whose absorption coefficient has its largest values in the near ultraviolet (see Figure 3(b)).
The superposition of these two effects (weak scattering by the epicuticle at short visible wavelengths and weak absorption in the near ultraviolet by the uric acid in the chiral structure) can explain the absence of structure in the reflection spectra through the mentioned wavelengths ranges, even for the silver-like C. chrysargyrea scarab whose measured reflection spectrum displays a first peak at 430 nm. The weak scattering by the epicuticle has not been sufficient to suppress this peak, but the absorption by the uric acid at lower wavelengths has removed the presence of a peak in the near ultraviolet, close to 320 nm.
7. Summary and Conclusions
Measured reflection spectra obtained from the cuticle of four different specimens of Chrysina scarab beetles by illuminating with non-polarized light are reported for a spectral range that covers near ultraviolet, visible and near infrared wavelengths. The structural colors of these scarabs are determined by spectrally structured reflection bands that cover portions of the visible range, or even the whole visible ambit. The bands themselves, and their spectral features, have been satisfactory modeled by application of Berreman’s formalism. The key aspect has been the previous determination, from SEM images, of the spatial period characterizing the corresponding chiral structures. The dependence of these pitches with the depth through the twisted structure enters in Berreman’s approach, together with the spectral dependence of the refractive indices of chitin and uric acid. To our knowledge, for the first time, biological twisted structures with depth dependent spatial periods are systematically considered, and their optical properties satisfactorily modeled from a radiative transfer matrix formalism in which the graded pitch depth dependences and anisotropic optical constants of the involved materials enter. Defects randomly distributed through the chiral structures decrease the heights of the reflection bands and add small contributions of non-coherent reflected radiation. For wavelengths in the near-ultraviolet and short visible wavelengths, a novel optical characterization of the epicuticle has been devised. From the optics point of view, these waxy layers that cover the chiral structures can be considered as anti-reflecting coatings, which also show a weak scattering of the propagating light. Collimated and diffuse components of reflection and transmission have been evaluated. Both reflection components are very small but significant amounts of collimated and diffuse transmitted light are specially displayed at short visible wavelengths. The method followed to consider the photonic band gaps of twisted structures characterized by single valued pitches has been extended to incorporate the dependence of the spatial periods with the depth through the cuticle. In this way, the optical mechanism that leads to reflection spectra with very broad bands is demonstrated.
Acknowledgements
The authors thank the support given by the Universidad de Costa Rica to carry out this study. They are also indebted to the Instituto Nacional de Biodiversidad (InBio) for providing the scarab’s specimens used throughout this research work.
Cite this paper
W. E. Vargas,M. Hernández-Jiménez,E. Libby,D. E. Azofeifa,C. Barboza,Á. Solis, (2016) Light Reflection by Cuticles of Chrysina Jewel Scarabs: Optical Measurements, Morphology Characterization, and Theoretical Modeling. Optics and Photonics Journal,06,146-163. doi: 10.4236/opj.2016.67017
References
- 1. Gralak, B., Tayeb, G. and Enoch S. (2001) Morpho Butterflies Wings Color Modeled with Lamellar Grating Theory. Optics Express, 9, 567-578.
http://dx.doi.org/10.1364/OE.9.000567 - 2. Welch, V.L. and Vigneron J.P. (2007) Beyond Butterflies—The Diversity of Biological Photonic Crystals. Optical and Quantum Electronics, 39, 295-303.
http://dx.doi.org/10.1007/s11082-007-9094-4 - 3. Sharma V., Crne, M., Park, J.O. and Srinivasarao M. (2014) Bouligand Structures Underlie Circularly Polarized Iridescence of Scarab Beetles: A Closer View. Materials Today: Proceedings, 1S, 161-171.
http://dx.doi.org/10.1016/j.matpr.2014.09.019 - 4. Michelson, A.A. (1911) On Metallic Colouring in Beetles and Insects. Philosophical Magazine Series 6, 21, 554-567.
http://dx.doi.org/10.1080/14786440408637061 - 5. Kinoshita, S. (2008) Structural Colors in the Realm of Nature. World Scientific, New Jersey.
- 6. Mitov, M. (2012) Cholesteric Liquid Crystals with a Broad Light Reflection Band. Advanced Materials, 24, 6260-6276.
http://dx.doi.org/10.1002/adma.201202913 - 7. Hernández-Jiménez, M., Azofeifa, D.E., Libby, E., Barboza-Aguilar, C., Solís, A., Arce-Marenco, L., García-Aguilar, I., Hernández, A. and Vargas, W.E. (2014) Qualitative Correlation between Structural Chirality through the Cuticle of Chrysina aurigans Scarabs and Left-Handed Circular Polarization of the Reflected Light. Optical Materials Express, 4, 2632-2645.
http://dx.doi.org/10.1364/OME.4.002632 - 8. Fernández del Río, L., Arwin, H. and Järrendahl, K. (2014) Polarizing Properties and Structural Characteristics of the Cuticle of the Scarab Beetle Chrysina gloriosa. Thin Solid Films, 571, 410-415.
http://dx.doi.org/10.1016/j.tsf.2013.11.149 - 9. Jewell, S.A., Vukusic, P. and Roberts, N.W. (2007) Circularly Polarized Colour Reflection from Helicoidal Structures in the Beetle Plusiotis boucardi. New Journal of Physics, 9, 99.
http://dx.doi.org/10.1088/1367-2630/9/4/099 - 10. Ching, S.Y., Li, G., Tam, H.L., Goh, D.T.P., Goh, J.K.L. and Cheah, K.W. (2014) Chirality in Rhomborhina gigantea Beetle. Optical Materials Express, 4, 2340-2345.
http://dx.doi.org/10.1364/OME.4.002340 - 11. Brink, D.J., van der Berg, N.G., Prinsloo, L.C. and Hodgkinson, I.J. (2007) Unusual Coloration in Scarabaeid Beetles. Journal of Physics D: Applied Physics, 40, 2189.
http://dx.doi.org/10.1088/0022-3727/40/7/050 - 12. Libby, E., Azofeifa, D.E., Hernández-Jiménez, M., Barboza-Aguilar, C., Solís, A., García-Aguilar, I., Arce-Marenco, L., Hernández, A. and Vargas, W.E. (2014) Light Reflection by the Cuticle of C. aurigans Scarabs: A Biological Broadband Reflector of Left Handed Circularly Polarized Light. Journal of Optics, 16, Article ID: 082001.
http://dx.doi.org/10.1088/2040-8978/16/8/082001 - 13. Azofeifa, D.E., Hernández-Jiménez, M., Libby, E., Solís, A., Barboza-Aguilar, C. and Vargas, W.E. (2015) A Quantitative Assessment Approach of Feasible Optical Mechanisms Contributing to Structural Color of Golden-Like Chrysina aurigans Scarab Beetles. Journal of Quantitative Spectroscopy and Radiative Transfer, 160, 63-74.
http://dx.doi.org/10.1016/j.jqsrt.2015.03.014 - 14. Aguilar-Gutierrez, O.F. and Rey, A.D. (2014) Structure Characterisation Method for Ideal and Non-Ideal Twisted Plywoods. Soft Matter, 10, 9446-9453.
http://dx.doi.org/10.1039/C4SM01803F - 15. Aguilar-Gutierrez, O.F. and Rey, A.D. (2014) Chiral Graded Structures in Biological Plywoods and in the Beetle Cuticle. Colloids and Interface Science Communications, 3, 18-22.
http://dx.doi.org/10.1016/j.colcom.2015.04.001 - 16. Campos-Fernández, C., Azofeifa, D.E., Hernández-Jiménez, M., Ruiz-Ruiz, A. and Vargas, W.E. (2011) Visible Light Reflection Spectra from Cuticle Layered Materials. Optical Materials Express, 1, 85-100.
http://dx.doi.org/10.1364/OME.1.000085 - 17. Saba, M., Wilts, B.D., Hielscher, J. and Schroder-Turk, G.E. (2014) Absence of Circular Polarization in Reflections of Butterfly Wing Scales with Chiral Gyroid Structure. Materials Today: Proceedings, 1, 193-208.
http://dx.doi.org/10.1016/j.matpr.2014.09.023 - 18. McDonald, L.T., Finlayson, E.D. and Vukusic, P. (2015) Untwisting the Polarization Properties of Light Reflected by Scarab Beetles. Bioinspired, Biointegrated, Bioengineered Photonic Devices III (Proceeding of SPIE), San Francisco, 7-8 February 2015, Vol. 9341.
- 19. Arwin, H., Fernández del Río, L. and Järrendahl, K. (2014) Comparison and Analysis of Mueller-Matrix Spectra from Exoskeletons of Blue, Green and Red Cetonia aurata. Thin Solid Films, 571, 739-743.
http://dx.doi.org/10.1016/j.tsf.2014.02.012 - 20. McCall, M.W. (2009) Simplified Theory of Axial Propagation through Structurally Chiral Media. Journal of Optics A: Pure and Applied Optics, 11, Article ID: 074006.
http://dx.doi.org/10.1088/1464-4258/11/7/074006 - 21. Topf, R.D.M. and McCall, M.W. (2014) Modes of Structurally Chiral Lasers. Physical Review A, 90, Article ID: 053824.
http://dx.doi.org/10.1103/PhysRevA.90.053824 - 22. Berreman, D.W. (1972) Optics in Stratified and Anisotropic Media: 4 × 4 Matrix Formalism. Journal of the Optical Society of America, 62, 502-510.
http://dx.doi.org/10.1364/JOSA.62.000502 - 23. Stallinga, S. (1999) Berreman 4 × 4 Matrix Method for Reflective Liquid Crystal Displays. Journal of Applied Physics, 85, 3023-3031.
http://dx.doi.org/10.1063/1.369638 - 24. WÖhler, H., Hass, G., Fritsch, M. and Mlynski, D.A. (1988) Faster 4 × 4 Matrix Method for Uniaxial Inhomogenous Media. Journal of the Optical Society of America, 5, 1554-1557.
http://dx.doi.org/10.1364/JOSAA.5.001554 - 25. Azofeifa, D.E., Arguedas, H. J. and Vargas, W.E. (2012) Optical Properties of Chitin and Chitosan Biopolymers with Application to Structural Color Analysis. Optical Materials, 35, 175-183.
http://dx.doi.org/10.1016/j.optmat.2012.07.024 - 26. Richards, A.G. (1951) The Integument of Arthropods. University of Minnesota Press, Minneapolis.
- 27. Caveney, S. (1971) Cuticle Reflectivity and Optical Activity in Scarab Beetles: The Role of Uric Acid. Proceedings of the Royal Society of London B, 178, 205-225.
http://dx.doi.org/10.1098/rspb.1971.0062 - 28. Fink, D.A., Sours, R.E. and Swift, J.A. (2003) Modulated Uric Acid Growth in the Presence of Acridine Dyes. Chemistry of Materials, 15, 2718-2723.
http://dx.doi.org/10.1021/cm021751y - 29. Vargas, W.E., Azofeifa, D.E. and Arguedas, H.J. (2013) índices de refracción de la quitina, el quitosano y el ácido úrico con aplicación en análisis de color estructural. óptica Pura y Aplicada, 46, 55-72.
http://dx.doi.org/10.7149/OPA.46.1.55 - 30. Yang, S.K., Varadan, V.V., Lakhtakia, A. and Varadan, V.K. (1991) Reflection and Transmission of Elastic Waves by a Structurally Chiral Arrangement of Identical Uniaxial Layers. Journal of Physics D: Applied Physics, 24, 1601-1608.
http://dx.doi.org/10.1088/0022-3727/24/9/012 - 31. Guarín-Zapata, N., Gomez, J., Yaraghi, N., Kisailus, D. and Zavattieri, P.D. (2015) Shear Wave Filtering in Naturally-Ocurring Bouligand Structures. Acta Biomaterialia, 23, 11-20.
http://dx.doi.org/10.1016/j.actbio.2015.04.039 - 32. Weaver, J.C. Milliron, G.W., Miserez, A., Evans-Lutterodt, K., Herrera, S., Gallana, I., Mershon, W.J., Swanson, B., Zavattieri, P., DiMasi, E. and Kisailus, D. (2012) The Stomatopod Dactyil Club: A Formidable Damage-Tolerant Biological Hammer. Science, 336, 1275-1280.
http://dx.doi.org/10.1126/science.1218764 - 33. Thomas, D.B., Seago, A. and Robacker, D.C. (2007) Reflections of Golden Scarabs. American Entomologist, 53, 224-230.
http://dx.doi.org/10.1093/ae/53.4.224 - 34. de Gennes, P.G. and Prost, J. (2010) The Physics of Liquid Crystals. Oxford University Press, Oxford.
- 35. Joannopoulos, J.D., Johnson, S.G., Winn, J.N. and Meade, R.D. (2008) Photonic Crystals Molding the Flow of Light. Princeton University Press, Oxford.
- 36. Fan, C.Z., Wang, J.Q., He, J.N., Pei, D. and Liang, E.J. (2013) Theoretical Study on the Photonic Band Gap in One-Dimensional Photonic Crystals with Graded Multilayer Structure. Chinese Physics B, 22, Article ID: 074211.
http://dx.doi.org/10.1088/1674-1056/22/7/074211 - 37. Arwin, H., Berlind, T., Johs, B. and Järrendahl, K. (2013) Cuticle Structure of the Scarab Beetle Cetonia aurata Analyzed by Regression Analysis of Mueller-Matrix Ellipsometric Data. Optics Express, 21, 22645-22656.
http://dx.doi.org/10.1364/OE.21.022645 - 38. Heavens, O.S. (1991) Optical Properties of Thin Solid Films. Dover, New York.
- 39. Vargas, W.E. (2011) Light Scattering and Absorption by Non-Homogeneous Materials: The Kubelka-Munk Model. óptica Pura y Aplicada, 44, 163-183.
- 40. Maheu, B., Letoulouzan, J.N. and Gouesbet, G. (1984) Four-Flux Model to Solve the Scattering Transfer Equation in Terms of Lorenz-Mie parameters. Applied Optics, 23, 3353-3362.
http://dx.doi.org/10.1364/AO.23.003353 - 41. Vargas, W.E. (1998) Generalized Four-Flux Radiative Transfer Models. Applied Optics, 37, 2615-2623.
http://dx.doi.org/10.1364/AO.37.002615 - 42. Locke, M. (1960) The Cuticle and Wax Secretion in Calpodes ethlius (Lepidoptera, Hesperidae). Quarterly Journal of Microscopical Science, 101, 333-338.
- 43. Vargas, W.E. and Niklasson, G.A. (1997) Forward Average Path-Length Parameter in Four-Flux Radiative Transfer Models. Applied Optics, 36, 3735-3738.
http://dx.doi.org/10.1364/AO.36.003735 - 44. Vargas, W.E. and Niklasson, G.A. (1997) Forward-Scattering Ratios and Average Pathlength Parameter in Radiative Transfer Models. Journal of Physics: Condensed Matter, 9, 9083-9096.
http://dx.doi.org/10.1088/0953-8984/9/42/021 - 45. Vargas, W.E. and Niklasson, G.A. (1997) Applicability Conditions of the Kubelka-Munk Theory. Applied Optics, 36, 5580-5586.
http://dx.doi.org/10.1364/AO.36.005580
NOTES

*Corresponding author.