Optics and Photonics Journal
Vol.4 No.2(2014), Article ID:43075,12 pages DOI:10.4236/opj.2014.42005
First Order Phase Transitions as Radiation Processes, Part Two
Shanghai CEC ZhenHua Crystal Technology Co. Ltd., Shanghai, China
Email: *vitali.tatartchenko@orange.fr
Received November 24, 2014; revised December 25, 2014; accepted January 21, 2014
ABSTRACT
This paper presents new experimental results concerning the PeTa effect—infrared characteristic radiation under first order phase transitions, especially during deposition and condensation of vapours/gases and the crystallisation of melts. The abbreviation “PeTa effect” means Perel’man-Tatartchenko’s effect. The nature of the PeTa effect is transient radiation that a particle (i.e., atom, molecule or/and cluster) emits during a transition from a meta-stable higher energetic level (in a super-cooled melt or super-saturated vapour) to the stable condensed lower level (in a crystal or liquid). The radiation removes latent heat with photons of characteristic frequencies that are generated under this transition. This paper is the second in a set describing the appearance of PeTa radiation under air cooling with deposition and condensation of air components. The radiation was recorded using an IR Fourier Spectrometer with a highly sensitive MCT detector. Certain peculiarities of the recorded radiation as well as its applications in the physics of the atmospheres of Earth and Jupiter are analysed.
Keywords:PeTa Effect; First Order Phase Transitions; Vapour Condensation; Vapour Deposition; Melt Crystallisation; Infrared Radiation; Atmospheric Phenomena; Igloo Effect; Jupiter
1. Introduction
This paper presents new experimental results for the PeTa effect—a physical phenomenon of infrared characteristic radiation (IRCR) under first order phase transitions, especially during deposition and condensation of vapours/ gases and crystallisation of melts. The effect was theoretically predicted by M. Perel’man [1] and was investigated by V. Tatartchenko for several alkali halides [2,3] and sapphire [4]. The nature of the PeTa effect is that a particle (i.e., atom, molecule or/and cluster) emits transient radiation during transition from a meta-stable higher energetic level (in a super-cooled melt or super-saturated vapour) to a stable and condensed lower level (in a crystal or melt). The radiation removes latent heat by photons with characteristic frequencies that are generated under this transition. Previous papers present theoretical [1,5-9] and experimental [2-4,7,10-21] evidences of the PeTa effect, but as highlighted in [22], additional investigations concerning atmospheric phenomena are needed. This paper is the second paper of a set. In the first paper [23], a striking demonstration of the PeTa effect is presented. The paper describes the presence of infrared radiation during the deposition and condensation of air components at the temperature of liquid nitrogen. The experiments consist of a simple scheme of deep cooling air, while recording the emissive spectra using an IR Fourier Spectrometer with a highly sensitive MCT detector (Figure 1 from [23]). The experiments allow estimation of both the range and order of intensity of PeTa radiation under these conditions. The main objective of the experiments is to eliminate all doubts that the PeTa effect not only exists, but that the power of PeTa radiation is significant, and has to be taken into account in all calculations of energetic balance for the atmospheres of Earth and other planets. Why did we use the temperature of the liquid nitrogen? In the experiments, we would like to be
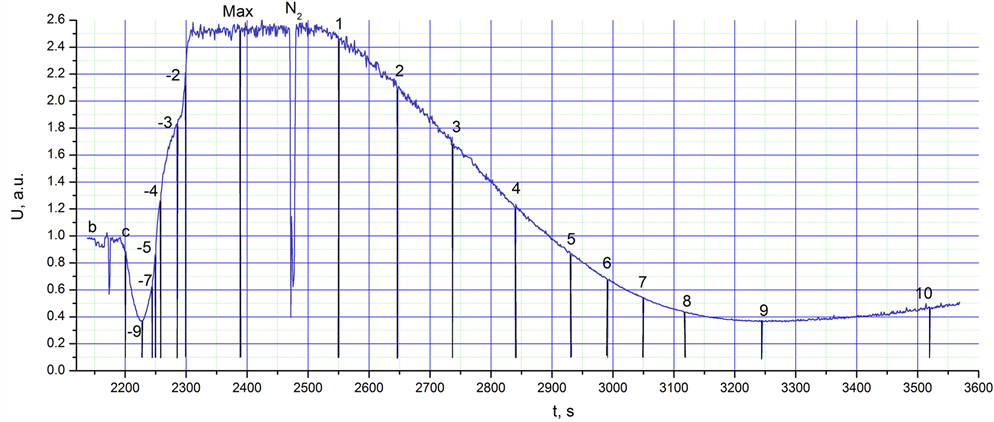
Figure 1. Integral intensity of IR radiation,U, in a.u. (arbitrary units), between 1 and 25 µm from the glass cup heated from the temperature of liquid nitrogen (77 K) to room temperature (298 K) vs. experiment time.
sure that Planck’s radiation does not influence our results. Deep air cooling allowed these conditions. If we decrease the temperature from 298 K to 77 K, the maximum amplitude of Planck’s radiation will move from 9.9 µm to 37.6 µm, and the integral intensity of equilibrium radiation in the range of our measurement, 1 to 25 µm, has to be decreased by a factor of 3500. In our experiments [23], the increase of integral radiation was approximately by a factor of 3 in comparison with the Planck’s radiation at room temperature. Thus, the obtained four orders effect is sufficient to ascertain that PeTa radiation exists. Certainly, this estimation is rather approximate because we did not protect the spectrometer from the parasitic surrounding sources of Planck’s radiation. However, in any case, the PeTa effect in the experiments is sufficiently large that any student would be able to observe the effect with a rather simple infrared detector. In this paper, which is a sequel of the previous paper [23], we investigate certain peculiarities of PeTa radiation, and demonstrate the presence of PeTa energy sources in the atmospheres of Earth and Jupiter.
2. Experiments
For the recording of IR radiation, the same Fourier spectrometer utilised in previous experiments [23] was used; and as before [23], the irradiative object, a 200 ml cup, was placed approximately 4 cm from the input window of the spectrometer (Figure 1 from [23]).
2.1. PeTa Radiation during Increasing of the Temperature from 77 K to 298 K
An objective of the first experiment was to analyse the peculiarities of PeTa spectra under gradual changes of conditions during condensation and/or deposition of different air components, by increasing the temperature of the target, from the temperature of liquid nitrogen (77 K) to room temperature (298 K). The integral radiation intensity within the range of 1 - 25 µm was continuously recorded from the irradiative cup wall. In this instance, a glass cup was used. For radiation spectra, a time of 1.09 s was chosen for the accumulation of data for one spectrum, and an average of 5 spectra was used. Thus, we had a new spectrum every 5.44 s, with a resolution of 2 cm-1. The temperature of the laboratory was 25˚C (298 K) and the relative humidity was 47% (corresponding to 286 K for the water vapour dew point).On the integral radiation curve (Figure 1), we demonstrate that points in the vicinity of the irradiation spectra were averaged, and different manipulations were performed. First (Figure 1, point b), the background irradiation spectrum corresponding to room temperature was recorded from the empty cup (Figure 2(b), curve bg). Several seconds after beginning measurements, the glass cup was filled with the liquid nitrogen (Figure 1, c point). The intensity of the integral radiation naturally decreased because of decreasing temperature (Figure 1, −9 point), but after the beginning of condensation and deposition of air components, the PeTa radiation appeared and the intensity grew to a maximum value (Figure 1, range “max”) through points −7, −5, −4, −3, −2. Approximately 180 s later (Figure 1, point N2), the cup was emptied of liquid nitrogen. The sharp down peak is a result of this manipulation. Evidently, the temperature began to grow, but the integral intensity of recorded radiation began to decrease because of the decreasing intensity caused by PeTa radiation. At approximately 780 s, up to point 9 of Figure 1, there is a concurrence of two processes—decreasing
 (a)
(a)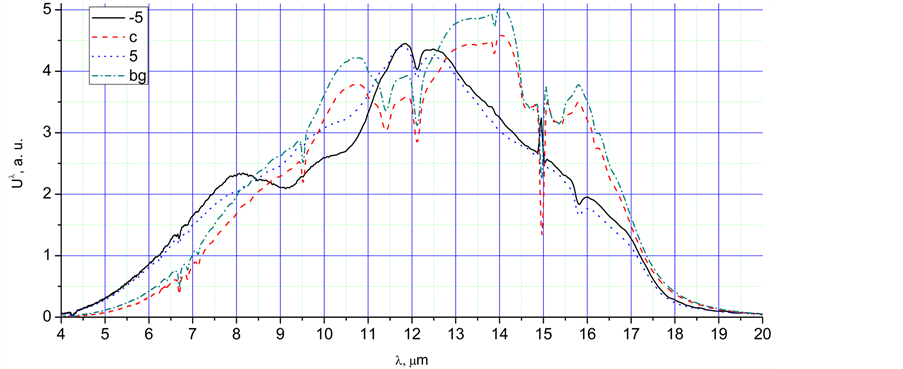 (b)
(b)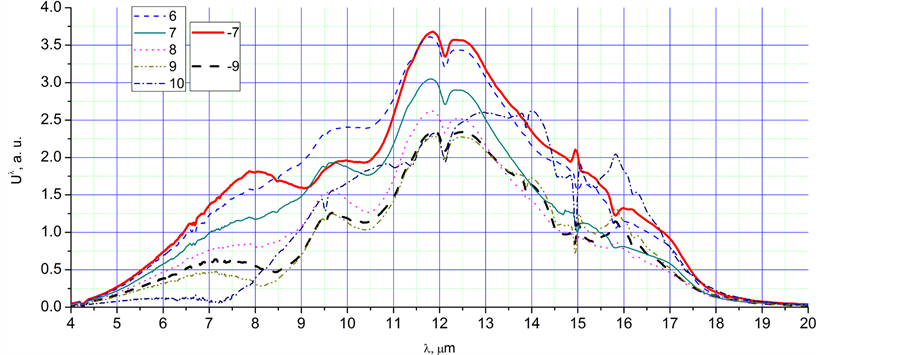 (c)
(c)
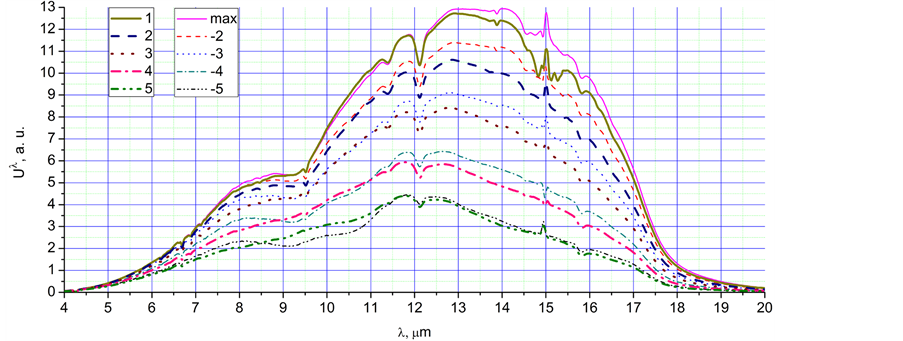
Figure 2. The radiation spectra, Uλ, in a.u., corresponding to different time points of the Figure 1: (a) 1 - 5, max, (−2) - (−5); (b) −5, c, 5, bg; (c) 6 - 10, −7, −9.
PeTa radiation and increasing Planck’s radiation. At point 9, the speed of radiation change is equal to zero. At this point, the speed of decreasing PeTa radiation is equal to the speed of increasing Planck’s radiation. Approximately 150 s later (Figure 1, point 10), Planck’s radiation increases faster than PeTa radiation decreases. After achievement of the dew point, only Planck’s radiation has to be recorded.
Here are the critical temperature ranges of our experiment for normal atmospheric pressure, and possible physical processes for equilibrium conditions (without supercooling, besides a well-known super-cooling of water up to 40 K):
Ÿ 77 K - 88 K: deposition of H2O and CO2, condensation of Ar and O2.
Ÿ 88 K - 90 K: deposition of H2O and CO2, condensation of O2.
Ÿ 90 K - 195 K: deposition of H2O and CO2.
Ÿ 195 K - 233 K: deposition of H2O.
Ÿ 233 K - 273 K: deposition and condensation of H2O.
Ÿ 273 K - 286 K (dew point): condensation of H2O.
Ÿ 286 K - 298 K: evaporation of H2O.
Thus, on the Figure 1, it would be interesting to obtain dependence of the PeTa radiation intensity, U, vs. T. But U was found to have a temperature hysteresis. This interesting phenomenon has to be investigated in details. We will publish results in the following paper.
Let us compare consequent spectra.
Ÿ Increasing the temperature moves the main peak from 13.5 µm to the shorter wavelength of 11.5 µm (spectra 1 - 9). However, for spectrum 10, the peak moves back to 13.5 µm. This effect can be connected with the condensation of water, as well as with augmentation of Planck’s radiation.
Ÿ The spectra obtained during very fast cooling have more intensive peaks near 8 µm in comparison with spectra of the same integral intensity obtained during slow heating. It is especially clear for spectra −5 and 5 of Figure 2(b). This phenomenon is most likely connected with intensive condensation and crystallisation of super-cooled water.
2.2. PeTa Radiation during Increasing of Temperature from 253 K to 298 K
An objective of the second experiment was to obtain PeTa radiation during deposition and condensation of water vapour on a cooled cup wall at a temperature range of 253 K to 286 K with synchronised recording of hoarfrost grains, or the dew droplets on the surface, with an optical microscope (magnification X10 - X500).
The temperature of the laboratory was 25˚C (298 K) and the relative humidity was 47% (corresponding to 286 K for the water vapour dew point). An irradiative object, a 200 ml plastic cup containing alcohol-water solution cooled in a refrigerator, was placed approximately 4 cm from the input window of the spectrometer (Figure 1 from [23]). The integral radiation intensity, U, within the range 1 - 25 µm was continuously recorded from the wall of the irradiative cup (Figure 3). At the beginning, the temperature of the cup was 255 ± 2 K. On the photo (Figure 4(b)), we can see a deposition of hoarfrost grains on the cooled surface. This means that at this moment, the recorded radiation is the sum of PeTa radiation and Planck’s radiation. Evidently, the temperature of the cup begins to grow, but the integral intensity of radiation begins to decrease. This can only be the result of a decrease of PeTa radiation intensity.
We divided the interval of time of cup heating from this temperature to room temperature over twelve ranges (Figure 3):
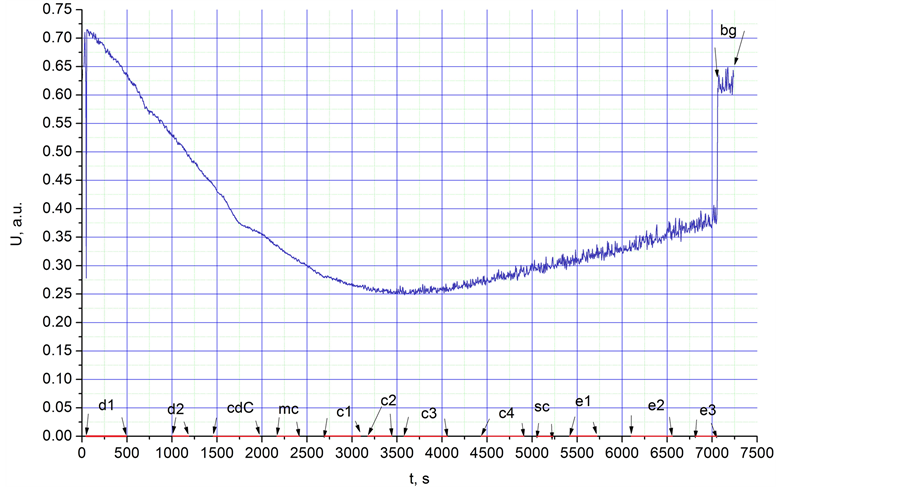
Figure 3. Integral intensity of IR radiation, U, in a.u. (arbitrary units), between 1 and 25 µm from the glass cup heated from a temperature of 253 K to room temperature (298 K) vs. experiment time.
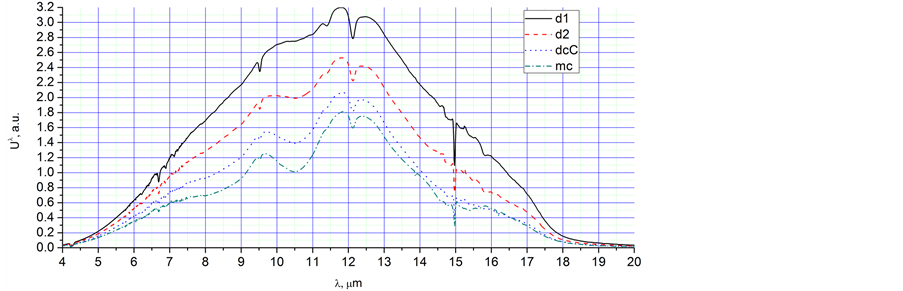
Ÿ First, we explain the notifications that we use for all: 1. Ranges: d1, d2; 2. Time interval: 100 - 1200 s; 3. Physical process: the water vapour deposition; 4. The averaged spectra of radiation for each range: Figure 4(a), d1, d2; 5. Peculiarities of spectrum: appearance of peaks 9.7 µm; 6. The pictures of the surface at the beginning and at end of the interval: Figures 4(b) and (c); 7. Comments: At the end of d2 interval, the grains cover all surface of the cup.
Ÿ 1. cdC; 2. 1486 - 1986 s; 3. Water vapour condensation, deposition, and crystallisation of formed droplets; 4. Figure 4(a), cdC; 5. Relative augmentation of the peak 9.7 µm; 6. Figures 4(d) and (e); 7. The peak 9.7 µm is most likely connected with water vapour condensation.
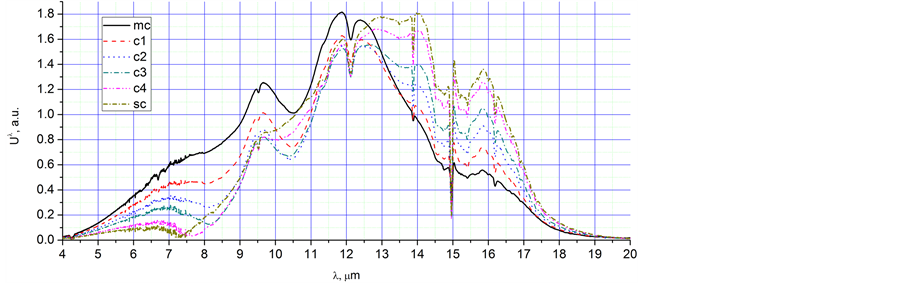
Ÿ 1. mc; 2. 2200 - 2400 s; 3. Ice melting and water vapour condensation; 4. Figures 4(a) and 5(a), mc; 5. Relative augmentation of the peak at 9.7 µm; 6. Figures 4(f) and (g); 7. As in the previous point, the peak at 9.7 µm is most likely connected with water vapour condensation.
Ÿ 1. c1 - sc; 2. 2700 - 5244 s; 3. Water vapour condensation up to stop condensation; 4. Figure 5(a), c1, c2, c3, c4, sc; 5. Appearance and relative increasing of the peak at 6.7 µm, relative augmentation of the peak at 9.7 µm, appearance of the peak at 15.8 µm, displacement of the main peak from 12 µm to 13.5 µm; 6. Figures 5(b) and (c); 7. The peaks at 6.7 µm and 9.7 µm are most likely connected with water vapour condensation.
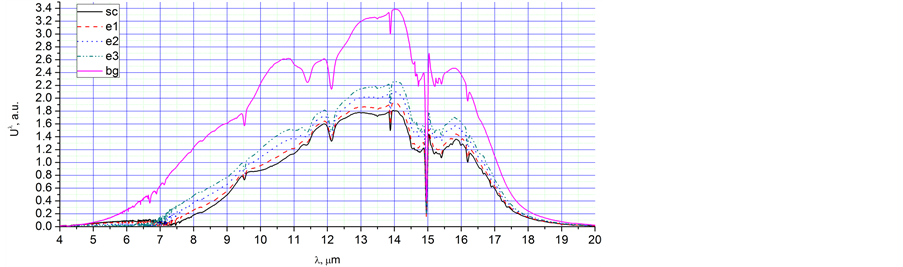
Ÿ 1. e1 - e3; 2. 5444 - 7044 s; 3. Water vapour droplet evaporation; 4. Figure 6(a), e1, e2, e3; 5. ; 5. Disappearance of the peaks at 6.7 µm and 9.7 µm, growth of the intensity of radiation; 6. Figures 6(b) and (c); 7. Evidently, peaks 6.7 µm and 9.7 µm are connected with water vapour condensation; growth of the intensity of radiation is connected with Planck’s radiation.
Ÿ 1. bg; 2. 7100 s; 3. Planck’s radiation at room temperature; 4. Figure 6(a), bg.
2.3. Comparison of the Intensities of PeTa and Planck’s Radiations
The objective of the third experiment was to compare the sources of PeTa and Planck’s radiations. All conditions of the experiment were the same as in the previous two experiments.
1) We filled the Al cup with liquid nitrogen (77 K). The wall of the cup was covered with an ice film. We measured the integral intensity of radiation, U1, in the range of 1 to 25 µm from the cup wall. We filled the plastic cup with water heated to a temperature higher than the dew point. We measured the integral intensity of radiation, U2, in the range of 1 to 25 µm from the cup wall. We increased the temperature of the water up to the equalisation point of both (U1 and U2) intensities. We repeat once more, if we decrease the temperature from 298 K to 77 K, the maximum amplitude of Planck’s radiation will move from 9.9 µm to 37.6 µm, and the integral intensity of equilibrium radiation in the range of our measurement has to be decreased by a factor of 3500. This means that Planck’s radiation from the cup with liquid nitrogen is a negligible quantity, and the cup will emit only PeTa radiation. Thus, we found that at the temperature of the laboratory 298 K and relative humidity 47% (corresponding to 286 K for water vapour dew point), the integral PeTa radiation at 77 K corresponds to Planck’s radiation at 329 ± 2 K. The spectra of both radiations are shown in Figure 7. Certainly, this comparison is rather approximate because:
Ÿ We did not protect the spectrometer from the parasitic surrounding sources of Planck’s radiation.
Ÿ We used a plastic cup so the emissions of the ice and plastic do not significantly differ.
2) We performed the same experiment with two plastic cups filled with a cooled alcohol solution and water heated to a temperature higher than the dew point. We found that the integral intensity of the radiation at 253 ± 2 K corresponds to the intensity of Planck’s radiation at 298 ± 2 K. However, at 253 K, we cannot neglect Planck’s radiation. Thus, we found that at the temperature of the laboratory (298 K) and a relative humidity of 47% (corresponding to 286 K for the water vapour dew point), the integral at the range of 1 - 25 µm for the totality of PeTa and Planck’s radiations at 253 ± 2 K, corresponds to Planck’s radiation at 298 ± 2 K. The spectra of both radiations are shown in Figure 7.
3. PeTa Radiation in Nature, in the Atmospheres of Earth and Jupiter
In the paper [23], we mentioned several cases of PeTa radiation recorded in nature. Here are some others:
3.1. Igloo Effect
An igloo, or snow-house, is a type of shelter built from snow. On the outside, temperatures may be as low as −45˚C, but on the inside the temperature may range from −7˚C to 16˚C. A widely spread opinion is that snow is a good insulator [24]. No doubt, this is through. But our experiments indicate that the snow walls of an igloo have to be a good source of PeTa radiation. Most likely, this is the reason of wide use of these habitations in northern areas. There is a very interesting consequence from this assertion. Let us imagine that in the wall of a house there is a hole covered with a metallic sheet. If the temperature outside is −40˚C, inside the sheet will emit PeTa radiation that is equivalent to Planck’ radiation
 (a)
(a)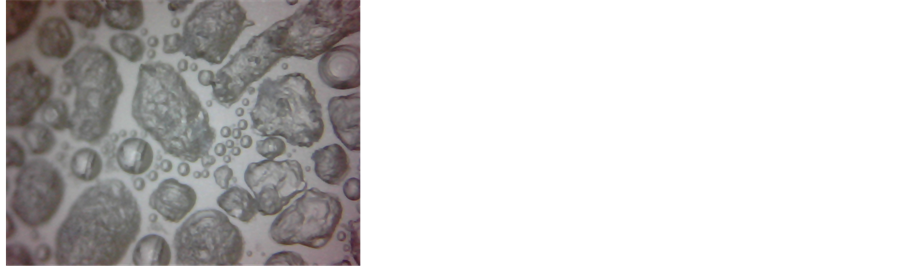 (b)
(b)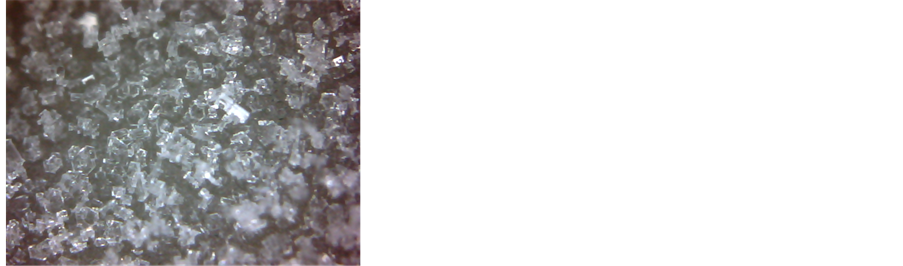 (c)
(c)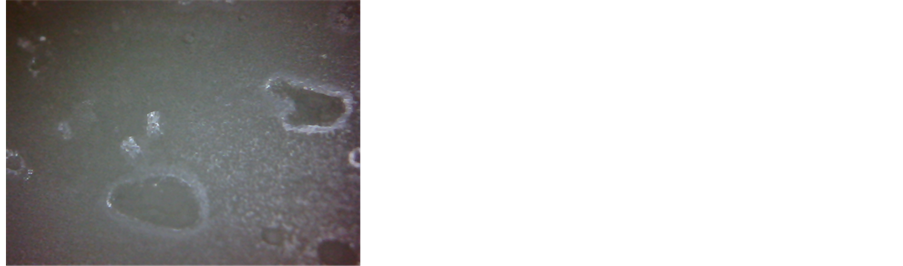 (d)
(d)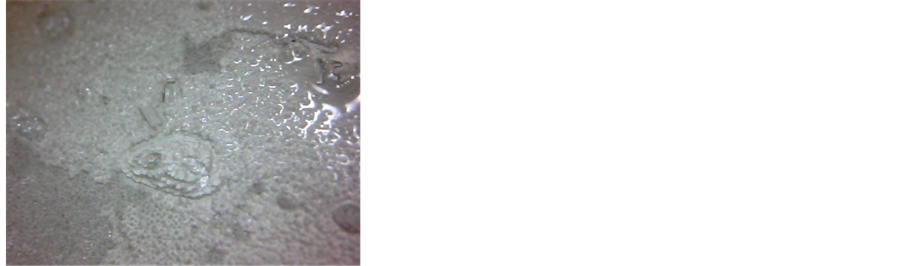 (e)
(e)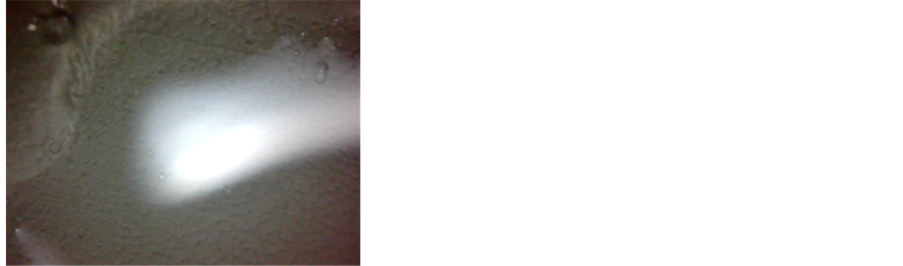 (f)
(f)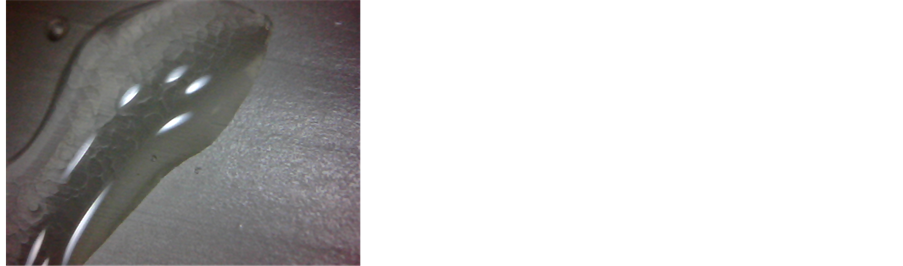 (g)
(g)
Figure 4. (a) The four radiation spectra, Uλ, in a.u., as the integral radiation intensity decreases between times 0 s and 2500 s; (b, c) View of ice grain deposition at the beginning of interval d1 (4b) and at the end of interval d2 (4c); X12; (d, e) View of water vapour deposition, condensation, and crystallisation at the beginning (4d) and at the end (4e) of interval dcC; X120; (f, g) View of ice grains melting and water vapour condensation at the beginning (4f) and at the end (4g) of interval mc; X120. Here and below, the bright spots are reflections of a booster light from the surface of water.
 (a)
(a)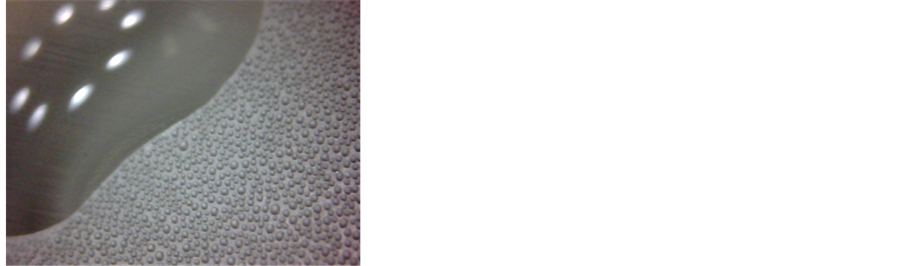 (b)
(b)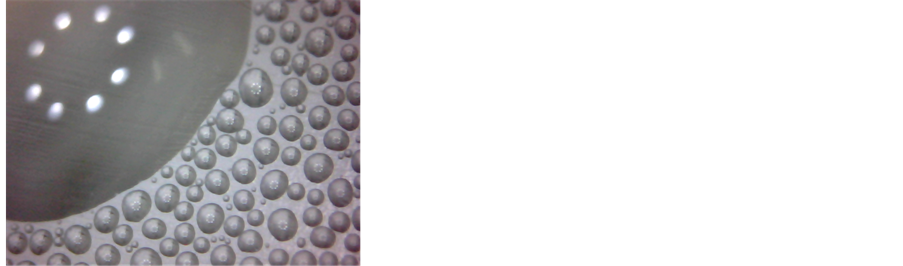 (c)
(c)
Figure 5. (a) The six radiation spectra, Uλ, in a.u., as the integral radiation intensity decreases between times 2500 s and 5250 s; (b, c) View of water vapour condensation at the beginning of interval c1 (5b) and at the end of interval sc (5c); X120.
 (a)
(a) (b)
(b)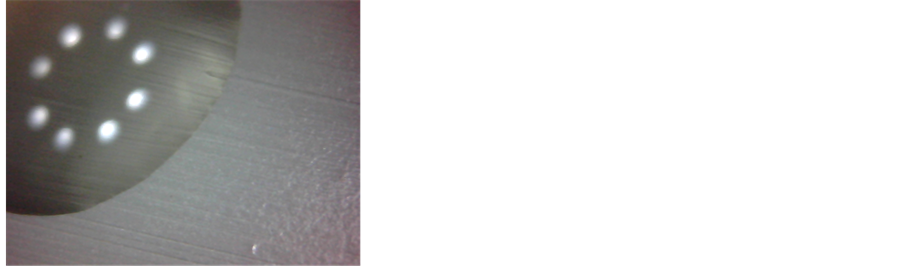 (c)
(c)
Figure 6. (a) The five radiation spectra, Uλ, in a.u., as the integral radiation intensity decreases between times 5250 s and 7100 s; (b, c) View of water droplets at the end of the range e2 (6b) and at the end of the range e3 (6c); X120.
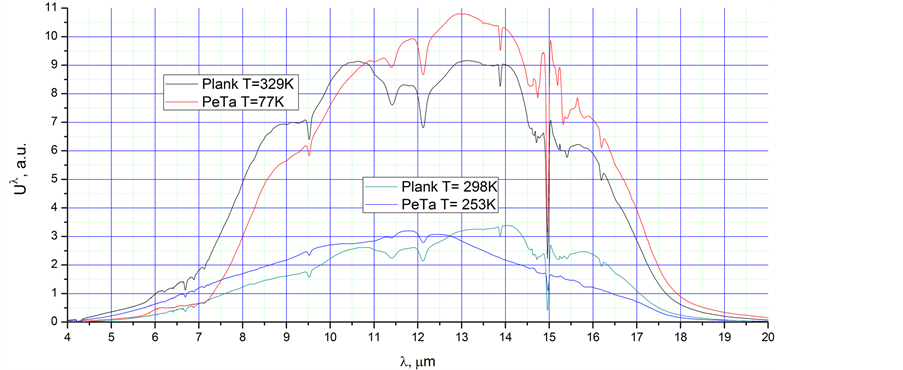
Figure 7. The four radiation spectra, Uλ, in a.u., corresponding to the four different temperatures of irradiative objects.
emitted by the sheet, heated to approximately 30˚C. Certainly, inside the house, the metallic sheet has to be protected against thermo-conductive heat loss.
3.2. Hot Ice-Cream
Evidently, the same effect has to exist for an ice-cream.
3.3. Stuffiness before Thunderstorm
The stuffiness is a well-known effect that ceases with the first droplets of rain [25]. Most likely, the effect is a result of PeTa radiation during intensive cloud formation.
3.4. PeTa Radiation Sources in the Earth’s Atmosphere
Detected by satellites, IR radiation would allow very important information concerning the atmospheric and earth’s surface processes to be accumulated if interpretation of IR images is definite. Let us analyse an anomalous distribution of IR radiation mainly obtained from the Advanced Very High Resolution Radiometer data in the channels of 10.3 - 11.3 µm, and 11.5 - 12.5 µm [26-36]. The zones of permanent or periodical increased intensity of radiation were detected on the images of tectonic breaks located in the west part of the North American continent, in the south part of East Siberia, in the Tarim Valley in China, in the Rhine Graben in Germany, and in zones of rift-genesis of the Afar Depression in northeastern Africa. As a result, the authors conclude that the anomalies in earth’s infrared radiation at regions of tectonic breaks have a global character. Four types of anomalies were detected: 1. Linear; 2. Contour; 3. Striped; 4. Isolated. Respectively, they had the lengths: 1. 200 - 600 km; 2. 100 - 200 km; 3. 40 - 60 km; 4. 1.0 - 1.5 km; and the widths: 1. 5 - 15 km; 2. 1 - 6 km; 3. 10 - 20 km; 4. 1.0
- 1.5 km. Emission of 1st, 2nd, 4th types had a permanent character, and the 3rd type was most noticeable at the rain seasons and became weak during winters. Some of the anomalies were located in ocean or lake coast strips, but the most were situated on the middles of slopes in mountain ranges. The last anomalies were narrower for the steeper slopes, and the intensity of their radiation was distributed with the most contrast on alternate mountain ranges and valleys. Typical values of measured infrared flows were arranged as 50 - 90 mW/(m2∙str∙μm). The authors have mainly explained these anomalies as the sources of endogen heat flow exiting through tectonic breaks.
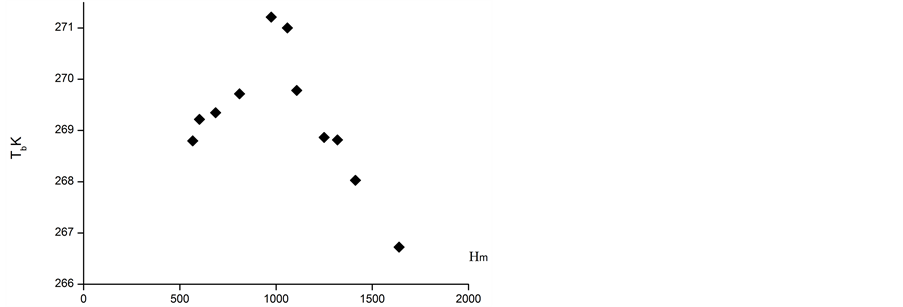
We think this explanation is false. Given that the anomalies are located in places with ideal conditions for fog and cloud formation, it would seem to follow as a natural consequence that the recorded IR radiation is PeTa radiation of water vapour condensation and/or deposition during fog and cloud formation. First of all, it is not surprising that anomalies were detected in the zones of tectonic breaks, because only these zones had been considered in [26-36]. Indeed, in [37], the similar ‘thermal lines’ were mentioned in North Karelia, the basin of the White Sea, the Kola Peninsula, the North Arkhangelsk region, and at the foots of the mountains of Kopet Dagh, Urals, Caucasus, and Himalayas. Secondly, the hypothesis from [26-36] cannot explain why endogen heat exits on the middle of mountain slopes of altitude more than 1000 m (Figure 8). As for clouds, near Mont Blanc a guide points your attention to a cloud which steadily circles the mountain at an altitude of nearly 2500 m. Condensation of cooled water vapour in the warm air flow rising along the mountain slope is the reason of these cloud formations. The peculiarities of the zones of infrared radiation, especially narrowing on the steep slopes and their periodicity with season, correspond to our assumption. Moreover, large quantities of charged ions in the atmosphere along the tectonic brakes could intensify
 (a)
(a) 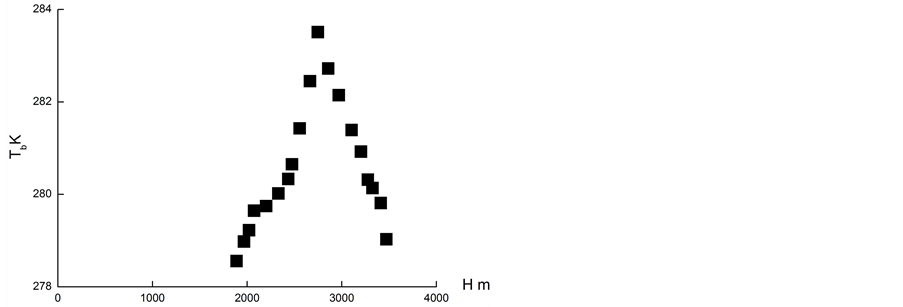 (b)
(b)
Figure 8. Distribution of bright temperature on the slopes of mountains: (a) from [33] - Primorsky fault (Siberia, Russia); (b) from [26] - Taibai west slope (California, USA).
the process of vapour condensation.
With respect to Morozova [38] analysing linear clouds anomalies (LCA) with satellite imagery, the appearance of LCA above breaks in the lithosphere over various earth regions is a well-known natural phenomenon. LCA length can reach several hundreds of kilometres. A unified opinion concerning the nature of LCA is absent. Letnikov [39] asserts that the breaks of lithosphere are the sources of ionised radon which initiates the LCA formation. Other geologists support orographic factors of LCA appearance. In any case, existence of LCA, as well as the seasonal and diurnal change of sources’ intensities [36] supports the PeTa model.
It has to be mentioned that, sometimes, together with endogen heat, authors of [26-36] discuss a water vapour condensation as a possible infrared source: “Water vapour is transformed in a fog. The heat of the phase transition is liberated, the radiometers of satellites ‘see’ this heat” [30]. This does not contradict our model in which only a part of the phase transition energy is emitted as PeTa radiation. However, only heat of condensation appear not to be a reason for the anomalies. Let us estimate this effect. If a reasonable quantity, 5 g/m3, of water vapour during fog or cloud formation is condensed, and the energy of transition is completely thermalised, it will increase the air temperature by 1˚C. In reality, this effect exists [30]: A systematic measurement of three weather stations in the Tunka Valley (near Baikal) recorded a thermo-dynamical temperature on the mountain slope at the centre of the thermal line that was 1˚C higher than on the bottom of valley. On the other hand, bright temperatures systematically measured by satellites in the same region were 5 - 15 K higher [33] (Figure 8). This fact can be explained if we assume that dew points coincide with the centres of thermal lines, and are located at the middle of mountain slopes. The thermodynamic temperature difference of 1˚C higher here than on the bottoms of valleys, and the recorded higher bright temperature (Figure 8) is a result of non-equilibrium PeTa radiation.
3.5. Qualitative Model of Juvenal Atmospheric Phenomena on the Basis of PeTa Radiation
In this part of the paper, a qualitative model of Juvenal increased infrared emission is proposed. The model explains the nature of Juvenal unusual colour, and, especially, its red spots, which are a subject of numerous scientific discussions. The famous images of Jupiter captured by NASA’s Voyager spacecraft and the Hubble Space Telescope, show that Jupiter has many shades of white, orange, brown, yellow and even red. Only the following explanation of this phenomenon has been seriously discussed [40,41]. The coloration in the clouds of Jupiter is caused by upwelling compounds, known as chromophores, which change colour when they are exposed to ultraviolet light from the Sun. The substances are believed to be phosphorus, sulphur, or possibly hydrocarbons. These chromophores mix with the warmer, lower deck of clouds. The zones of different colours are formed when rising convection cells form crystallising ammonia that masks out these lower clouds from view. A criticism of the model is not the aim of this paper, but the main weak points of this model will be mentioned. First of all, only quantities of chromophores less than 1 ppm have been detected in the Juvenal atmosphere. In addition, the statement from the paper [41]: “Despite many decades of ground-based, space-based, and in situ observations of Jupiter’s atmosphere, the chemical agent(s) responsible for the varying colours observed in visible images of Jupiter remain unidentified”, leaves the question open.
It is well-known that the Jupiter emits approximately three times the energy that it receives from the Sun. The additional energy comes from the hot surface of the planet with circulation of its atmosphere. Our model may be briefly presented as follows: The intensive circulation in the Juvenal atmosphere lifts heated vapours, particularly of ammonium and water, which are condensed and solidified in the upper layers of the atmosphere. PeTa emission taking place during condensation and crystallisation seems to be the reason for the emission of infrared radiation, complementary to the equilibrium Planck’s radiation in Jupiter. Under high pressure, emission of red characteristic radiation (RCR) seems to be a possible part of PeTa radiation. Next, it would follow as a natural consequence, that PeTa emission displaces the visual colour of the planet into the red range. The red spots are the stable atmospheric vortexes. The processes of condensation and solidification, and hence coloration due to PeTa radiation, must be more intensive there. In [11-15], we have mentioned a possibility of these processes in the Juvenal atmosphere.
The Juvenal cloud structure and atmospheric pressure is notably important for our model. The only spacecraft to have descended into Jupiter’s atmosphere and to have taken scientific measurements is Galileo. This spacecraft sent an atmospheric probe into Jupiter upon arrival in 1995: next, it entered Jupiter’s atmosphere, where it burned up in 2003. Ice clouds of ammonia (NН3), ammonium hydrosulphide (NH4SH), and water were recorded. The average content of water and ammonia in the Juvenal atmosphere is 0.1% and, 0.02% [42]. As for the atmospheric pressure, it has been found to be 0.2 bar in the high cloud boundary, and 20 bars at the depth of 50 km.
We are aware of the weak points of our brief model. This model is a first step of applying the PeTa effect to Juvenal atmospheric processes. There are many further analyses to perform. First, spectra of PeTa emission have to be determined for the atmospheric components. Secondly, the windows of transparency, absorption and reemission, have to be taken into account. However, in any case, the PeTa effect exists, and it has to be accounted for in all atmospheric models.
4. Conclusions
In our experiments, radiation occurs during condensation or/and the deposition of air components. Only the PeTa effect can explain this radiation.
According to the principles of quantum electro dynamics, the presence of the described spontaneous transitions, and as a result, PeTa radiation, should lead to an opportunity to stimulate such transitions. For example, crystallization by irradiation of the substance close to the temperature of crystallisation at a resonant frequency corresponding to the particular transition, can be stimulated. Such opportunities, which have not been investigated experimentally to date, should uncover new effects. For instance, fog or ice cloud formation may occur as a result of atmosphere irradiation by characteristic radiation. At the same time, the primary laser beam will be amplified. In this way, the PeTa energy of water condensation or freezing in the atmosphere can be accumulated.
The second method of atmospheric PeTa energy accumulation could use an infra-red laser and be based on water vapour condensation or freezing in atmosphere. Let us imagine a system of two parallel mirrors (one of them is semi-transparent) of area of 1 m2 and at the distance of 1 m each from each other. Let us locate this system in the atmosphere where water vapour is saturated but is not yet condensed, for instance, on the slope of the mountain Primorski (approximately lower 1000 m), or on the slope of Taibei (approximately lower 2800 m) (Figures 8(a) and (b)). Let us provoke condensing of vapour with a special salt spray, radioactive source radiation, characteristic PeTa radiation, etc. In this case approximately 5 g (the temperatures are 271 K and 284 K, respectively) of water vapour will be condensed in our system. This means that 12.4 kJ of energy will be liberated and the system would work as a laser. For 8% laser efficiency, the energy of 1kJ would be radiated. The movement of air inside the system with a speed of 1 m/s (a result of a natural convection) would provide a generator with 1 kW power. This could be a pulse generator with a frequency of 1 Hz. For comparison, a silicon solar cell of area 1 m2, with an efficiency of 14%, provides 100 W of power. Thus, PeTa radiation would be used for atmospheric energy accumulation, and together with the solar, wind, geothermal and falling water energies, provides the fifth source of ecologically pure energy.
Our experiments allow estimation of both range and order of intensity of PeTa radiation. We demonstrate that the PeTa effect not only exists, but the power of PeTa radiation is significant and must be considered in all calculations of energetic balance for the atmospheres of Earth and other planets [43]. Many sources of infrared radiation appear to be a result of PeTa radiation during fog and cloud formation in the window of atmospheric transparency (7 - 14 µm).
Our experiments explain why 6.7 µm wave-length IR radiation is used for water vapour registration in the Earth’s atmosphere.
Although theory [6,8] seemed to give a satisfactory, and, to a certain extent, quantitative explanation of the phenomenon under investigation, this explanation lacked full quantitative basis.
There are two facets of the experiment that could improve the recording of the energetic balance of the atmosphere. The first result is the exact PeTa spectrum of the phase transitions of water at the actual temperature and pressure values. The second is the value of PeTa radiation yield at the same conditions. We hope to be able to present these results in the near future.
We could also use these radiation measurements to find if there is water in the atmospheres of other planets, for instance, Mars.
This radiation may explain Jupiter’s red colour and its infrared emission. It is well-known that Jupiter emits more energy than it receives from the sun. Circulation in Jupiter’s atmosphere lifts the heated ammonium and water vapours, which are condensed and solidified in the upper part of the atmosphere. The PeTa radiation of these processes seems to be the reason for the emission of infrared radiation which displaces the planet’s colour in the red range.
A similar process could be applied for artificial cooling of Earth: creating upper cirrus clouds using characteristic PeTa radiation and, as a result, leading to heat emission into space.
REFERENCES
- M. E. Perel’man, “Phase Transitions Caused by the Opening of New Channels in Electron-photon Interactions,” Physics Letters A, Vol. 37, No. 5, 1971, pp. 411-412. http://dx.doi.org/10.1016/0375-9601(71)90609-8
- V. A. Tatarchenko, “Appearance of Distinguishing Features in Emission Spectra during Crystallization of Substances Transparent in the IR Region,” Soviet Physics— Crystallography, Vol. 24, No. 2, 1979, pp. 238-239.
- L. M. Umarov and V. A. Tatarchenko, “Differential Spectra of Crystallization Radiation of Alkali-Metal Halides”, Soviet Physics—Crystallography, Vol. 29, No. 6, 1984, pp. 670-673.
- V. A. Tatarchenko and L. M. Umarov, “Infrared Radiation Accompanying the Crystallization of Sapphire,” Soviet Physics—Crystallography, Vol. 25, No. 6, 1980, pp. 748-749.
- V. A. Tatarchenko, “Shaped Crystal Growth,” Kluwer, London, 1993, p. 3. http://dx.doi.org/10.1007/978-94-017-2988-8
- M. E. Perel’man and V. A. Tatartchenko, “Phase Transitions of the First Kind as Radiation Processes” arXiv: 0711.3570, 2007, pp. 1-17.
- V. A. Tatartchenko, “Characteristic IR Radiation Accompanying Crystallization and Window of Transparency for It,” Journal of Crystal Growth, Vol. 310, No. 3, 2008, pp. 525-529. http://dx.doi.org/10.1016/j.jcrysgro.2007.11.155
- M. E. Perel’man and V. A. Tatartchenko, “Phase Transitions of the First Kind as Radiation Processes,” Physics Letters A, Vol. 372, No. 14, 2008, pp. 2480-2483. http://dx.doi.org/10.1016/j.physleta.2007.11.056
- M. E. Perel’man, G. M. Rubinstein and V. A. Tatartchenko, “Mechanisms of Dendrites Occurrence during Crystallization: Features of the Ice Crystals Formation,” Physics Letters A, Vol. 372, No. 22, 2008, pp. 4100-4103. http://dx.doi.org/10.1016/j.physleta.2008.03.009
- V. A. Tatartchenko, “Some Peculiarities of First Order Phase Transitions,” Reviews on Advanced Materials Science, Vol. 20, No. 1, 2009, pp. 58-69.
- V. A. Tatartchenko, “Infrared Laser Based on the Principle of Melt Crystallization or Vapor Condensation. Why Not?” Optics & Laser Technology, Vol. 41, No. 8, 2009, pp. 949-952. http://dx.doi.org/10.1016/j.optlastec.2009.04.001
- V. A. Tatartchenko, “Infrared Characteristic Radiation of First Order Phase Transitions in Connection with Optics of Atmosphere”, Atmospheric and Oceanic Optics, Vol. 23, No. 4, 2010, pp. 169-175.
- V. A. Tatartchenko, “Nature of Some Sources of Atmospheric Infrared Radiation,” Investigation of Earth from Space, No. 2, 2010, pp. 88-90.
- V. A. Tatartchenko, “The Nature of Specific Sources of Infrared Radiation Recorded by Satellites,” Modern Problems of Distance Probes of Earth from Space, Institute of Space Research of Russian Academy of Sciences, Moscow, Vol. 7, No. 4, 2010, pp. 310-318.
- V. A. Tatartchenko, “Infrared Characteristic Radiation of Water Condensation and Freezing in Connection with Atmospheric Phenomena,” Earth Science Reviews, Vol. 101, No. 1-2, 2010, pp. 24-28.
- V. A. Tatartchenko, “Infrared Characteristic Radiation of Water Condensation and Freezing in Connection with Atmospheric Phenomena; Part 2: New Data,” Earth Science Reviews, Vol. 107, No. 3-4, 2011, pp. 311-314.
- V. A. Tatartchenko, Y. F. Liu, W. Y. Chen and P. V. Smirnov, “Infrared Characteristic Radiation of Water Condensation and Freezing in Connection with Atmospheric Phenomena; Part 3: Experimental Data,” Earth Science Reviews, Vol. 114, No. 3-4, 2012, pp. 218-223.
- V. A. Tatartchenko, Y. F. Liu, W. Y. Chen, J. J. Zhou, Z. Y. Zhu, P. V. Smirnov, S. J. Niu, D. Z. Li and Y. F. Lu, “Cloud Power,” Lecture Notes in Information Technology, Vol. 9, 2012, pp. 191-196.
- V. A. Tatartchenko, Y. F. Liu, W. Y. Chen, P. Smirnov and D. W. Sun, “Characteristic IR Radiation during Crystallization,” Proceedings of the 7th IWMCG, Taipei 2012, p. 26.
- V. Tatartchenko, Y.-F. Liu, Y. Wu, J.-J. Zhou, Sun D.-W., J. Yuan, Z.-Y. Zhu, P. Smirnov, A. Rusanov, S.-J. Niu, D.-Z. Li, Z.-Y. Zong and X.-F. Chen, “Infrared Characteristic Radiation under First Order Phase Transitions-Melt Crystallization and Vapor Condensation or Deposition,” Acta Physica Sinica, Vol. 62, No. 7, 2013, Article ID: 079203.
- V. A. Tatartchenko, “Characteristic IR Radiation under Crystallization, Sublimation, and Condensation (PeTa effect),” Scientific Program and book of abstracts of 17th International Conference on Crystal Growth and Epitaxy, Warsaw, 11-16 August 2013, p. 34.
- K. Ravilous, “Cloud Power,” New Scientist, Vol. 208, No. 2788, 2010, pp. 38-41. http://dx.doi.org/10.1016/S0262-4079(10)62951-X
- V. A. Tatartchenko, P. V. Smirnov and Y. Wu, “First Order Phase Transitions as Radiation Processes,” Optics and Photonics Journal, Vol. 3, No 8A, 2013, pp. 1-12. http://dx.doi.org/10.4236/opj.2013.38A001
- R. Holihan, D. Keeley, D. Lee, P. Tu and E. Yang, “How Warm Is an Igloo,” BEE 453, Cornell University, 2003. http://www.ecommons.cornell.edu/bitstream/1813/125/2/Igloo.pdf
- Stuffy Day & Thunderstorm! www.youtube.com/watch?v=HEL9jm4jZoI
- N. V. Vilor, N. A. Abushenko and S. A. Tastchilin, “Infrared Radiation of Earth in Region of Joining OceanContinent,” Investigation of the Earth from Space, No. 2, 2004, pp. 17-24.
- N. V. Vilor and N. P. Min’ko, “Infra-Red Radiation of the Baikal-Sayan Mountain Area and Baikal Rift Zone on the Basis of Data of Satellite’s Monitoring,” Reports of Russian Academy of Sciences, Vol. 379, 2001, pp. 666-669.
- N. V. Vilor and N. A. Abushenko, “The Contemporary IR-Radiation of Regional Faults, Its Nature and Application for Satellite Monitoring of Seismic Active Tension State of Central Asia,” Proceedings of the International Seminar Asia-Pacific Space Geodynamics Program, Irkutsk, 2002, pp. 199-205.
- N. V. Vilor and N. P. Min’ko, “Satellite’s Monitoring of Infrared Radiation of Structural Elements in the BaikalSayan Mountain Area,” Investigation of the Earth from Space, No. 4, 2002, pp. 55-61.
- N. V. Vilor, “Invisible Earth’s Aureole,” Chemistry and Life, No. 5, 2003, pp. 40-42.
- N. V. Vilor, N. A. Abushenko and V. S. Lepin, “Infrared Radiation of Earth’S Surface in the Zone of Arid Climate,” Reports of Russian Academy of Sciences, Vol. 388, No., 2003, pp. 647-650.
- N. V. Vilor and N. P. Min’ko, “Infrared Radiation of Structural Elements in the Baikal-Sayan Mountain Area”, Geography and Natural Resources, No. 2, 2003, pp. 50- 55.
- N. V. Vilor, N. A. Abushenko and S. A. Tastchilin, “Satellite’s Method of Investigation of Correlation between Infrared Emission Flux and Elements of Geological Earth’s Structure in the North’s Hemisphere,” Actual Problems in Remote Sending of the Earth from SpaceProceedings of Institute of Space Research, Vol. 3, No. 2, 2006, pp. 215-224.
- N. V. Vilor, N. A. Abushenko and S. A. Tastchilin, “Infrared Radiation of Earth in the Zones of Spreading and Riftogenesis (on the Examples of Afar Depression in North-East Africa),” Investigation of the Earth from Space, No. 3, 2006, pp.76-82.
- N. V. Vilor, S. A. Tashchilin, A. Kluchevsky, V. Demyanovich, A. Kuznetsova, O. Zarubina, V. A. Rusanov and Yu. D. Sharpinsky, “Remote Sensing in Investigating the Infrared Radiation Escaping from Regional Faults, and Its Geophysical and Geochemical Components,” Abstract of 33rd IGC International Geological Congress, Oslo, 6-14 August 2008.
- N. V. Vilor, V. A. Rusanov and Yu. D. Sharpinsky, “The Escaping Infrared Radiation Dynamic of Terrestrial Surface Geology Structure Elements in Survey Dates by NOOA and Terra Satellites”, Investigation of the Earth from Space, No 3, 2009, pp. 3-15.
- V. I. Gorny, I. S. Latypov, T. E. Tepliakova and E. Y. Voyakina, “Verification of Remote Geothermal Method Results at the Big Solovetskii Island While Investigation of Reasons of Extra Zonal Ecosystem Formation,” Actual Problems in Remote Sending of the Earth from Space, Proceedings of Institute of Space Research, Moscow, Vol. 6, No. 2, 2009, pp. 36-45.
- L. I. Morozova, “Detection of Linear Cloudy Anomalies above the Caspian Sea Faults Using Satellite Imagery,” Investigation of the Earth from Space, No. 2, 2005, pp. 27-30.
- F. A. Letnikov, “Synergetic of Geological Systems,” Novosibirsk, Science, 1992, p. 228.
- S. K. Atreya, A. S. Wong, K. H. Baines, M. H. Wong and T. C. Owen, “Jupiter’s Ammonia Clouds—Localized or Ubiquitous?” Planetary and Space Science, Vol. 53, No. 5, 2005, pp. 498-507. http://dx.doi.org/10.1016/j.pss.2004.04.002
- Paul D. Strycker, N. Chanover, M. Sussman and A. Simon-Miller, “A Spectroscopic Search for Jupiter’s Chromophores,” Bulletin of the American Astronomical Society, Vol. 38, 2006, p. 498.
- V. G. Kunde, et al., “Jupiter’s Atmospheric Composition from the Cassini Thermal Infrared Spectroscopy Experiment,” Science, Vol. 305, No. 5690, 2004, pp. 1582-1586. http://dx.doi.org/10.1126/science.1100240
- R. S. Lindzen, “Some Uncertainties with Respect to Water Vapor’s Role in Climate Sensitivity,” Proceedings of NASA Workshop on the Role of Water Vapor in Climate Processes, 29 October-1 November 1990, Eason, pp. 1 -12.
NOTES
*Corresponding author.