Optics and Photonics Journal
Vol.4 No.1(2014), Article ID:42230,6 pages DOI:10.4236/opj.2014.41002
Frequency Stabilized GaP Continuous-Wave Terahertz Signal Generator for High-Resolution Spectroscopy
1Research Institute of Electronics, Shizuoka University, Hamamatsu, Japan
2Institute of Multidisciplinary Research for Advanced Materials, Tohoku University, Sendai, Japan
3Semiconductor Research Institute, Sophia University, Tokyo, Japan
Email: *tsasaki@rie.shizuoka.ac.jp
Received November 12, 2013; revised December 9, 2013; accepted January 1, 2014
ABSTRACT
We constructed a GaP continuous-wave terahertz (CW-THz) signal generator based on different frequency generation that can tune automatically from 0.15 to 6.2 THz without mode-hopping. Independent frequency feedback control for the seed laser and power feedback control for the optical power amplifier realized higher accuracy and stability of the output THz-wave at the same time. After constructing THz spectrometer with the GaP CW-THz signal generator as a light source, we have confirmed frequency resolution to be 15 MHz by the measurement of the Doppler width of water vapor absorptions in vacuumed chamber, and frequency reproducibility to be within 5 MHz by comparing with absorption frequency data.
Keywords:Terahertz; Signal Generator; Spectrometer
1. Introduction
Infrared (IR) spectroscopy is one of the most common and widely used spectroscopic techniques for identification and quantitative analysis for organic materials. Absorption lines observed in Mid-IR range generally correspond to vibration modes of functional groups in a molecule. In contrast, absorption lines in terahertz (THz) or Far-IR frequency range correspond to skeletal modes in molecules or intermolecular modes in crystal. As these vibration modes are unique for each molecule and crystal, it is possible to identify material by observation of only a few absorption lines. Since these vibration modes are sensitive to crystal structure, THz absorption spectra are available to distinguish polymorphs [1] and to detect defects in crystals [2,3], for example. We observed slight frequency shifts of absorption lines in THz range depending on impurity doping or gamma-ray dose level. High frequency accuracy and resolution of THz spectrometer are essential for high sensitive detection of such defects. Widely frequency sweepable, monochromatic coherent THz light source must be ideal for such a spectrometer.
THz Time Domain Spectroscopy (TDS) is most commonly employed to obtain THz absorption spectra [4]. It is an excellent and convenient system composed with only room temperature operation devices. However, it is difficult to obtain high resolution, because it requires long gate time for signal processing of such a Fourier type system. Monochromatic CW THz wave could be also achieved using low-temperature-grown (LTG) GaAs as a photomixer [5-8] using two semiconductor lasers and proved to be useful for a high-resolution THz spectroscopy [9]. However, the frequency range is limited as the output power of the photomixer system has the maximum at around 100 GHz and shows exponential attenuation with increasing frequency.
We have developed wide frequency range, high power THz-wave signal generators (THz-SG) using Gallium Phosphide (GaP) crystal [10-12]. The principle was based on different frequency generation (DFG) between two infrared pulse beams via excitation of the phononpolariton mode under small-angle noncollinear phasematching conditions. In our first stage, nano-second pulse lasers were used to provide pump beams for DFG. Although wide tunable frequency range (0.3 - 7.5 THz) and high power (1.5 W, the maximum peak power) could be achieved, the frequency resolution was restricted to 500 MHz by Fourier transform limit. We also succeeded in developing a GaP Continuous Wave (CW)-THz SG in the same DFG method [13-16]. CW THz waves are superior to pulsed THz waves especially in terms of frequency resolution. However, frequency accuracy of the CW THz wave was not high because those of the pump laser beams were in free run mode. And still pump beam powers amplified by optical fiber amplifiers did not have enough stability against fine frequency sweep mainly because of interference at the power detector [16]. We have improved the resolution of a GaP CW-THz SG by stabilization of the pump laser frequency and power. We have applied the improved SG to high resolution spectrometer as a light source and evaluated the resolution and reproducibility by measuring water vapor absorption lines in vacuumed chamber.
2. Experimental Setup
Figure 1 shows a schematic of the THz spectrometer containing a GaP CW-THz SG as a light source. The basic configuration for THz DFG in GaP has been described previously [10-16]. Both the frequency fixed pump beam and frequency variable signal beam were delivered from a distributed feedback (DFB, Toptica DLDFB) laser and an external-cavity laser diode (ECLD, NewFocus Velocity). The wavelength of the ECLD
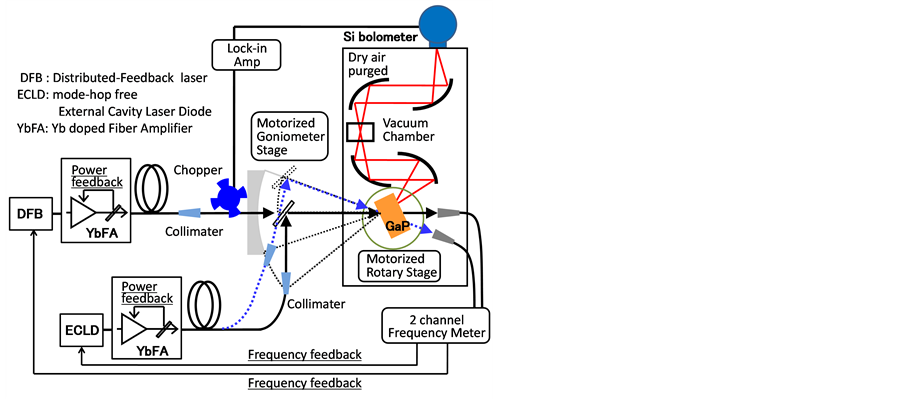
Figure 1. Schematic of the THz spectrometer using a GaP CW-THz SG. Frequencies were monitored by a two-channel wavelength meter and feedback controlled through a piezoelectric actuator for ECLD and current for DFB laser. Powers of two incident beam.
could be tuned from 1050 to 1074 nm (279.1 to 285.5 THz) without any mode-hopping by rotating a diffraction grating roughly with a motor actuator (20 pm resolution) and precisely with a piezoelectric actuator (better than 10 fm resolution). Such broad range mode-hopping free frequency tuning was obtained mainly by an excellent antireflection coating on the semiconductor laser crystal and by applying the Harvey-Myatt geometry in that the cavity length were continuously feedback controlled at each frequency [17]. The wavelength of the DFB laser could be tuned via the operation current and temperature from 1071.7 to 1074.4 nm (279.0 to 289.7 THz). Each beam was amplified by polarization-maintained ytterbium-doped optical fiber amplifiers (FA, FITEL HPU- 60217). The output powers were monitored by photodiodes and could be feedback controlled to be constant up to 5 W through current for pump lasers in FAs. Each of the two beams was focused to 300 μm diameter spot at the surface of the GaP crystal by collimator lens at the output fiber end of the FA. Also each of the wavelengths was monitored by a two-channel wavelength meter (HighFinesse, WS7) and feedback controlled through piezoelectric actuator for ECLD, and through current for DFB laser. Absolute accuracy of the wave meter is guaranteed to 60 MHz with frequent calibration by a standard wavelength. However the accuracy of generated THz frequency depends not on absolute accuracy but on relative accuracy for wavelength measurement of two IR beams, which is generally easier to obtain and estimated to be a few MHz. The polarizations of two beams were adjusted perpendicular to each other by tilting the fiber output, and they were then combined with a planer polarizer. To obtain high THz-wave output power with satisfying nonlinear phase-matching conditions, precise control of overlapping and small angle between the two beams inside the GaP crystal were required at each frequency. We could easily achieve the optimum phasematching condition by rotating only one stage by placing one of the fiber outputs on the gonio-meter stage and placing the GaP crystal at the center of rotation as shown in Figure 1. The GaP crystal had to be rotated to prevent total reflection from occurring at the back surface especially at higher frequencies. The generated THz wave travelled through four off-axis parabolic reflectors and was detected by a 4-K cooled Si bolometer. One of the incident beams was chopped at 187 Hz, and a lock-in amplifier was used for noise reduction to detect THzwave. As the THz-wave path depended on its frequency, samples were set at the THz-wave cross point as shown in the figure. The entire THz-wave path was purged by dry air of its dew point less than −50˚C to avoid the effects of water vapor absorption. A black polyethylene sheet was used as an IR cut filter.
3. Results and Discussion
3.1. Characteristic for GaP CW-THz Signal Generator
Figure 2(a) shows the THz power spectrum measured varying ECLD wavelengths from 1050 to 1072.72 nm in 20 pm steps. The frequencies were calculated from the wavelengths set and controlled at every sampling point. The general shape of the spectrum is almost the same as that of the THz SG we reported previously, because the shape was dominated mainly by the GaP crystal absorbance spectrum [16,18,19]. We confirmed THz power generation from 0.15 to 6.2 THz, when the DFB wavelength was set to 1073.3 nm. The lowest frequency is limited by THz output power reduction close to the noise level. And the highest frequency (6.2 THz) was limited by the tunable range of ECLD which can supply enough power for the safe operation of FA. We have to take care to operate FA in safe range, because if the injection-seed beam power decrease less than the amplified spontaneous emission (ASE) noise, the FA operation will become unstable and reach fracture in worst case.
Figure 2(b) shows the relation of THz output power and beam angle between two IR beams at 1.9469 THz. The phase-matching angle for this frequency was 0.2775 deg, and the phase-matching bandwidth, defined as the full width at half maximum (FWHM), was 0.165 deg. The phase-matching bandwidth was larger than that in
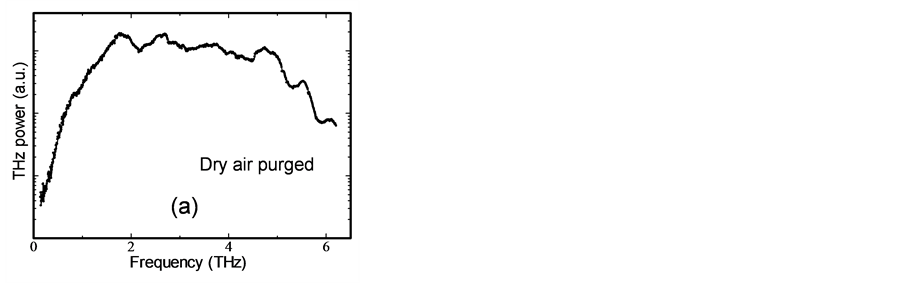
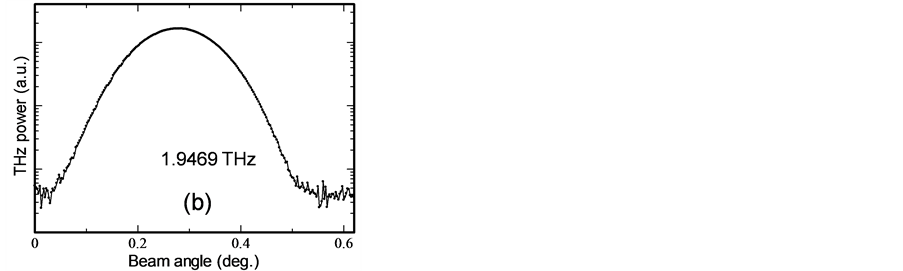
Figure 2. (a) Power spectrum of the GaP CW-THz SG. (b) THz output power near the phase-matching angle at 1.9469 THz.
our previous work (0.106 deg.) [15] probably because the beam divergences were larger due to the smaller beam diameter focused on the GaP crystal. Compared the maximum power with the noise floor level, the maximum S/N ratio was better than 500 with using Si bolometer as detector. We could also observe the THz power even by a pyro-electric deuterated L-alanine triglycine sulphate (DLATGS) detector operating at room temperature. However, it was not available for practical use, as the maximum S/N ratio did not exceed 10.
Figures 3(a) and (b) show the typical time dependences of frequencies for the DFB laser and ECLD without frequency feedback control. Although the DFB laser had large short-term fluctuation (standard deviation σ ~ 80 MHz), long-term drift was a few. In contrast, the shortterm fluctuation for the ECLD was a few MHz, although a long-term drift was large as 100 MHz for 1 hour.
Figures 3(c) and (d) show time dependences of frequencies for the DFB laser and ECLD with wavelength feedback control. Feedback period was 100 ms which was switching speed for two-channel wavelength meter. Standard deviations of fluctuation for ECLD and DFB were 1.34 and 5.84 MHz, and no long term drifts were observed at all.
Figure 4 shows the typical long-term stability of output THz power at 1.9469 THz with and without power
Figure 3. Typical time dependence of frequencies for ECLD (a) and DFB laser (b) without frequency feedback control, and for ECLD (c) and DFB laser (d) with frequency feedback control.
feedback controls for FAs. In the case of without power feedback controls, the pump lasers inside FAs were driven at constant current. The THz power fluctuations were below 0.3% and over 20% for with and without power feedback control. As the fluctuation amplitude for with feedback control was the same level as the dark noise, the noise was mainly due to the detection system rather than to fluctuations in the incident beam power. Independent controls at seed lasers for wavelengths and at FAs for powers enabled high stability and reproducibility for spectral measurement.
3.2. Measurement for Water Vapor Absorption in Vacuum
High accurate spectral measurements without complicated calibration are achieved by accurate frequency samplings at every point. Figure 5 shows a schematic diagram of water vapor absorption measurements in a vacuumed chamber. A vacuumed chamber, of which

Figure 4. Typical long-term stabilities of output THz power at 1.9469 THz with and without power feedback controls for FAs.
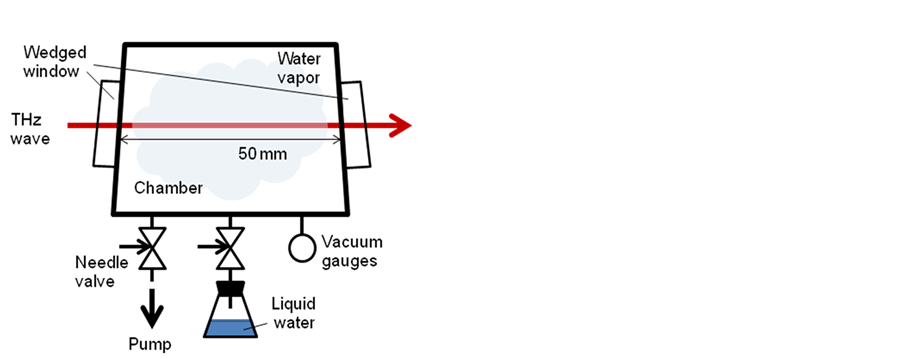
Figure 5. Schematic diagram of water vapor absorption measurement.
light path length is 50 mm, is used for gas absorption measurements. Windows are made of cycloolefin polymer (COP), having high transmittance for both visible light and terahertz-wave. Any surfaces of the two windows are not parallel to avoid interferometric fringes. A pressure monitored by a Pirani gauge is controlled by evacuation with a turbo molecular pump and injection of water vapor through needle valve connected to a vessel filled with pure water. Background pressure before water vapor introduction was bellow 10−3 Pa monitored by a Penning gauge. Figure 6 shows transmittance spectra for water vapor absorption at 5.107285 THz in the pressure range from 3 to 2 kPa. Measurement period was 10 fm, corresponding to ~2.7 MHz, which is minimum display resolution for the wavelength meter. The difference between our measurement and JPL database [20] (5.107281 THz) for the absorption line is about 4 MHz. Although the linewidth of the absorption was decreased with decreasing pressure at first, then the linewidth approached to constant value (~20 MHz) and only the absorption intensity was decreased below 80 Pa.
In the same procedure, transmittance spectra for water vapor absorption at 2.773985 and 1.097370 THz were measured with the parameter of pressure. Figure 7 shows
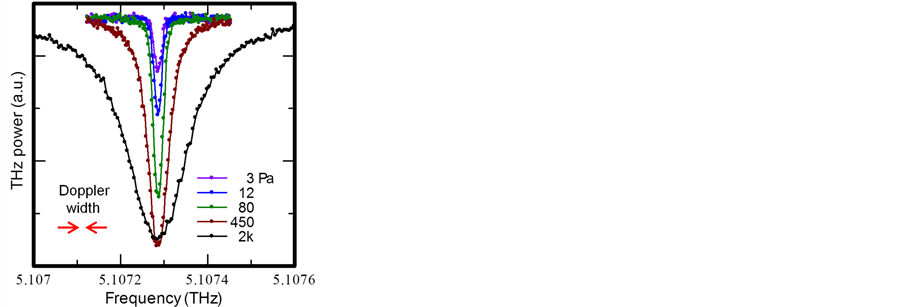
Figure 6. Transmittance spectrum of water vapor absorption at 5.107285 THz.
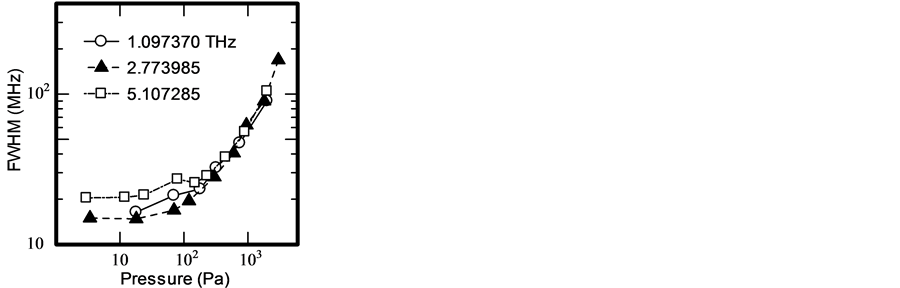
Figure 7. Pressure dependence of FWHM for water vapor absorptions at 1.097370, 2.773985, and 5.107285 THz.
pressure dependence of FWHM of three water vapor absorptions. FWHMs were evaluated by Gaussian fitting after converting the transmittance to the absorbance. At low pressure bellow 100 Pa, calculation fits well to measured spectra. This must be due to Lorentzian width is not effective at such low pressure. The differences between our measurements and JPL data (2.773977 THz and 1.097365 THz) for the absorption lines are about 8 and 5 MHz. The FWHM values for each absorption decrease with decreasing pressure and reaches to constant at lower pressure less than 100 Pa. Convergent values for the absorption at 1.097370 THz is unclear but below 16 MHz, and those for the absorption at 2.773985 THz and 5.107285 THz are 15 MHz and 21 MHz.
As only water molecules at low pressure existed in the chamber, Doppler linewidth ΔfD [21] caused by the velocity dispersion of molecules given by the Maxwell distribution is thought to be dominant and it can be described as,
 (1)
(1)
where, k: Boltzmann constant, T: temperature, m: molecular weight, c: speed of light, and fa: absorption frequency. The Doppler widths at 295 K for 1.097370 THz, 2.773985 THz, and 5.107285 THz are 3.2 MHz, 8.0 MHz, and 14.8 MHz, respectively. The FWHM limit ΔfFWHM arising from the frequency fluctuations of ECLD (standard deviation σ = 1.34 MHz) and DFB laser (σ = 5.84 MHz) can be estimated with assuming as Gaussian distribution,
 (2)
(2)
to be 3.2 MHz and 13.8 MHz. ΔfD values for absorption at 1.097370 THz, 2.773985 THz are close to the sum of ΔfFWHM for ECLD and DFB laser (17.0 MHz). However, ΔfD values for absorption at 5.107285 THz had larger value. From these evaluations, the measured minimum FWHMs were thought to be limited by the hardware at lower frequency, whereas the Doppler width seems to affect a little at higher frequency. Frequency resolution of our spectrometer is estimated to be 15 MHz at present, and can be improved more by reducing frequency fluctuations of the pump lasers.
4. Conclusion
We improved the power and frequency stabilities of wide-frequency-range high-resolution GaP CW-THz SG. The long-term power stability became below 0.3% by employing the power feedback control at fiber amplifiers. The frequency resolution was improved to 15 MHz by frequency feedback control using a two-channel wavelength meter. This value is more than 30 times better than that obtained by the GaP THz SGs pumped with nanosecond pulsed lasers. The continuous frequency range for the GaP CW-THz SG expanded to be from 0.15 to 6.2 THz. High reproducibilities in both frequency and power range made high-resolution THz spectroscopy possible. Such high accurate spectroscopy is now ready to observe slight frequency shifts of absorption lines caused by defects in crystals.
Acknowledgements
The authors are grateful to Mr. J. Shibata (Terahertz laboratory, Co. Ltd.) for valuable discussion. This work was partly supported by Grants-in-Aid for Scientific Research (C) (No. 24550214) from the Japan Society for the Promotion of Science (JSPS).
REFERENCES
- P. F. Taday, I. V. Bradley, D. D. Arnone and M. Pepper, “Using Terahertz Pulse Spectroscopy to Study the Crystalline Structure of a Drug: A Case Study of the Polymorphs of Ranitidine Hydrochloride,” Journal of Pharmaceutical Sciences, Vol. 92, No. 4, 2003, pp. 831-838. http://dx.doi.org/10.1002/jps.10358
- J. Nishizawa, K. Suto, T. Sasaki, T. Tanabe, T. Tanno, Y. Oyama and F. Sato, “GaP Raman Terahertz High Accuracy Spectrometer and Its Application to Detect Organic and Inorganic Crystalline Defects,” Proceedings of the Japan Academy, Series B, Vol. 82, No. 9, 2006, pp. 353- 358. http://dx.doi.org/10.2183/pjab.82.353
- J. Nishizawa, T. Sasaki, K. Suto, M. Ito, T. Yoshida and T. Tanabe, “High-Resolution GaP Terahertz Spectrometer and Its Application to Detect Defects in G-Irradiated Glucose Crystal,” International Journal of Infrared and Millimeter Waves, Vol. 29, No. 3, 2008, pp. 291-297. http://dx.doi.org/10.1007/s10762-007-9322-9
- D. A. Auston, K. P. Cheung and P. R. Smith, “Picosecond Photoconducting Hertzian Dipoles,” Applied Physics Letters, Vol. 45, No. 3, 1984, pp. 284-286. http://dx.doi.org/10.1063/1.95174
- E. R. Brown, K. A. McIntosh, K. B. Nichols and C. L. Dennis, “Photomixing up to 3.8 THz in Low-Temperature Grown,” Applied Physics Letters Vol. 66, No. 3, 1995, pp. 285-287. http://dx.doi.org/10.1063/1.113519
- K. A. McIntosh, E. R. Brown, K. B. Nichols, O. B. McMahon, W. F. DiNatale and T. M. Lyszczarz, “Terahertz Photomixing with Diode Lasers in Low-Temperature-Grown GaAs,” Applied Physics Letters, Vol. 67, No. 26, 1995, pp. 3844-3846. http://dx.doi.org/10.1063/1.115292
- S. Matsuura, M. Tani and K. Sakai, “Generation of Coherent Terahertz Radiation by Photomixing in Dipole Photoconductive Antennas,” Applied Physics Letters, Vol. 70, No. 5, 1997, pp. 559-561. http://dx.doi.org/10.1063/1.118337
- A. J. Deninger, T. Göbel, D. Schönherr, T. Kinder, A. Roggenbuck, M. Köberle, F. Lison, T. Müller-Wirts and P. Meissner, “Precisely Tunable Continuous-Wave Terahertz Source with Interferometric Frequency Control,” Review of Scientific Instruments, Vol. 79, No. 4, 2008, Article ID: 044702. http://dx.doi.org/10.1063/1.2905033
- S. Matsuura, M. Tani, H. Abe, K. Sakai, H. Ozeki and S. Saito, “High-Resolution Terahertz Spectroscopy by a Compact Radiation Source Based on Photomixing with Diode Lasers in a Photoconductive Antenna,” Journal of Molecular Spectroscopy, Vol. 187, No. 1, 1998, pp. 97-101.
- T. Tanabe, K. Suto, J. Nishizawa, T. Kimura and K. Saito, “Frequency-Tunable High-Power Terahertz Wave Generation from GaP,” Journal of Applied Physics, Vol. 93, No. 8, 2003, pp. 4610-4615. http://dx.doi.org/10.1063/1.1560573
- T. Tanabe, K. Suto, J. Nishizawa, K. Saito and T. Kimura, “Frequency-Tunable Terahertz Wave Generation via Excitation of Phonon-Polaritons in GaP,” Journal of Physics D: Applied Physics, Vol. 36, No. 8, 2003, pp. 953-957. http://dx.doi.org/10.1088/0022-3727/36/8/302
- T. Tanabe, K. Suto, J. Nishizawa, K. Saito and T. Kimura, “Tunable Terahertz Wave Generation in the 3- to 7-THz Region from GaP,” Applied Physics Letters Vol. 83, No. 2, 2003, pp. 237-239. http://dx.doi.org/10.1063/1.1592889
- J. Nishizawa, T. Tanabe, K. Suto, Y. Watanabe, T. Sasaki and Y. Oyama, “Continuous-Wave Frequency-Tunable Terahertz-Wave Generation from GaP,” IEEE Photonics Technology Letters, Vol. 18, No. 19, 2006, pp. 2008-2010. http://dx.doi.org/10.1109/LPT.2006.882278
- S. Ragam, T. Tanabe, K. Saito, Y. Oyama and J. Nishizawa, “Enhancement of CW THz Wave Power under NonCollinear Phase-Matching Conditions in DFG,” Journal of Lightwave Technology, Vol. 27, No. 15, 2009, pp. 3057-3061. http://dx.doi.org/10.1109/JLT.2009.2022340
- T. Tanabe, S. Ragam and Y. Oyama, “CW THz Wave Spectrometer Based on Diode Laser Pumping: Potential Applications in High Resolution Spectroscopy,” Review of Scientific Instruments Vol. 80, No. 11, 2009, Article ID: 113105. http://dx.doi.org/10.1063/1.3258202
- T. Sasaki, J. Nishizawa and T. Tanabe, “Wide Frequency Range High Resolution THz Spectroscopy with Using Continuous-Wave GaP Terahertz Signal Generator and Its application to Defect Detection,” Proceedings of 35th International Conference on Infrared, Millimeter and Terahertz Waves (IRMMW-THz 2010), Rome, 5-10 September 2010, pp. 1-3. http://dx.doi.org/10.1109/ICIMW.2010.5612648
- K. C. Harvey and C. J. Myatt, “External-Cavity Diode Laser Using a Grazing-Incidence Diffraction Grating,” Optics Letters, Vol. 16, No. 12, 1991, pp. 910-912. http://dx.doi.org/10.1364/OL.16.000910
- J. Nishizawa, K. Suto, T. Sasaki, T. Tanabe and T. Kimura, “Spectral Measurement of Terahertz Vibrations of Biomolecules Using a GaP Terahertz-Wave Generator with Automatic Scanning Control,” Journal of Physics D: Applied Physics, Vol. 36, No. 23, 2003, pp. 2958-2961. http://dx.doi.org/10.1088/0022-3727/36/23/015
- K. Suto, T. Sasaki, T. Tanabe, K. Saito, J. Nishizawa and M. Ito, “GaP THz-Wave Generator and THz Spectrometer Using Cr:Forsterite Lasers,” Review of Scientific Instruments, Vol. 76, No. 12, 2005, Article ID: 123109. http://dx.doi.org/10.1063/1.2140223
- H. M. Pickett, R. L. Poynter, E. A. Cohen, M. L. Delitsky, J. C. Pearson and H. S. P. Muller, “Submillimeter, Millimeter, and Microwave Spectral Line Catalog,” Journal of Quantitative Spectroscopy and Radiative Transfer, Vol. 60, No. 5, 1998, pp. 883-890. http://dx.doi.org/10.1016/S0022-4073(98)00091-0
- L. Galatry, “Simultaneous Effect of Doppler and Foreign Gas Broadening on Spectral Lines,” Physical Review, Vol. 122, No. 4, 1961, pp. 1218-1223. http://dx.doi.org/10.1103/PhysRev.122.1218
NOTES
*Corresponding author.