Journal of Surface Engineered Materials and Advanced Technology
Vol.3 No.1(2013), Article ID:27316,7 pages DOI:10.4236/jsemat.2013.31002
Optimization Conditions for Single-Walled Carbon Nanotubes Dispersion
![]()
1Department of Chemistry, Beijing University of Chemical Technology, Beijing, China; 2National Institute of Metrology, Beijing, China; 3Beijing University of Science and Technology, Beijing, China.
Email: *renll@nim.ac.cn, *lidq@mail.buct.edu.cn
Received October 30th, 2012; revised November 30th, 2012; accepted December 6th, 2012
Keywords: Single-Walled Carbon Nanotubes (SWCNTs); Sodium Dodecyl Sulphate (SDS); UV-vis-NIR Absorption Spectra; Concentration; Sonication Temperature; Sonication Time
ABSTRACT
The sonication-driven dispersion of single-walled carbon nanotubes (SWCNTs) in aqueous surfactant solution has been monitored by UV-vis-NIR spectroscopy and scanning electron microscopy. Dispersion of SWCNTs experiments reveal that the maximum concentration of dispersed SWCNTs corresponds to the maximum UV-vis-NIR absorbance of the solution. With higher surfactant concentration the dispersion rate of SWCNTs increases and low temperature sonication is required to achieve maximum dispersion. Dispersion of higher SWCNT concentrations requires longer sonication time. For effective dispersion the optimal concentration of surfactant is 1.5 wt%, the concentration of SWCNTs that can be homogeneously dispersed in aqueous solution is about 0.4 mg/ml.
1. Introduction
Single-walled carbon nanotubes (SWCNTs) have attracted considerable attention of researchers over the past decade because of their specific physical, chemical and mechanical properties [1-3]. However, because the carbon nanotubes are inorganic polymers of a highly polarized smooth surface there is a strong van der Waals force between the tube combined with its huge surface area and high aspect ratio, resulting in carbon nanotubes very easily wound reunion into a bundle, and the surface of carbon nanotubes lack of active groups, and insoluble in common organic solvents and water, which greatly limits the application of carbon nanotubes [4,5]. Therefore, the effective dispersion of carbon nanotubes has become the focus of the present research.
Now significant research efforts have already been devoted to improve the dispersion of carbon nanotubes. The main route available to enhance carbon nanotubes solubility in solvents and other matrix material in the dispersion of carbon nanotubes modified. By far, many kinds of surfactants (anionic, cationic, non-ionic) have been used to disperse carbon nanotubes. e.g. sodium deoxycholate(DOC) [6], sodium dodecyl benzenesulfate (SDBS) [7], sodium dodecyl sulphate (SDS) [8] and a family of Tween surfactants [9]. The dispersion of SWCNTs in solution can be studied by atomic force microscopy (AFM) [10,11], Raman spectros-copy [12-14], scanning electron microscopy [15,16], cryogenic transmission electron microscopy (cryo-TEM) [17]. However, there is no report about a reference to indicate the dispersion. In fact, we often need a simple technology in real producing. Moreover, UV-vis-NIR spectroscopy offers a more precise method for detecting dispersion of individual nanotubes [18]. In the UV-vis-NIR region, Individual SWNTs exhibit characteristic bands corresponding to additional absorption due to 1D van Hove singularities [19]. Bundled SCNTs are hardly active in the wavelength region between 200 - 1200 nm because of carrier are tunneling between the nanotubes [20]. Moreover, researchers have reported that the absorbance of SWCNTs solutions shows a maximum between 200 and 300 nm and gradually decreases from UV to near-IR. Therefore, it is possible to establish a relationship between the concentration of SWCNTs individually dispersed in solution and the intensity of the corresponding absorption spectrum.
In this paper, we will emphasis on the research of setting up an UV-vis-NIR absorbance to evaluate the dispersion effect, and also use it as reference to find the optimum conditions of SWCNTs dispersed in surfactant solutions.
2. Experiments
SWCNTs (>80 wt%) were obtained from Sigma-Aldrich. (Hipco, Sigma-Aldrich, 0.7 - 1.1 nm). The surfactant for the dispersion of the SWCNTs was sodium dodecyl sulfate (SDS; 99%) provided by Sigma-Aldrich. All dispersion experiments were carried out with distilled water. All solutions were prepared by mixing a certain amount of SWCNTs with 10 mL of an aqueous SDS solution in a flask, after which the resulting mixture was sonicated for different times under mild conditions.Then the dispersed sample solution was centrifuged at 17,000 g for 15 min in a swing bucket rotor (S52ST, Hitachi KoKi) to remove the bundles, and the residue of catalytic metal particles. The upper 80% of the supernatant was collected and used for measurement.Then we take same amount (5 ml) of SWCNTs solution diluted to different times (0.5, 0.7, 0.9, 1.0, 1.3, 1.5, 1.7, 3, 5, 7, 9), and measurement the UVvis-NIR spectroscopy of these dilutied SWCNTs solutions.
UV-vis-NIR absorption spectra (Lambda900, PerkinElmer) were recorded with spectrometer operating between 200 and 1100 nm. Samples were taken regularly during the sonicating process and diluted by a certain factor, resulting in certain SWCNT contents that were suitable for UV-vis measurements. The blank used was the original SDS solution diluted by the same factor, under the same conditions as the samples themselves. SEM (Zeiss, Supra55) images were recorded by Signal A = InLens mode and D = 4.7 mm, EHT = 5.00 kV, Mag = 5.00 KX. Trans-mission electron microscopy (TEM) observations of SWCNT dispersions were performed using a Tecnai 20 (FEI Co.) operated at 200 kV.
3. Results and Discussions
3.1. Relationship between UV-vis-NIR Spectra and Concentrations of Dispersed SWCNTs
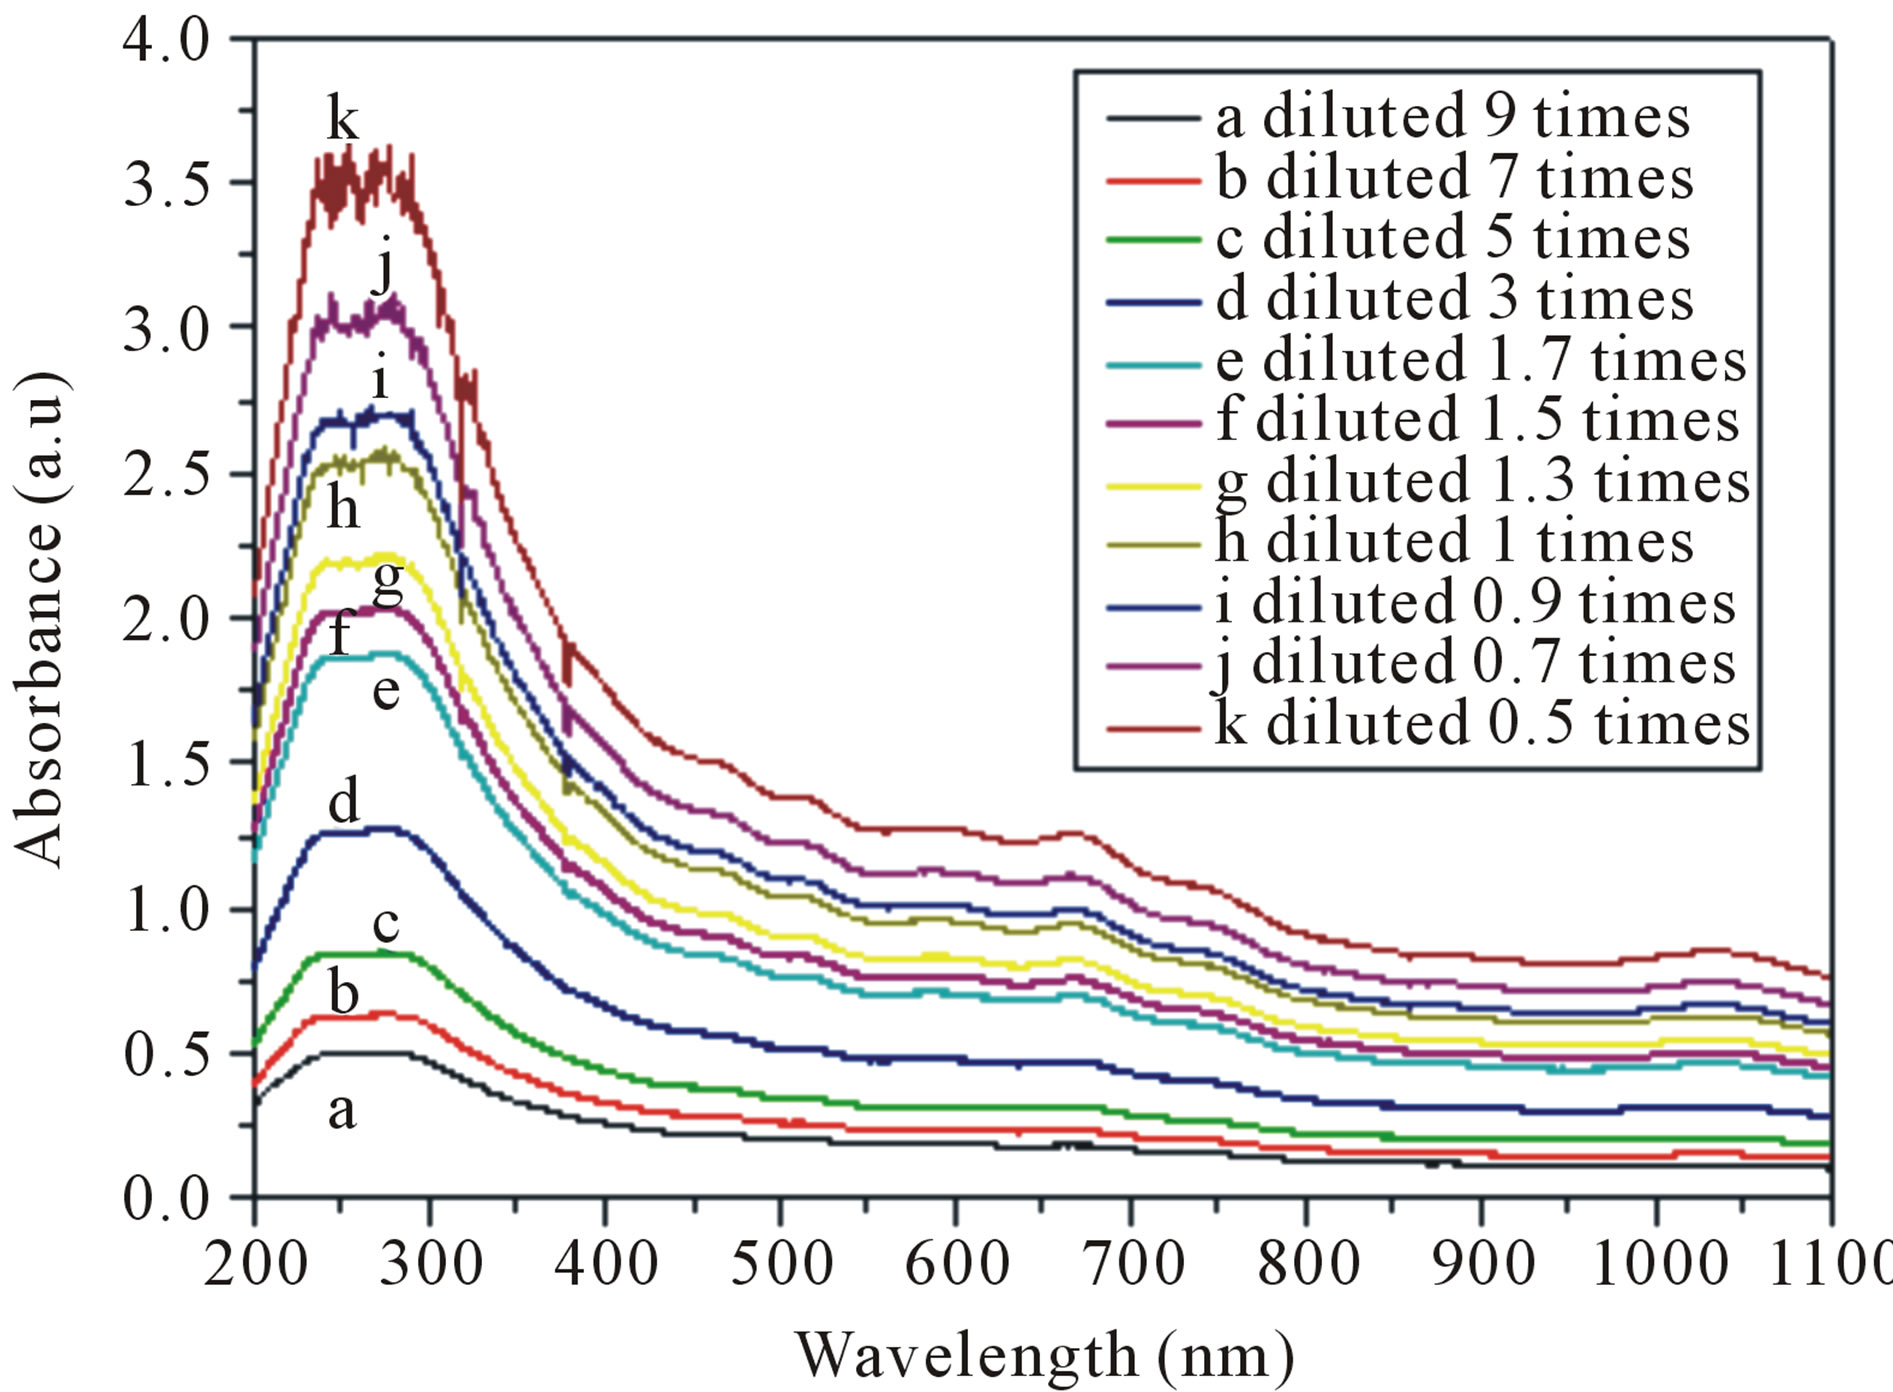
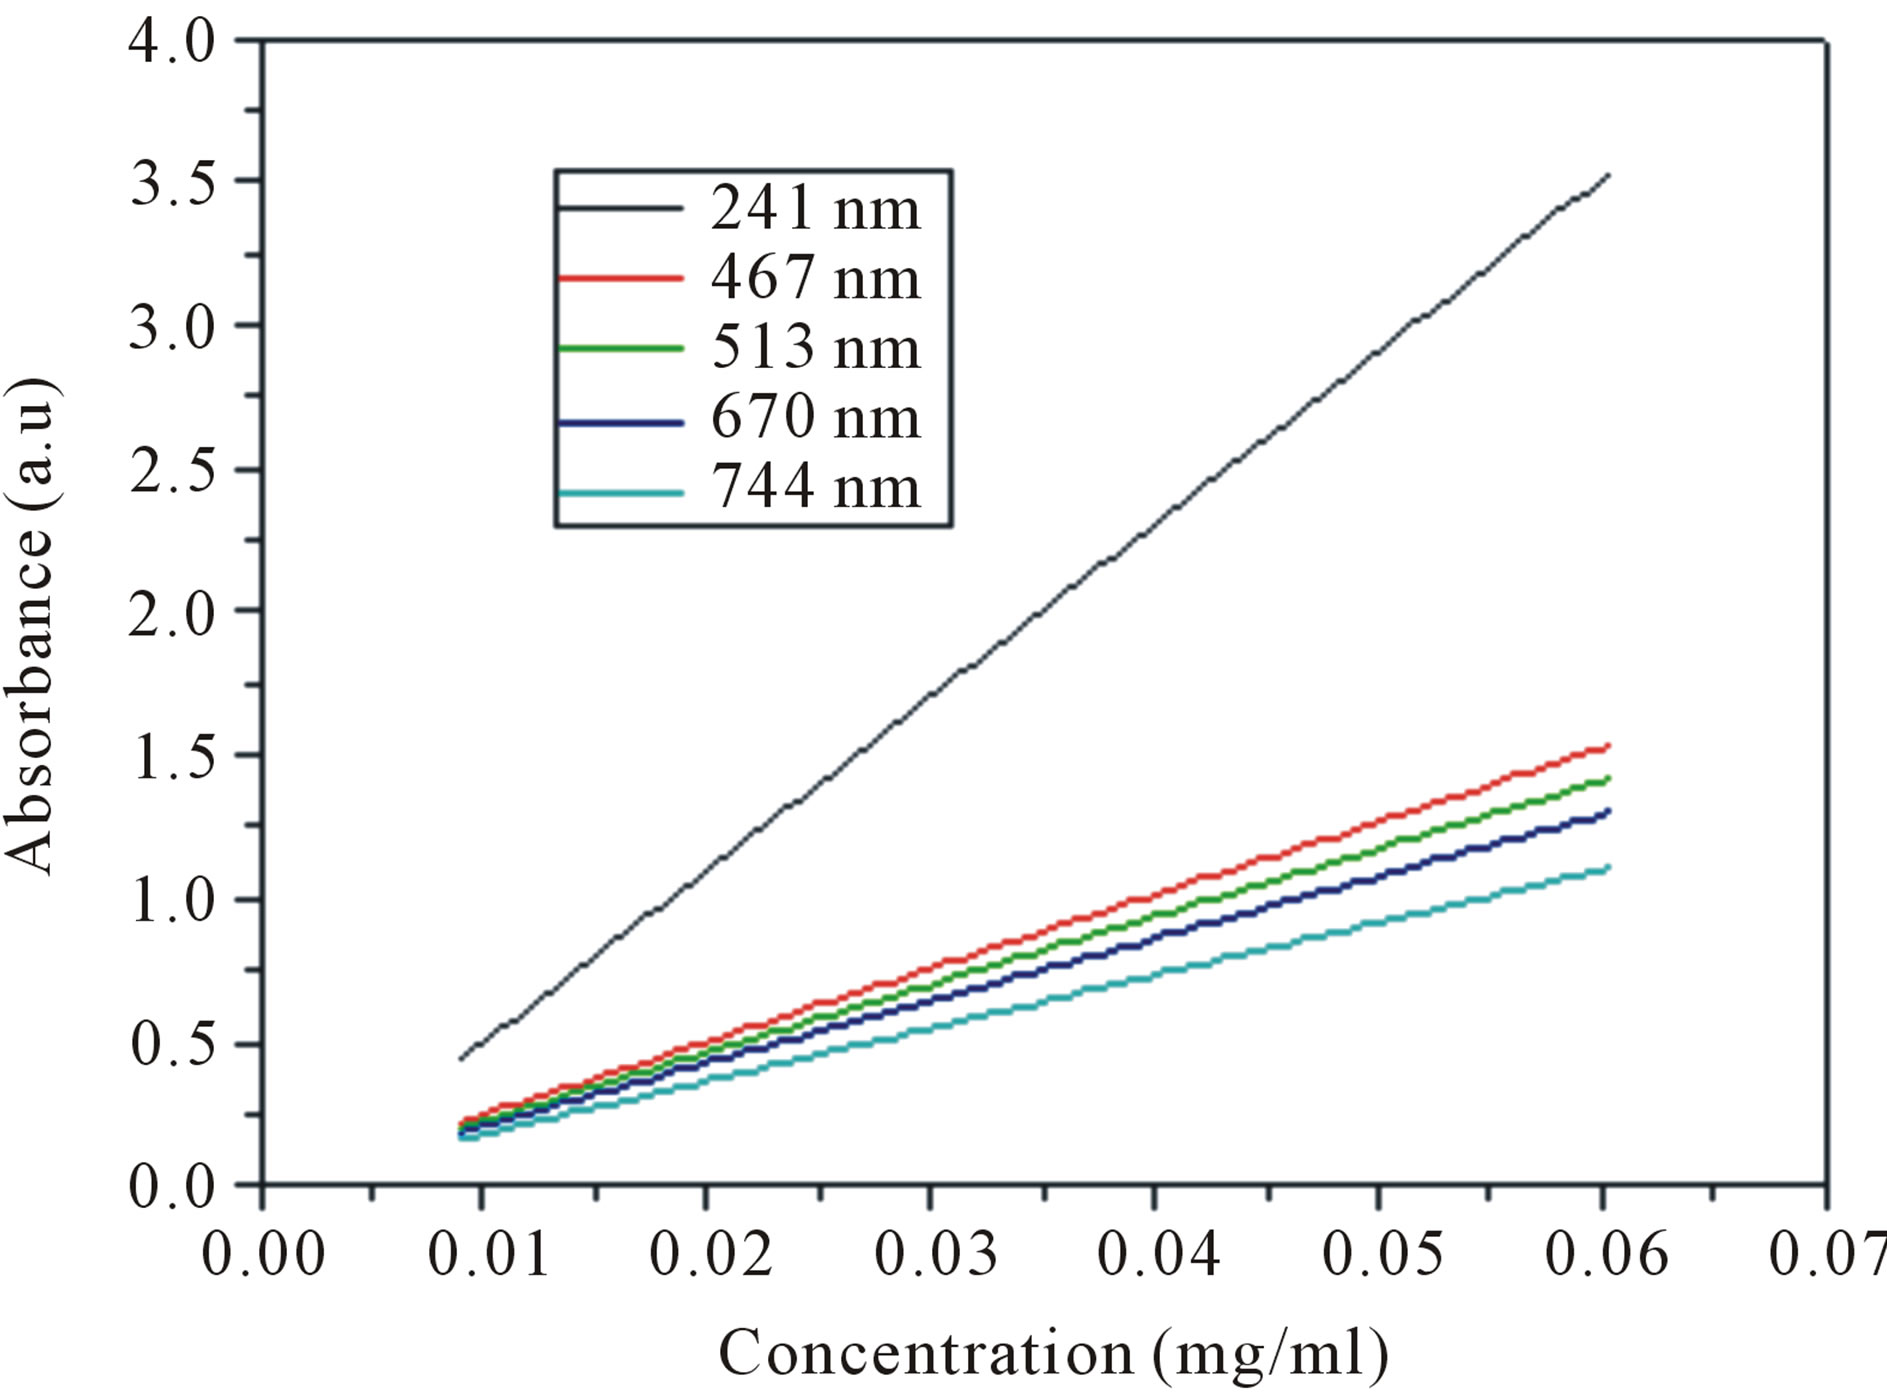
Figure 1(A) illustrates UV-vis-NIR spectra of SWCNTs dispersed in solutions with different dilutions. As show in Figure 1(A), increasing concentration of dispersed SWCNTs results in an increasing absorbance intensities. In order to understand the relationship between the intensities of the whole spectra range and the dispersion concentrations of SWCNTs, we calculate the SWCNTs concentration by subtracting the surfactant weight from the total dry weight of the supernatant, then we measured a series UV-vis-NIR spectra of different concentrations of carbon nanotubes, and measured the corresponding absorbance intensities at different wavelengths. Finally the plots of intensity and concentration are obtained as shown in Figure 1(B). Any wavelength within the UVvis-NIR range from 200 to 1100 nm displayed linear relationship between the absorbance intensities and dispersed SWCNTs concentrations. All of intensities at different wavelength increased with the increasing of the dispersed SWCNTs concentrations, but the slopes were
(A)
(B)
Figure 1. (A) Evolution of UV-vis-NIR spectra of an aqueous 0.3 mg/ml SWCNTs—1.5 wt% SDS solution as a function of diluted times. (a: diluted 9 times; b: diluted 7 times; c: diluted 5 times; d: diluted 3 times; e: diluted 1.7 times; f: diluted 1.5 times; g: diluted 1.3 times; h: diluted 1 times; i: diluted 0.9 times; j: diluted 0.7 times; k: diluted 0.5 times). (B) Calibration curves determining the true concentration of SWCNTs in aqueous dispersions with different wavelength.
different indicating that the SWCNTs concentration had different affections on the absorbance at different wavelengths. When the wavelength is 241 nm, the slope was the biggest, while the slope was the smallest when the wavelength is 744 nm, which indicated that the spectrum absorbance was sensitive to the dispersed SWCNTs concentrations in the UV wavelength range. So the UV-visNIR absorbance intensity at 241 nm in the following experiments was chosen as reference for the estimation of the dispersed SWCNTs concentration.
3.2. Optimal Original Concentrations of SWCNTs Dispersed
The initial concentrations of the carbon nanotubes is the total amount of the carbon nanotubes added to the SDS solution, and the carbon nanotubes cannot be fully dispersed to the solution. The purpose of this experiment is by studying different dispersing effect of the initial concentration of carbon nanotubes, to determine an optimal initial amount of carbon nanotubes in the solution. Figure 2 shows the UV-visible spectra of dispersed different original concentrations of SWCNTs in aqueous (1.5 wt%) SDS solution. As show in Figure 2, the carbon nanotube concentration is higher, the absorption intensity is stronger. When the concentration of the carbon nanotubes is 0.4 mg/ml, the absorption intensity is the highest. The concentration of carbon nanotubes continues to increase, the absorption intensity began to decline. In other words, the best dispersion of the SWCNTs is 0.4 mg/ml. The results indicate that when the SDS concentrations of certain circumstances, increase the quantity of the carbon nanotubes can enhance the dispersing effect, but when the concentration of the carbon nanotubes reach a certain degree, continue to increase the number of the carbon nanotubes, carbon nanotubes has been dispersed in the solution will make reunited, reduced the dispersion effect.
3.3. Optimization of Surfactant Concentration for SWCNTs Dispersion
We investigated the effects of different SDS concentrations on SWCNTs dispersion as show in Figure 3. As the results, increasing the concentration of SDS, the absorbance intensity reaches a plateau value, when the concentration of SDS is 1.5 wt%, the absorption intensity is the highest. In order to visualize the dispersion state of SWCNTs in different concentration of SDS solutions,
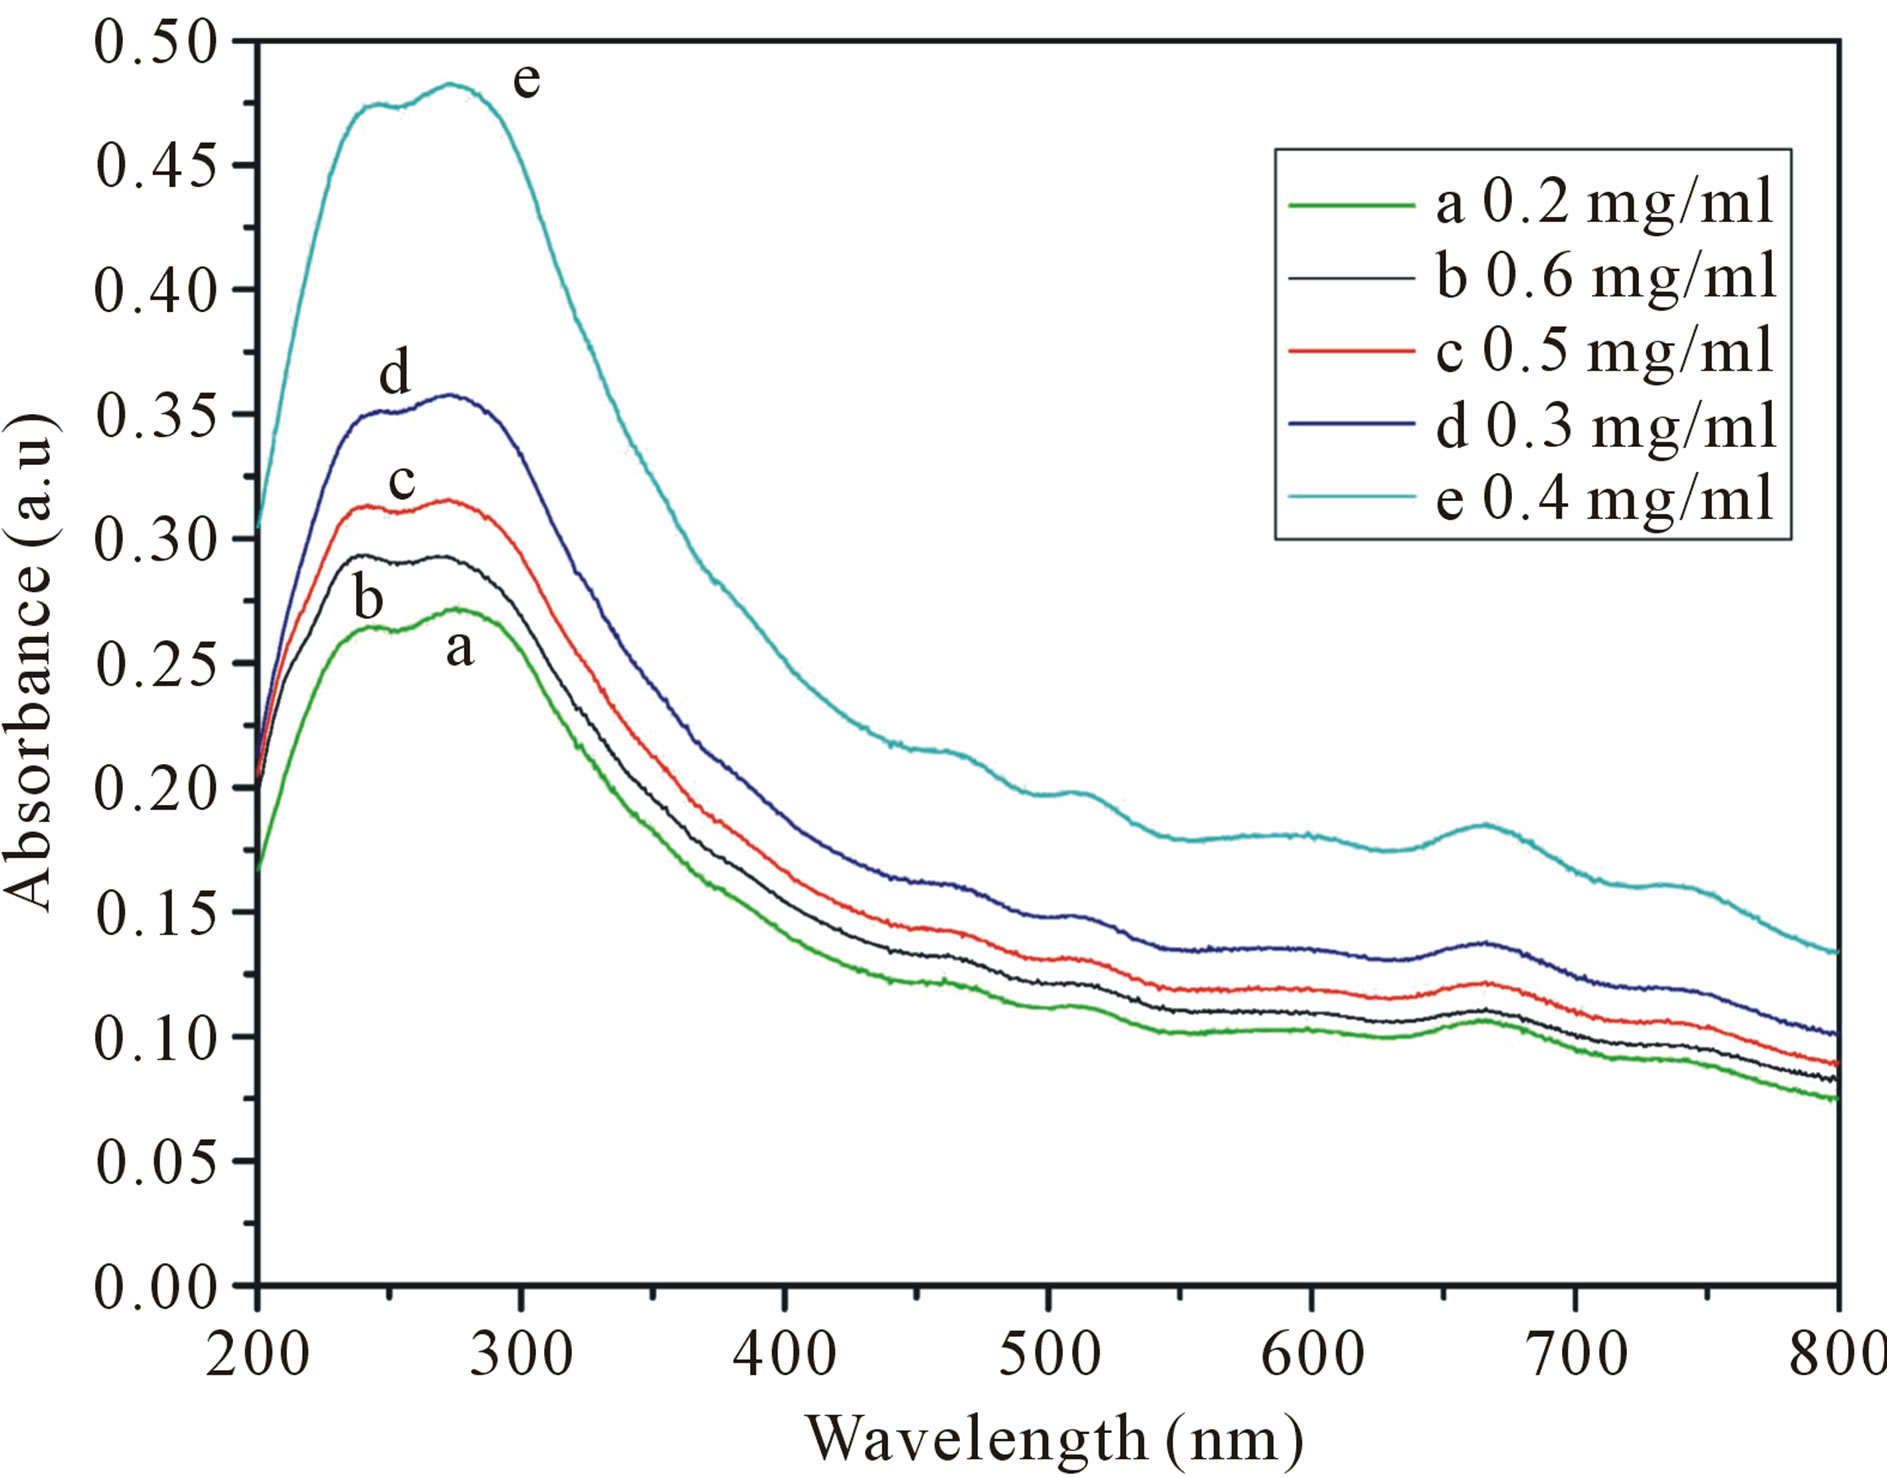
Figure 2. UV-vis-NIR spectra of different concentrations of SWCNTs in 1.5 wt% SDS solution. (a: 0.2 mg/ml; b: 0.6 mg/ml; c: 0.5 mg/ml; d: 0.3 mg/ml; e: 0.4 mg/ml). The solutions are diluted by a factor of 10 when taking UV-vis-NIR measurements.
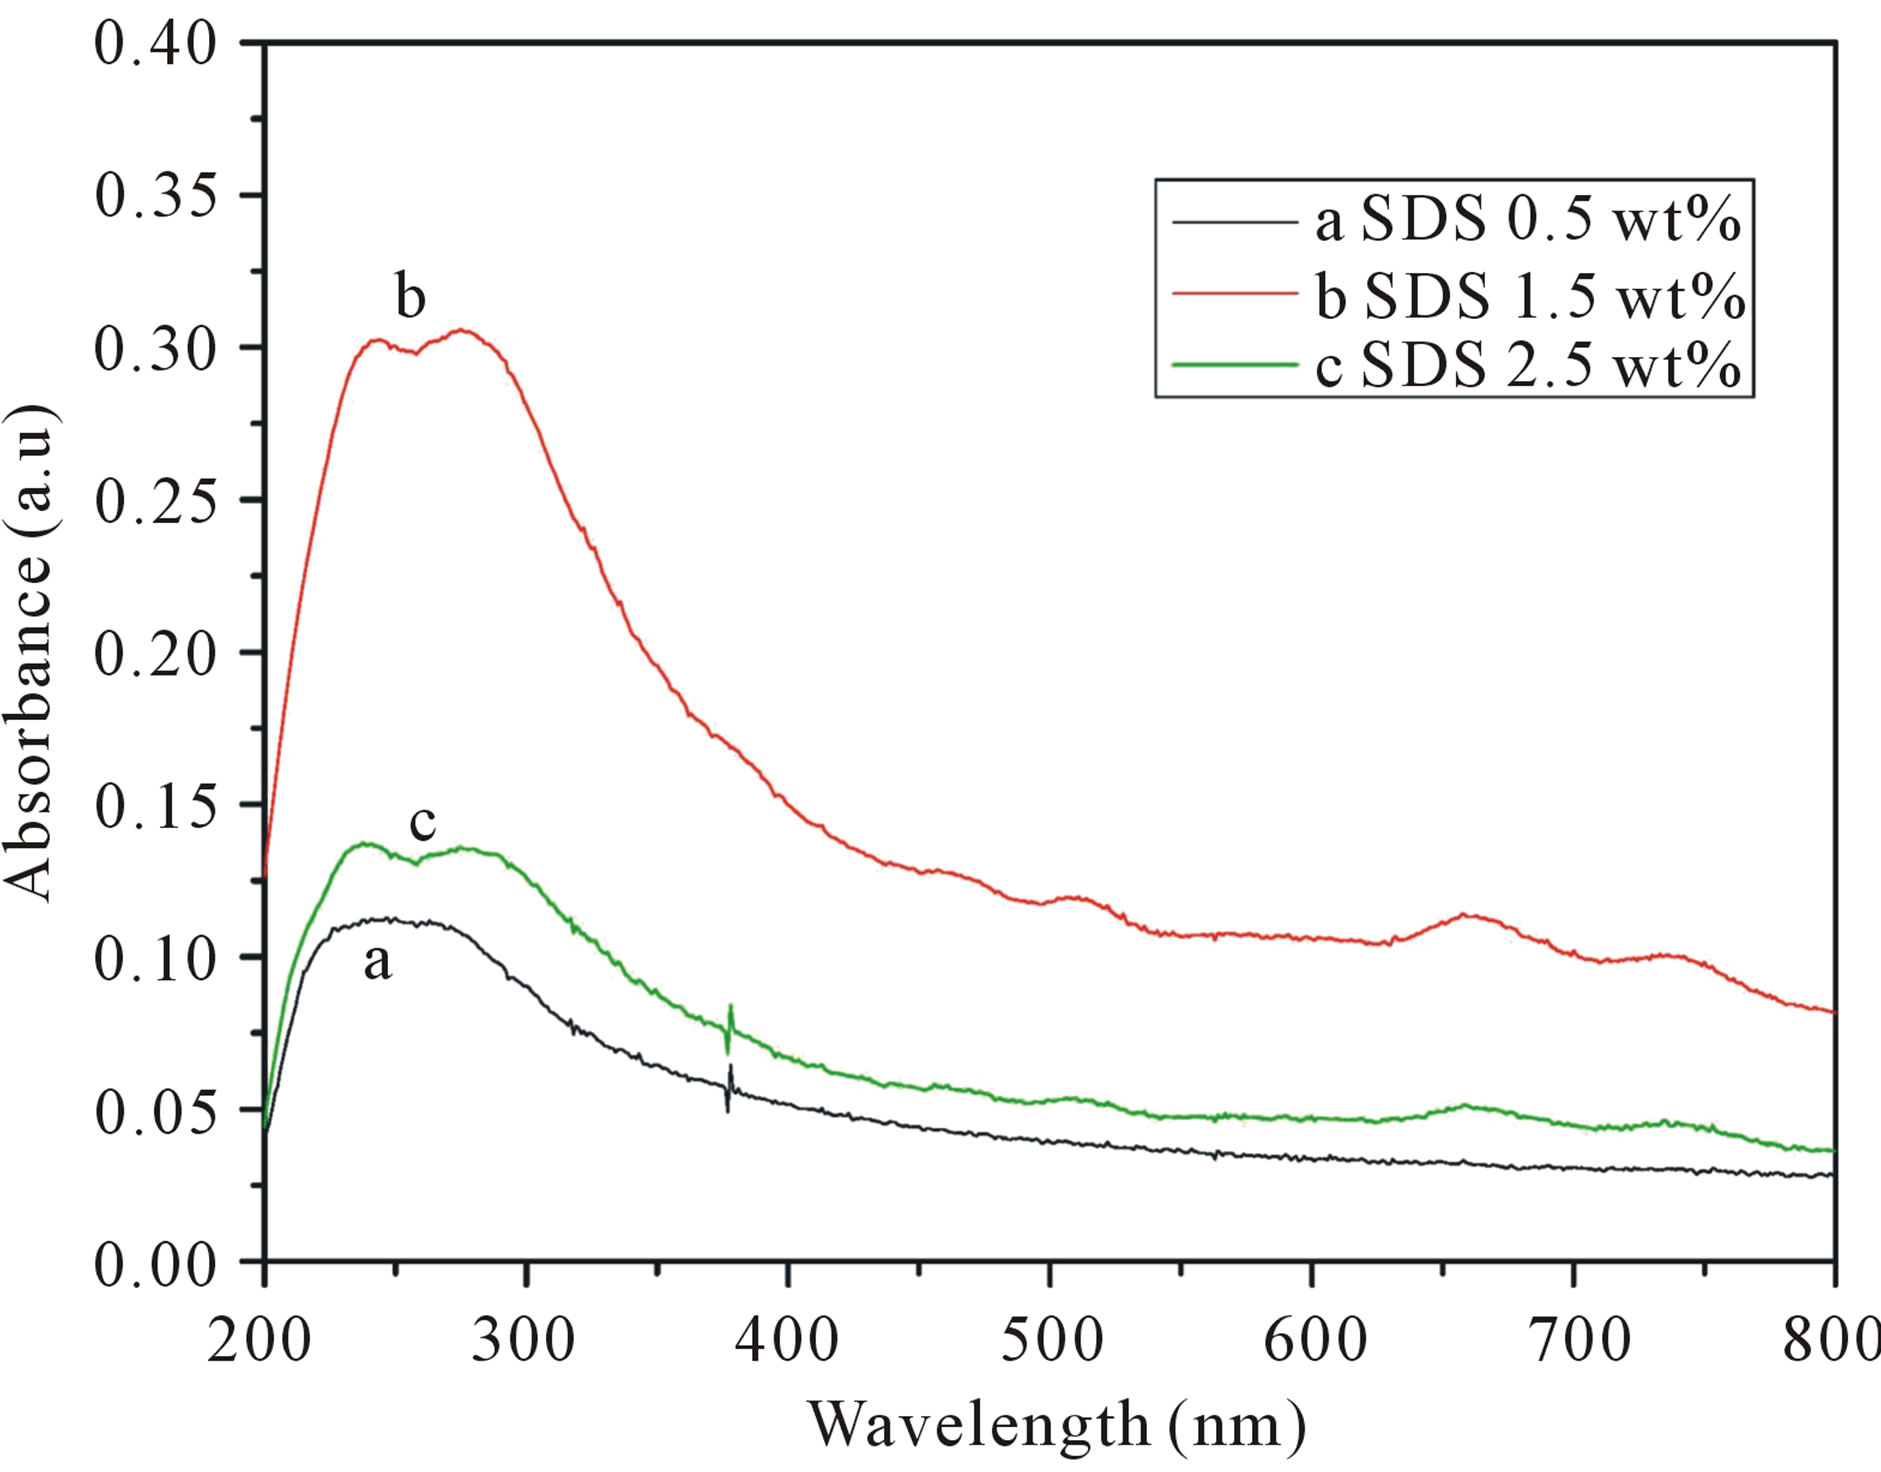
Figure 3. UV-vis-NIR spectra of different SDS concentrations on SWCNTs dispersion. (a: 0.5 wt% SDS; b: 1.5 wt% SDS; c: 2.5 wt% SDS). The solutions are diluted by a factor of 10 when taking UV-vis-NIR measurements.
SEM investigations have been performed to support the interpretation of the UV-vis-NIR results. As show in Figure 4, dispersing SWCNTs in 0.5 wt% or 2.5 wt% SDS solutions, only a small amount of SWCNTs is exfoliated. This corresponds to the low absorption in the UVvis-NIR spectrum, as shown in Figure 3. When the SWCNTs are dispersed in 1.5 wt% SDS solutions, many SWCNTs are exfoliated. The utmost dispersion of SWCNTs in solution cannot be achieved at lower or higher SDS solutions. Because surfactant adsorption at the interface enriched monomolecular layer, when the surface adsorption reaches saturation, the surfactant molecules at the surface cannot continue enrichment, and the hydrophobic interaction of the hydrophobic group is still vigorously promote based molecules to escape from the water environment, so the surfactant molecules in the inside of the concentrated solution self-polymerization, forming the simple micelles. And begin to form micelles when the concentration of the surfactant called the critical micelle concentration. So at lower SDS solutions, the SDS is not enough to coat on the surface of the SWCNTs to prevent re-aggregation, at higher SDS solutions, when the surfactant concentration is too high, it exceeds the critical micelle concentration, so that the large number of surfactant to form micelles, cannot be sufficiently dispersed carbon nanotubes. Then sufficient surfactant is required to produce an efficient coating on the surface of the SWCNTs to prevent re-aggregation. In our work the optimal concentrations of SDS is 1.5 wt%.
3.4. Effects of Sonication Time on SWCNTs Dispersion
We investigated the effects of sonication time on SWCNTs dispersion. UV-vis-NIR spectra of SWCNT-
 (a)
(a)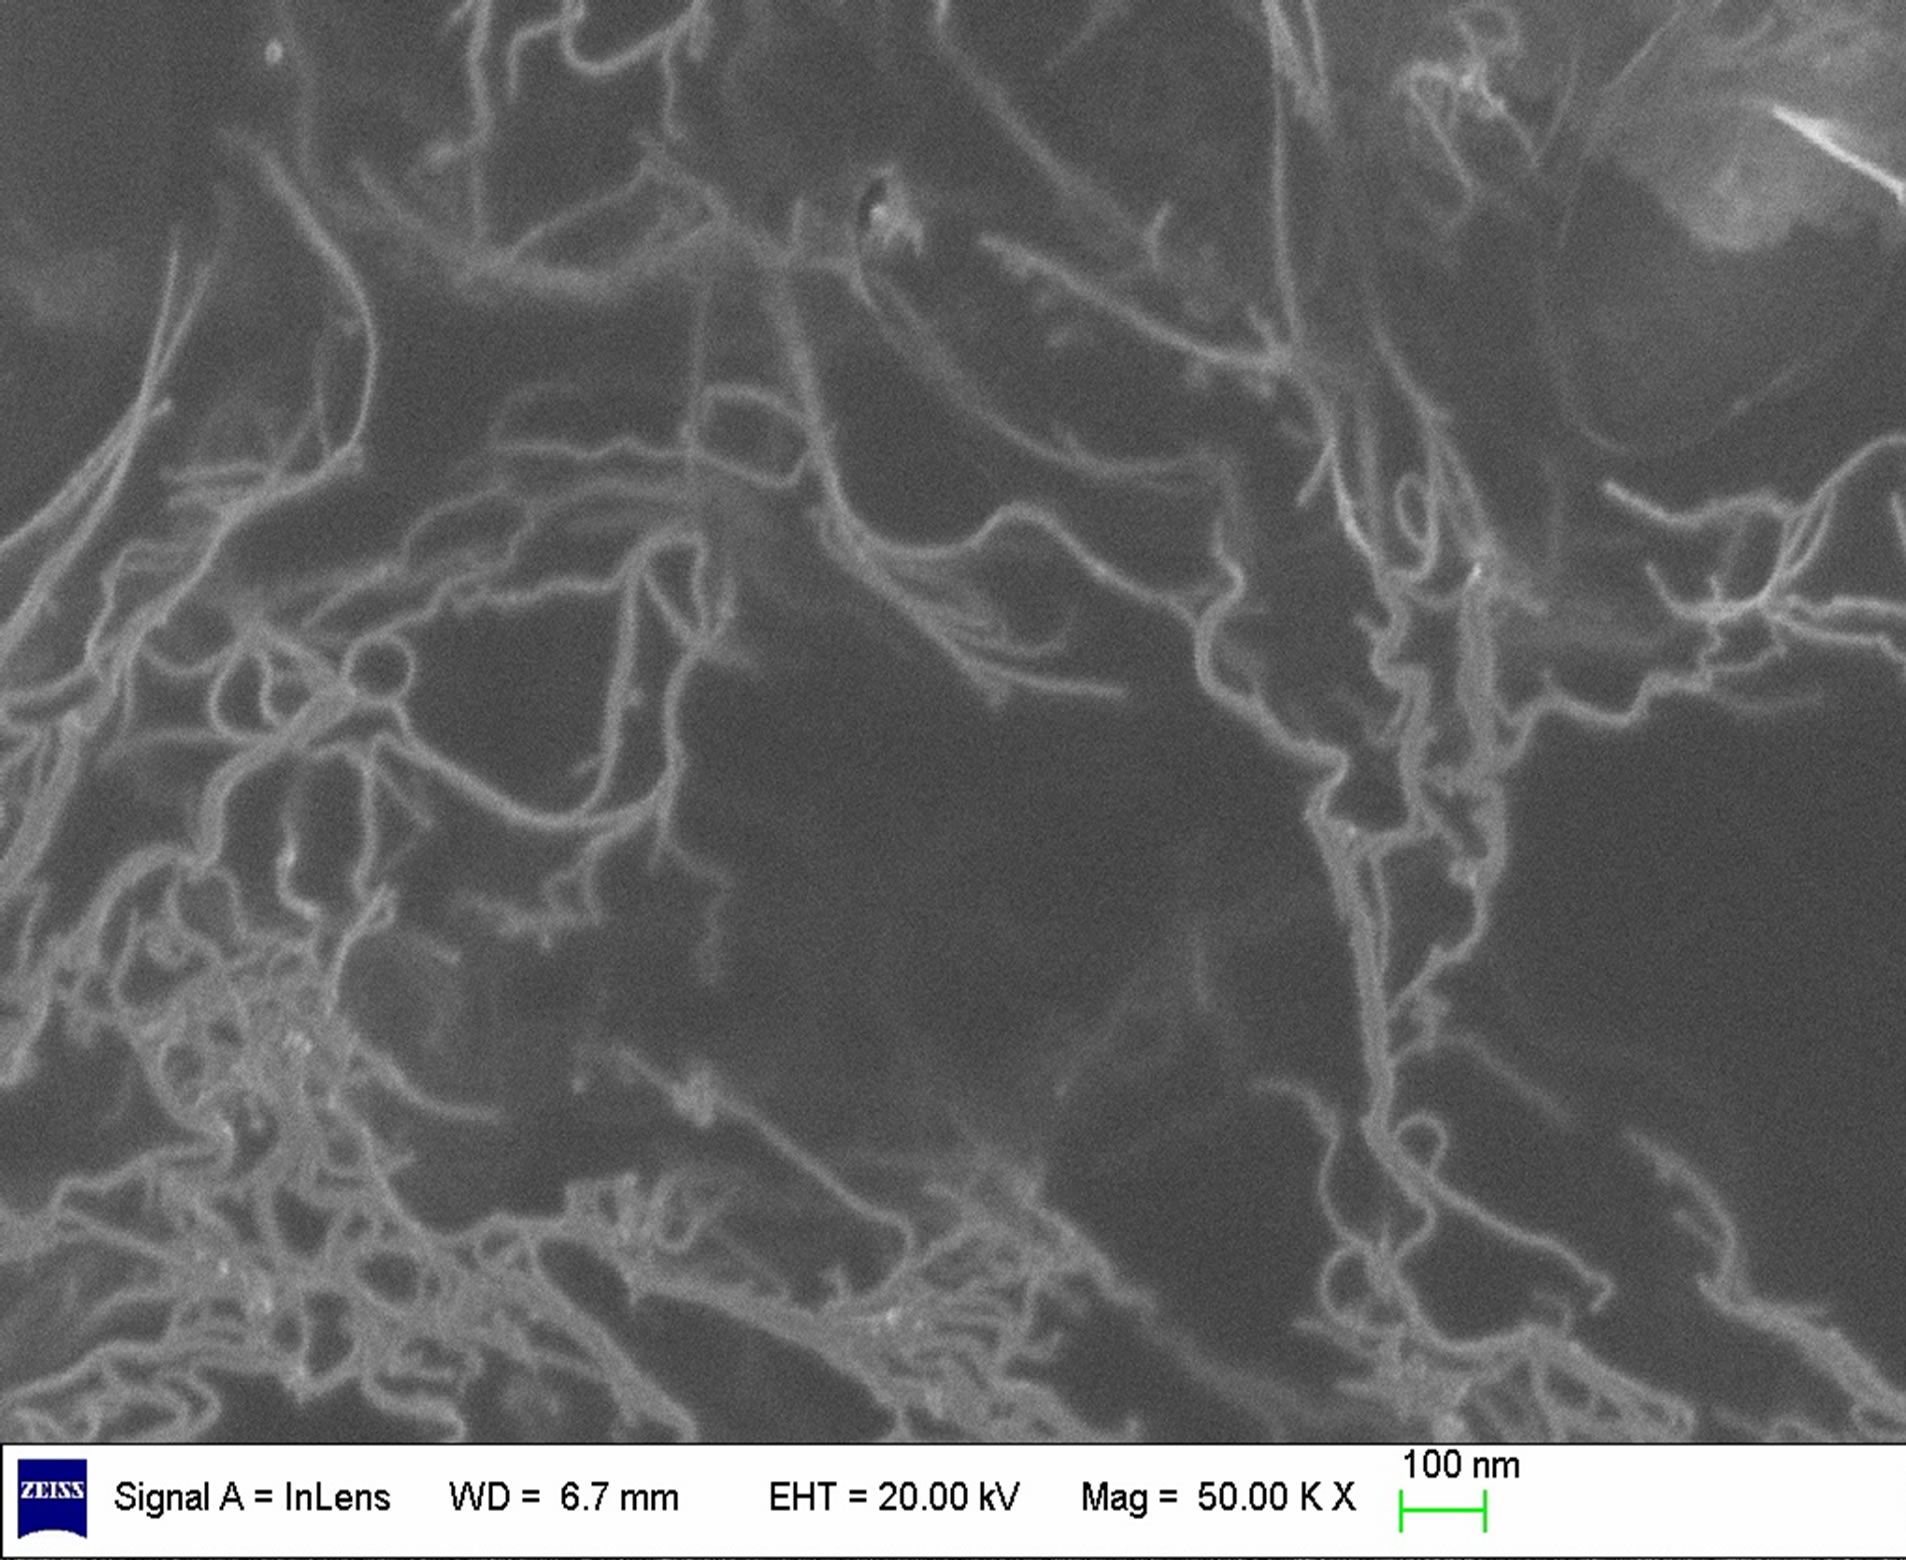 (b)
(b)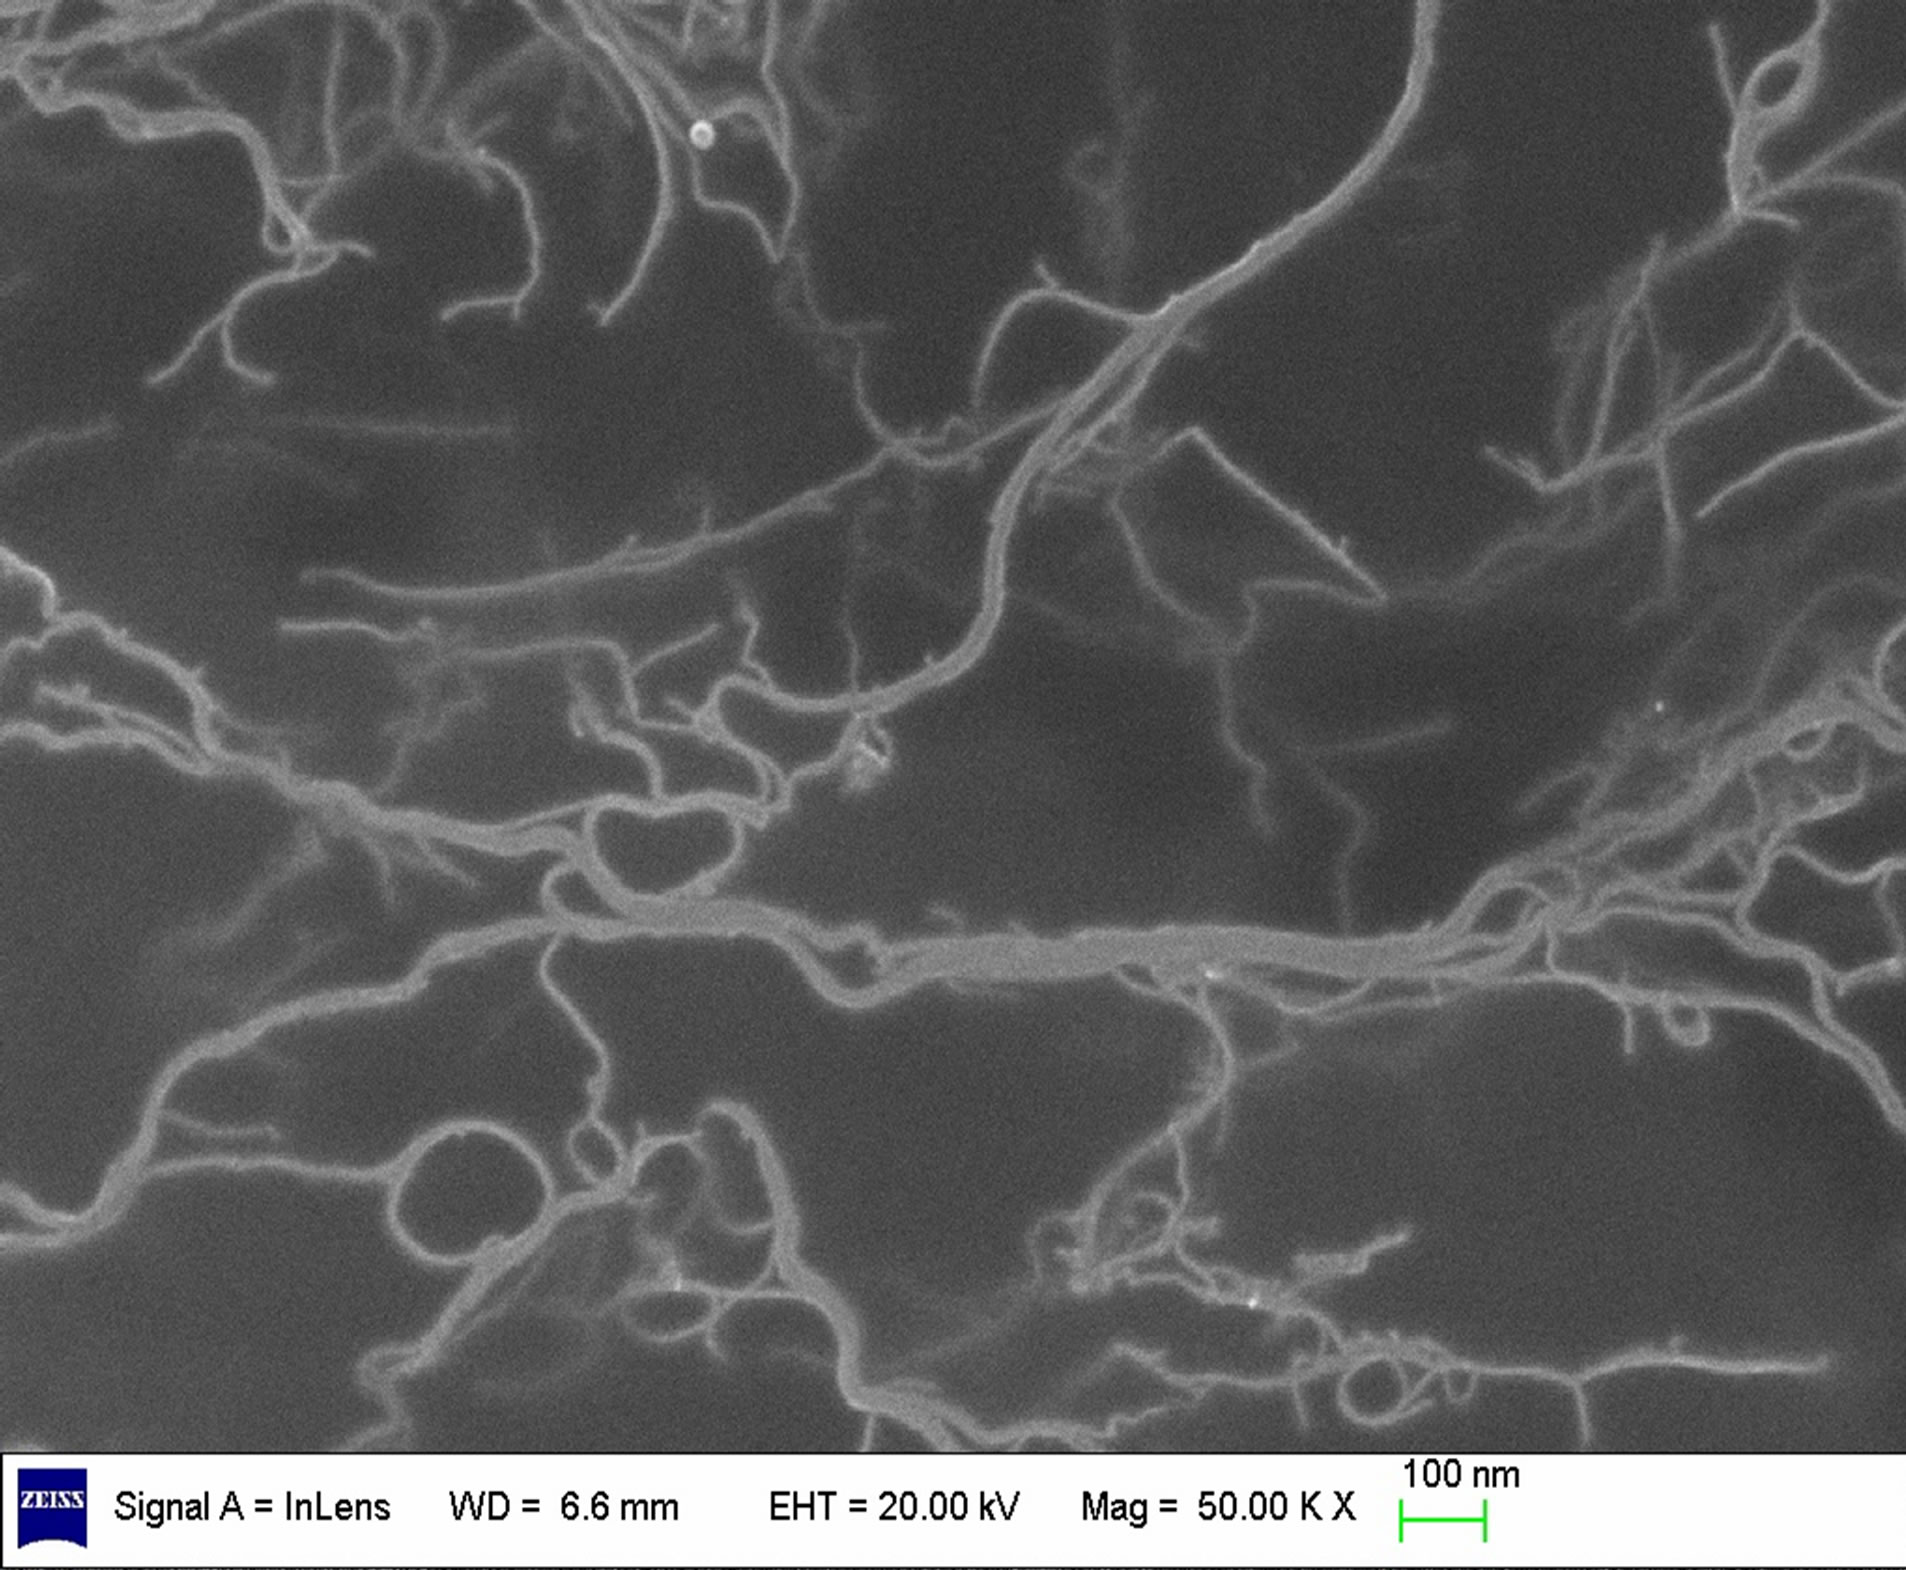 (c)
(c)
Figure 4. SEM images of different SDS concentrations on SWCNTs dispersion. (a) 0.5 wt% SDS; (b) 1.5 wt% SDS; (c) 2.5 wt% SDS.
SDS solutions with different sonication time as show in Figure 5. The result suggest that longer sonication time will helps the carbon nanotubes dispersion, which is consistent with reports in the literature relative [21]. From Figure 6, we can also found that the extension of ultrasonic time can break the bundles of carbon nanotubes into single. But from Figure 5, the curve of ultrasound six hours of the samples than ultrasound four hours more smooth. That because long time of ultrasound can provide more energy to weaken the interaction force between the carbon atoms in the carbon nanotubes, which makes the carbon nanotubes prone to breakage or other damage, make its characteristic peak disappeared. So an appropriate extension of ultrasonic time can effectively disperse carbon nanotubes, but Ultrasonic time is too long will damage the carbon nanotubes.
3.5. Effects of Sonication Temperature on SWCNTs Dispersion
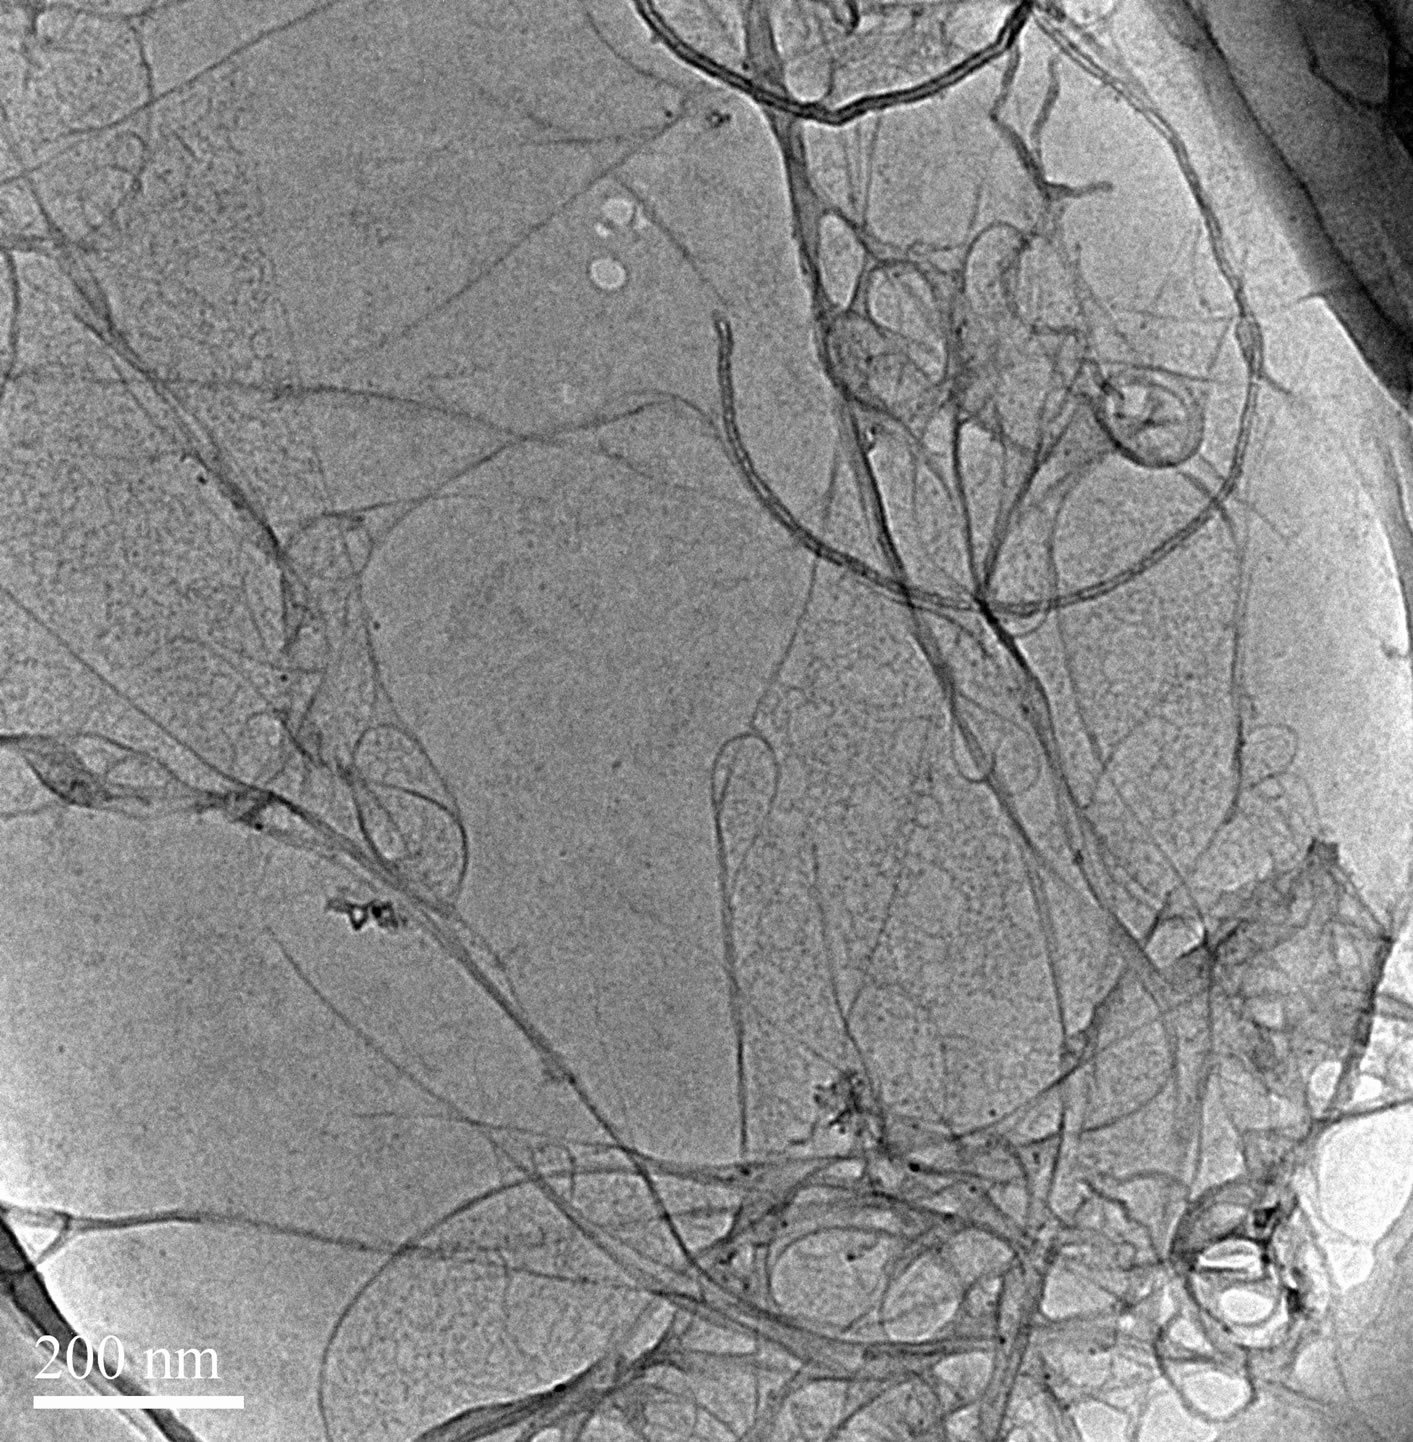
The process of dispersion of SWCNT into aqueous solution needs sonication. Many researchers have mentioned the need ice water bath in the process [22]. We also investigated the effects of sonication temperature on SWCNTs dispersion (Figures 7 and 8). As show in Figure 7, the absorbance intensities are higher at 24˚C than those at 30˚C. That means more SWCNTs are dispersed. However, when the sonication temperature is 30˚C, the peaks were disappeared indicating that SWCNTs regenerated to be bundles. Similarly, the TEM images confirmed it as show in Figure 8. So when the ultrasound temperature is 30˚C, the energy in the ultrasonic process makes the actual temperature exceed 30˚C, ultrasonic temperature too high makes SDS lapse, reunion together, cannot be wrapped in the surface of carbon nanotubes dispersion of carbon nanotubes. But when the ultrasound
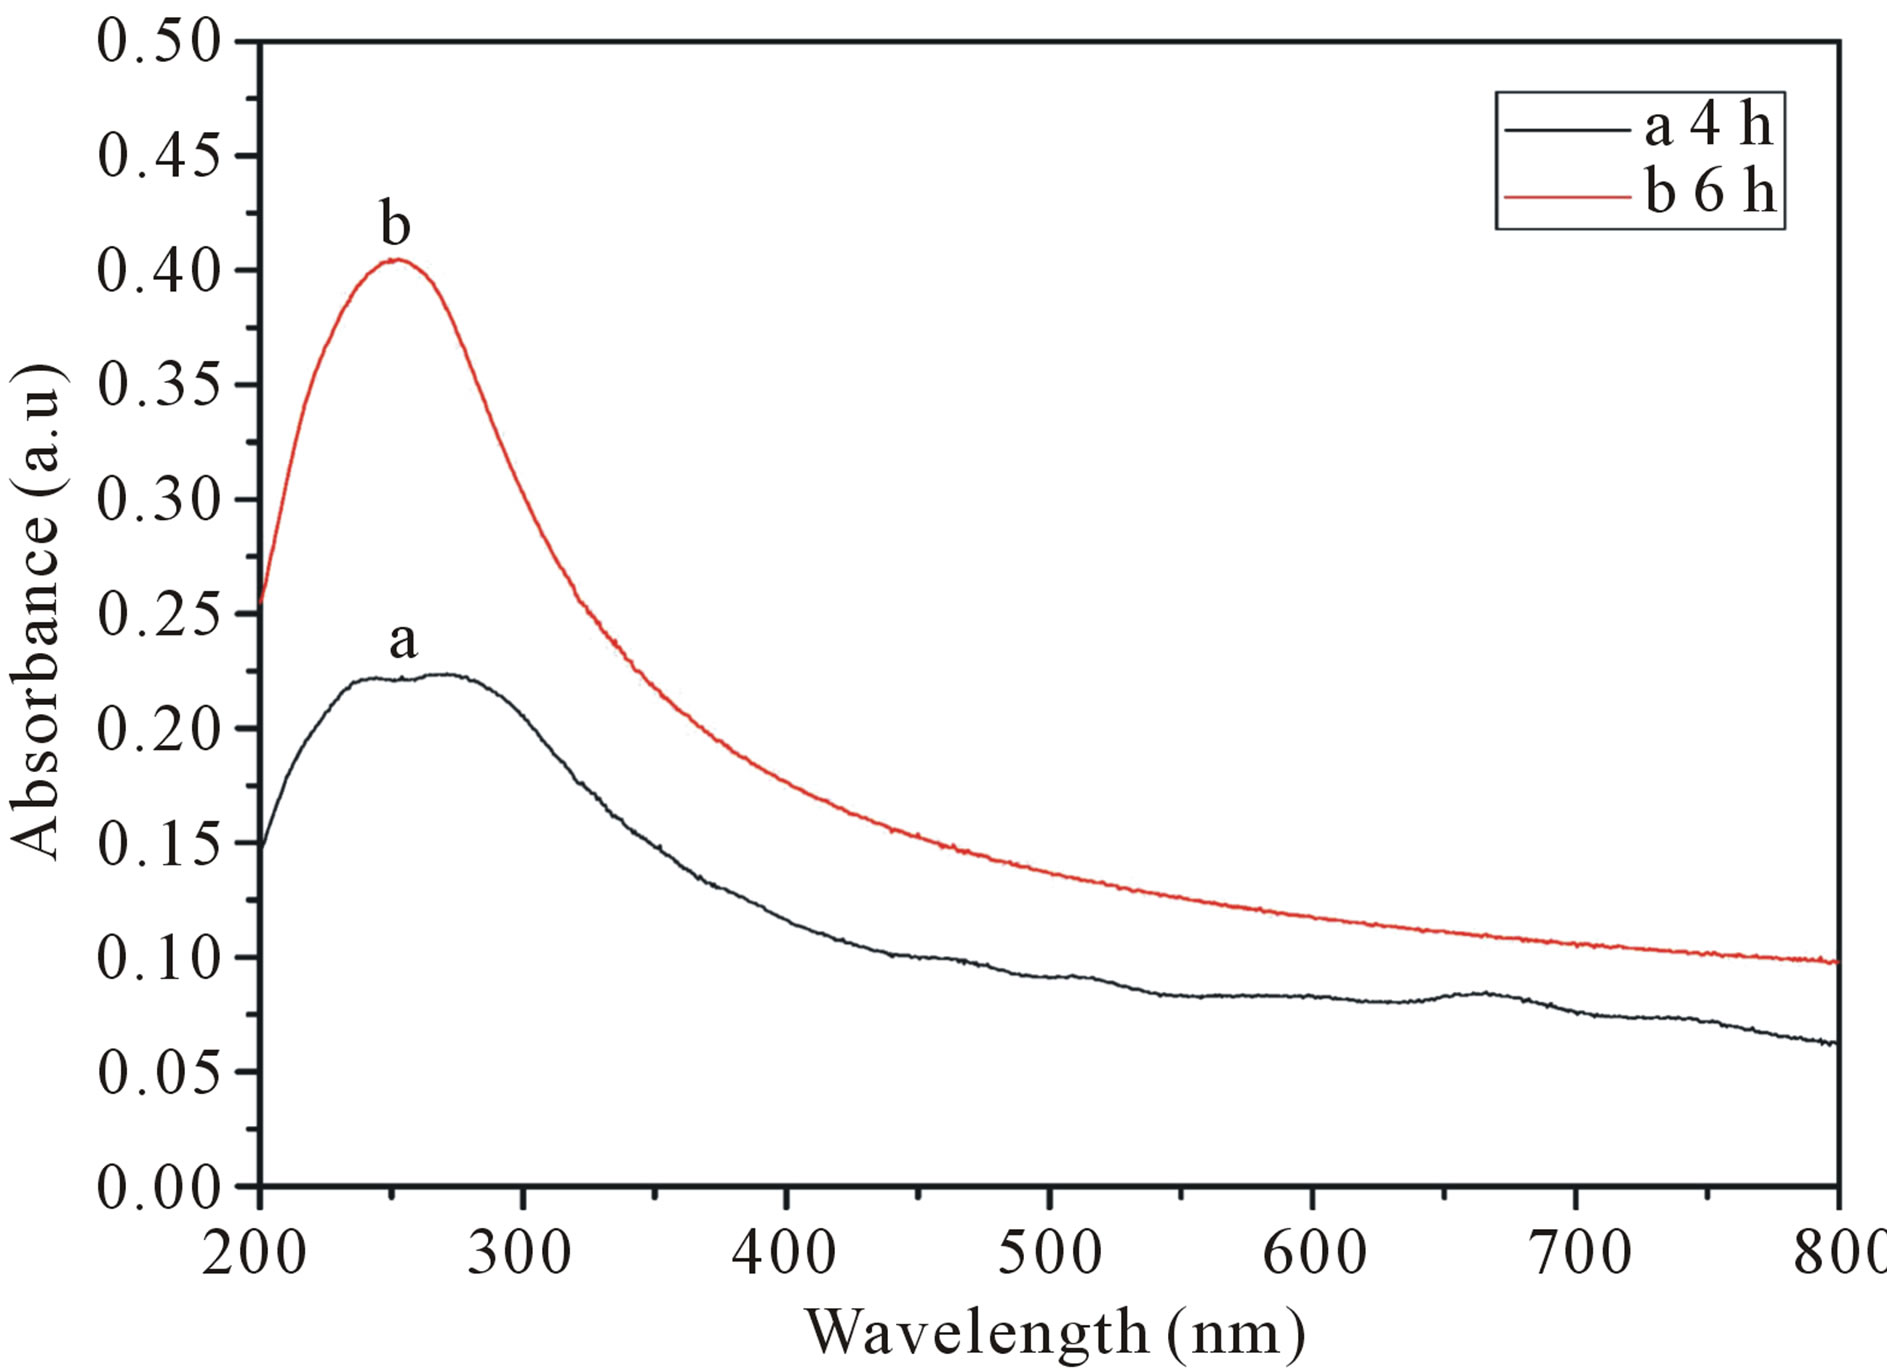
Figure 5. UV-vis-NIR spectra of SWCNT-SDS solutions with different sonication time. (a: 4 hours; b: 6 hours). The solutions are diluted by a factor of 10 when taking UV-visNIR measurements.
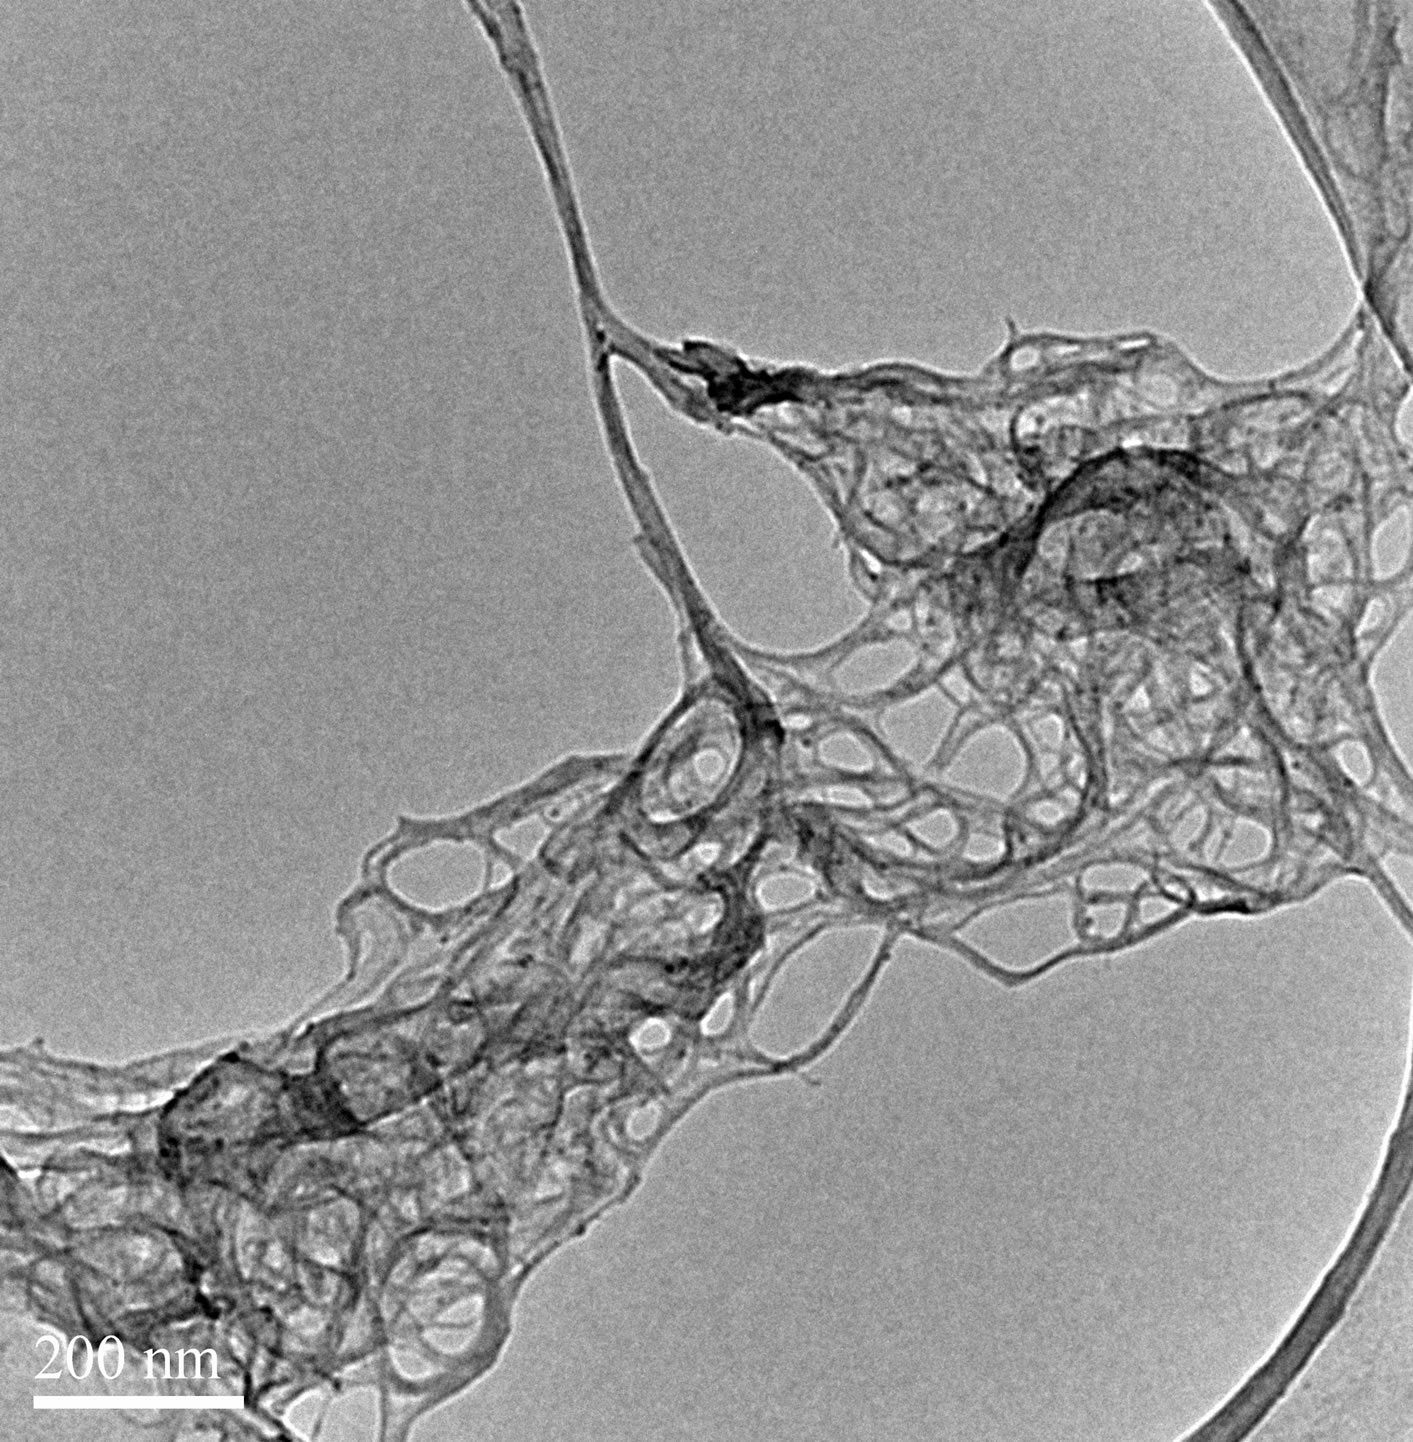 (a)
(a)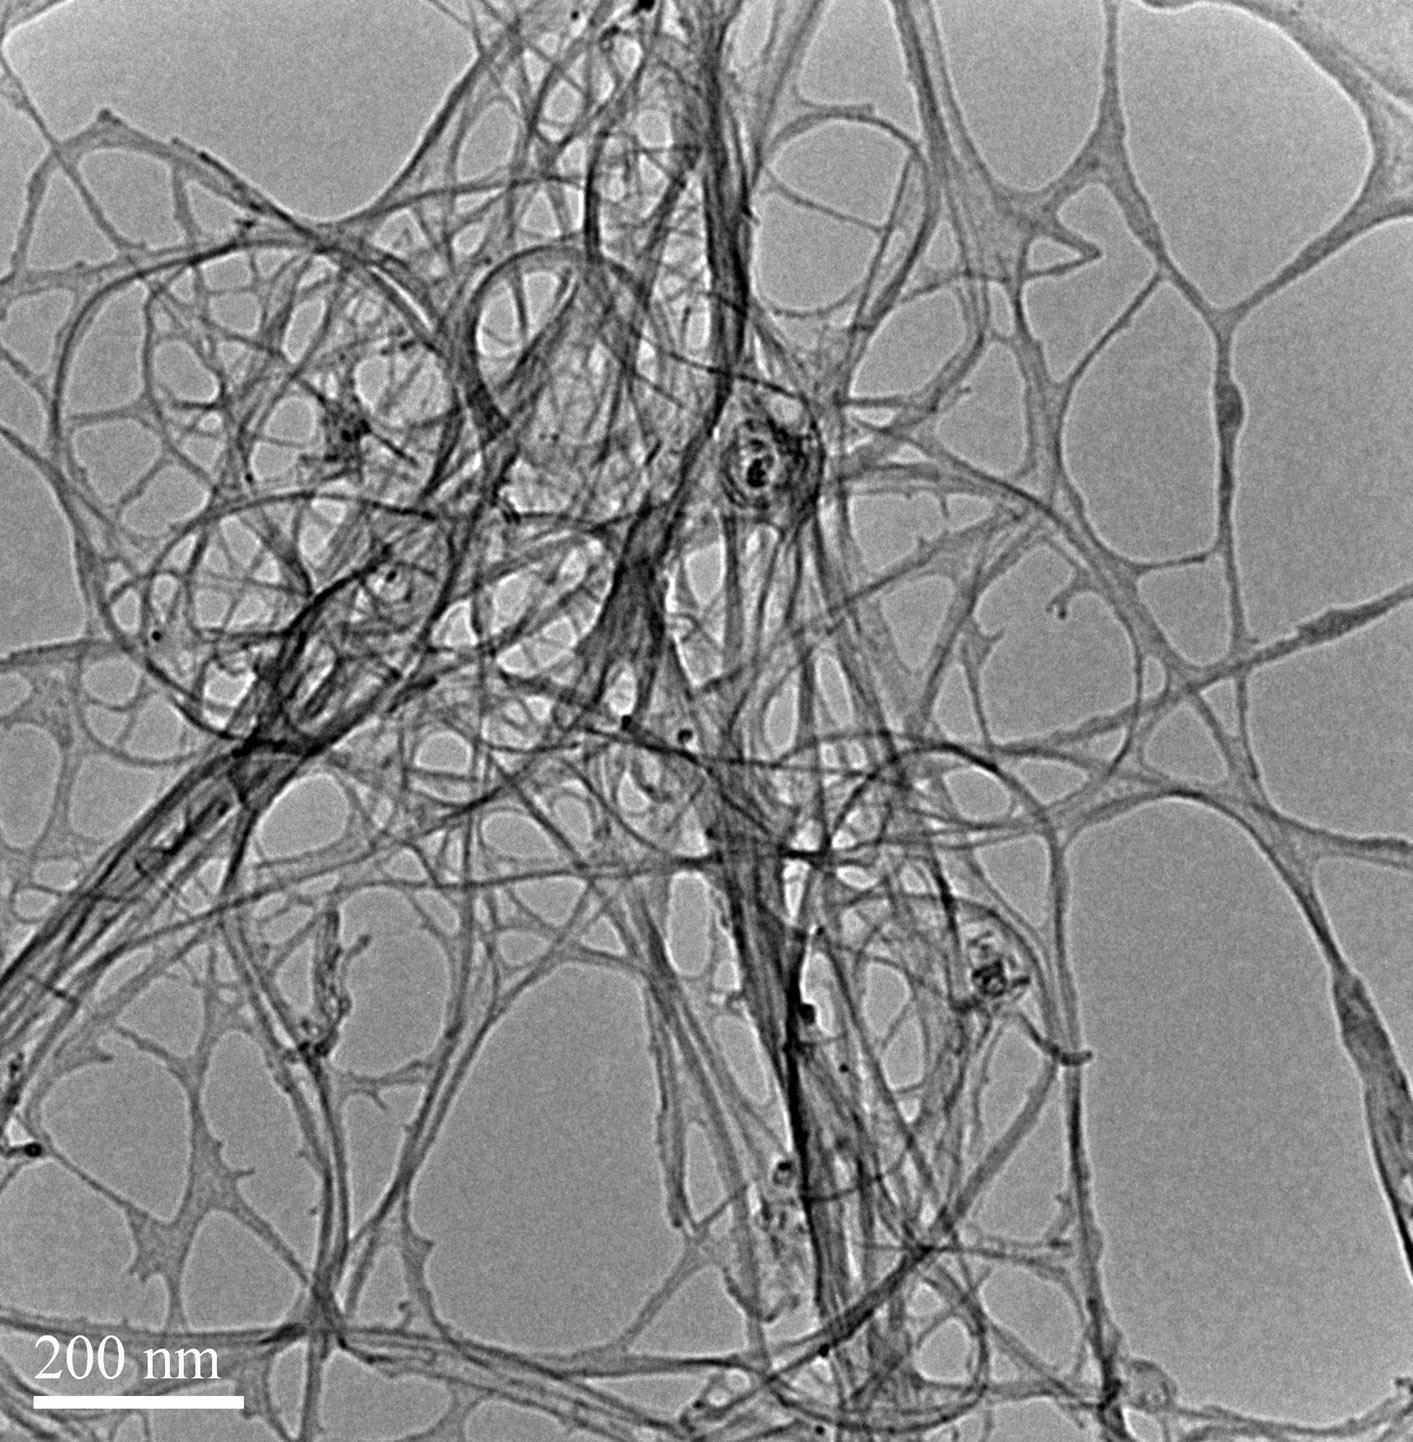 (b)
(b)
Figure 6. TEM images of SWCNT-SDS solutions with different sonication time. (a) 4 hours; (b) 6 hours.
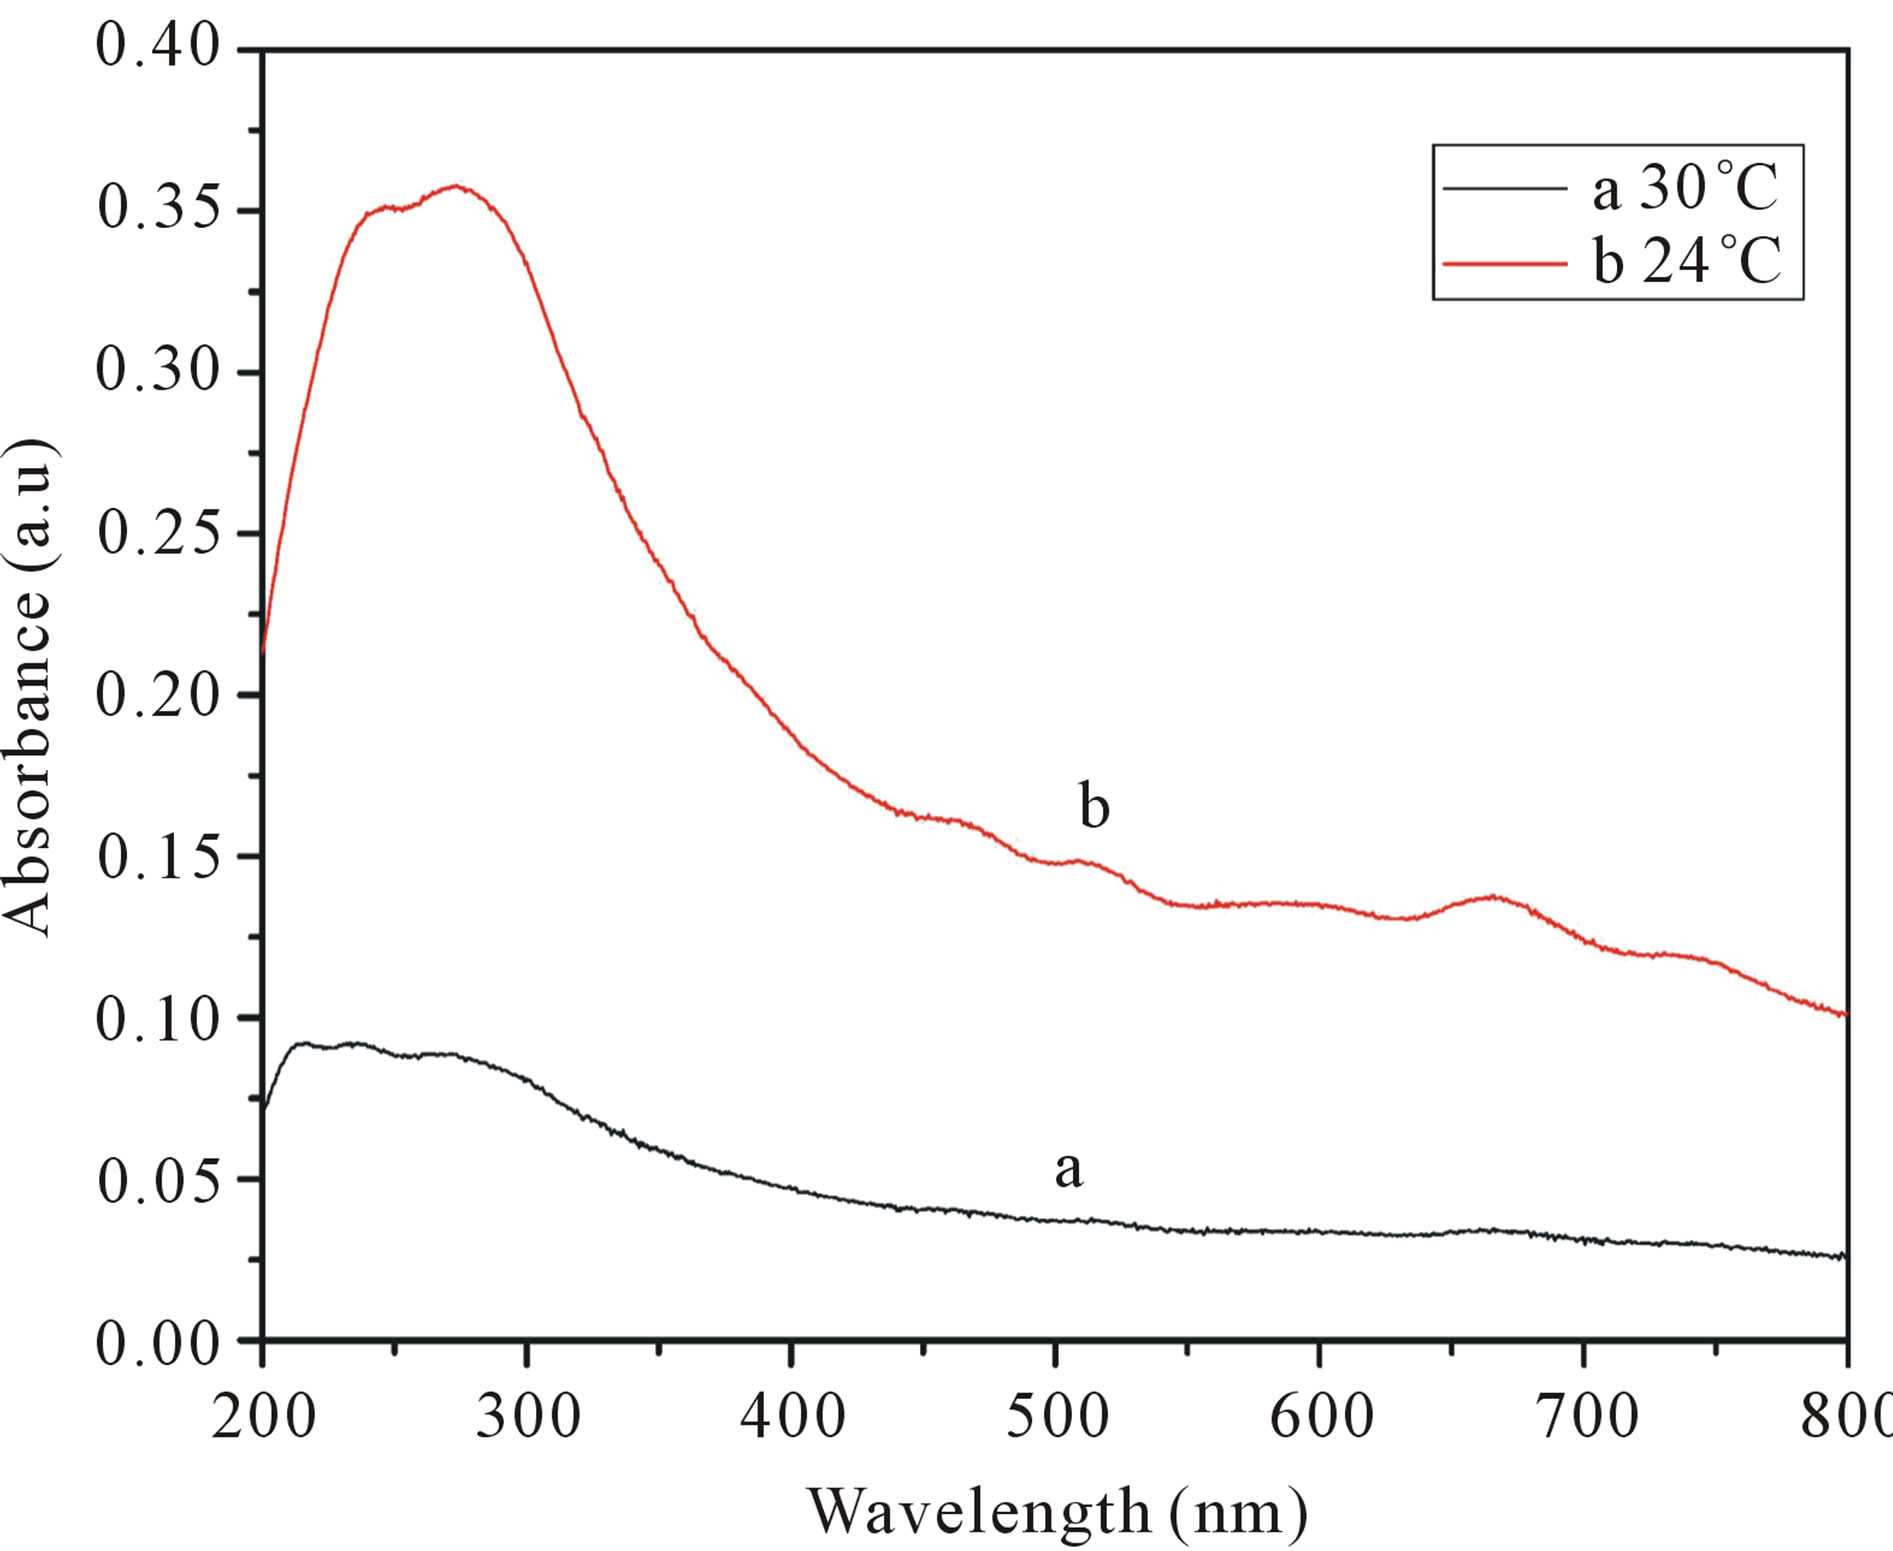
Figure 7. UV-vis-NIR spectra of SWCNT-SDS solutions with different sonication Temperature. (a: 30˚C; b: 24˚C). The solutions are diluted by a factor of 10 when taking UVvis-NIR measurements.
 (a)
(a)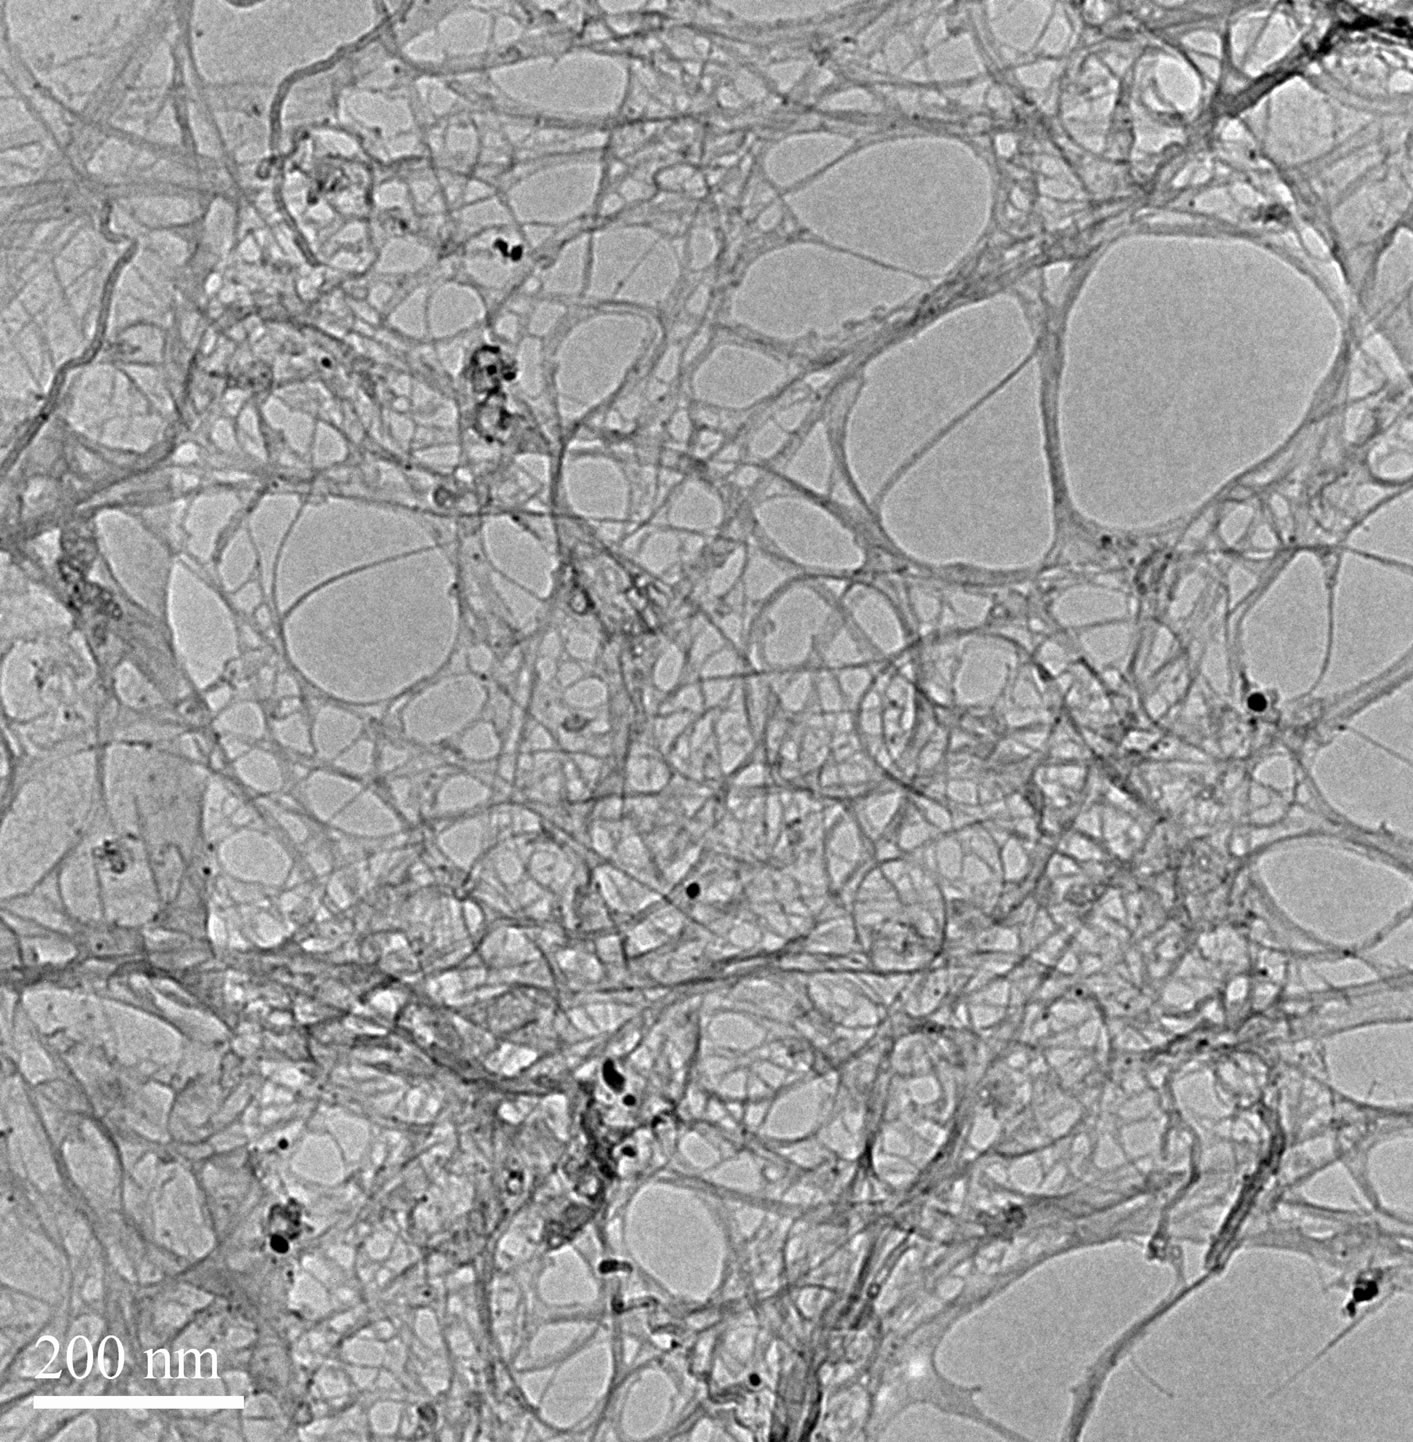 (b)
(b)
Figure 8. TEM images of SWCNT-SDS solutions with different sonication Temperature. (a) 30˚C; (b) 24˚C.
temperature is 24˚C, although the ultrasonic actual temperature will rise in the process, SDS is not lapsed, the surface of carbon nanotubes can be covered by SDS, enhance the dispersion effect. The results indicating that low temperature contribute to the dispersion of carbon nanotubes.
4. Conclusion
To conclude, we report a simple UV-vis-NIR spectroscopic technique to monitor the sonication-driven dispersion of SWNTs in aqueous SDS solutions. The results show that the maximum achievable dispersion corresponds to the maximum UV-vis-NIR absorbance of the SWCNTs solution. Then we chose the UV-vis-NIR absorbance intensity at 241 nm as reference for the estimation of the dispersed SWCNTs concentration. Moreover, we have demonstrated excellent dispersion of SWCNTs in aqueous SDS solutions. The sonication-driven dispersion and the factors that optimize its effect have also systematically been studied by using SEM and TEM. SWCNTs are gradually disentangled from aggregates and bundles and stabilized by SDS. The SDS molecules are adsorbed on the surface of SWCNTs and prevent re-aggregation. The best dispersion of the SWCNTs is 0.4 mg/ml; the optimal concentrations of SDS is 1.5 wt%; low temperature, and the appropriate increase in sonication time contribute to the dispersion of carbon nanotubes.
REFERENCES
- D. A. Heller, R. M. Mayrhofer, S. Baik, Y. V. Grinkova, M. L. Usrey and M. S. Strano, “Concomitant Length and Diameter Separation of Single-Walled Carbon Nanotubes,” Journal of The American Chemical Society, Vol. 126, No. 44, 2004, pp. 14567-14573. doi:10.1021/ja046450z
- S. Niyogi, S. Boukhalfa, S. B. Chikkannanavar, T. J. McDonald, M. J. Heben and S. K. Doorn, “Selective Aggregation of Single-Walled Carbon Nanotubes via Salt Addition,” Journal of The American Chemical Society, Vol. 129, No. 7, 2007, 1898-1890. doi:10.1021/ja068321j
- P. Angelikopoulos, A. Gromov, A. L. O. Nerushev, H. Bock and E. E. B. Campbell, “Dispersing Individual Single-Wall Carbon Nanotubes in Aqueous Surfactant Solutions below the cmc,” Journal of Physical Chemistry B, Vol. 114, No. 1, 2010, pp. 2-9.
- A. I. Zhbanov, E. G. Pogorelov and Y.-C. Chang, “Van der Waals Interaction between Two Crossed Carbon Nanotubes,” American Chemical Society Nano, Vol. 4, No. 10, 2010, pp. 5937-5945.
- N. Izard, E. Doris and C. Mioskowski, “Separation of Semiconducting from Metallic Carbon Nanotubes by Selective Functionalization with Azomethine Ylides,” Journal of the American Chemical Society, Vol. 128, No. 20, 2006, pp. 6552-6553. doi:10.1021/ja060802f
- H. Liu, Y. Feng, T. Tanaka, Y. Urabe and H. Kataura, “Diameter-Selective Metal/Semiconductor Separation of Single-Wall Carbon Nanotubes by Agarose Gel,” Journal of Physical Chemistry B, Vol. 114, No. 20, 2010, pp. 9270-9276.
- X. Tan, M. Fang, C. Chen, S. Yu and X. Wang, “Counterion Effects of Nickel and Sodium Dodecylbenzene Sulfonate Adsorption to Multiwalled Carbon Nanotubes in Aqueous Solution,” Carbon, Vol. 46, No. 13, 2008, pp. 1741-1750. doi:10.1016/j.carbon.2008.07.023
- N. Nair, W.-J. Kim, R. D. Braatz and M. S. Strano, “Dynamics of Surfactant-Suspended Single-Walled Carbon Nanotubes in a Centrifugal Field,” Langmuir, Vol. 24, No. 5, 2008, pp. 1790-1795. doi:10.1021/la702516u
- R. Rastogi, R. Kaushal, S. K. Tripathi, A. L. Sharma, I. Kaur and L. M. Bharadwaj, “Comparative Study of Carbon Nanotube Dispersion Using Surfactants,” Journal of Colloid and Interface Science, Vol. 328, No. 2, 2008, pp. 421-428. doi:10.1016/j.jcis.2008.09.015
- D. A. Heller, R. M. Mayrhofer, S. Baik, Y. V. Grinkova, M. L. Usrey and M. S. Strano, “Concomitant Length and Diameter Separation of Single-Walled Carbon Nanotubes,” Journal of The American Chemical Society, Vol. 126, No. 44, 2004, pp. 14567-14573. doi:10.1021/ja046450z
- G. Liu, Y. Zhao, K. Zheng, Z. Liu, W. Ma, Y. Ren, S. Xie and L. Sun, “Coulomb Explosion: A Novel Approach to Separate Single-Walled Carbon Nanotubes from Their Bundle,” Nano Letters, Vol. 9, No. 1, 2009, pp. 239-244. doi:10.1021/nl802827m
- Z. Liu, J. Zhang and B. Gao, “Raman Spectroscopy of Strained Single-Walled Carbon Nanotubes,” Chemical Communications, No. 45, 2009, pp. 6902-6918. doi:10.1039/b914588e
- Z. Zhou, L. Ci, L. Song, X. Yan, D. Liu, H. Yuan, Y. Gao, J. Wang, L. Liu, W. Zhou, S. Xie, Y. Du and Y. Mo, “The Intrinsictemperature Effect of Raman Spectra of DoubleWalled Carbon Nanotubes,” Chemical Physics Letters, Vol. 396, No. 4-6, 2004, pp. 372-376. doi:10.1016/j.cplett.2004.08.004
- L. Ci, Z. Zhou, X. Yan, D. Liu , H. Yuan, L. Song, Y. Gao, J. Wang, L. Liu, W. Zhou, G. Wang, S. Xie and P. Tan, “Resonant Raman Scattering of Double Wall Carbon Nanotubes Prepared by Chemical Vapor Deposition Method,” Journal of Applied Physics, Vol. 94, No. 9, 2003, pp. 5715-5719. doi:10.1063/1.1619201
- J.-P. Tessonnier, D. Rosenthal, T. W. Hansen, C. Hess, M. E. Schuster, R. Blume, F. Girgsdies, N. Pfänder, O. Timpe, D. S. Su and R. Schlögl, “Analysis of the Structure and Chemical Properties of Some Commercial Carbon Nanostructures,” Carbon, Vol. 47, No. 7, 2009, pp. 1779-1798. doi:10.1016/j.carbon.2009.02.032
- L. Liao, M. Zheng, Z. Zhang, B. Yan, X. Chang, G. Ji, Z. Shen, T. Wu, J. Cao, J. Zhang, H. Gong, J. Cao and T. Yu, “The Characterization and Application of p-Type Semiconducting Mesoporous Carbon Nanofibers,” Carbon, Vol. 47, No. 7, 2009, pp. 1841-1845. doi:10.1016/j.carbon.2009.03.029
- V. C. Moore, M. S. Strano, E. H. Haroz, R. H. Hauge, and R. E. Smalley, “Individually Suspended SingleWalled Carbon Nanotubes in Various Surfactants,” Nano Letters, Vol. 3, No. 10, 2003, pp. 1379-1382. doi:10.1021/nl034524j
- L. Visman, H. D. Wagner and G. Marom, “The Role of Surfactants in Dispersion of Carbon Nanotubes,” Advances in Colloid and Interface Science, Vol. 128-130, 2006, pp. 36-47.
- A. G. Ryabenko, T. V. Dorofeeva and G. I. Zvereva, “UVvis-NIR Spectroscopy Study of Sensitivity of SingleWall Carbon Nanotubes to Chemical Processing and Van-der-Waals SWNT/SWNT Interaction. Verification of the SWNT Content Measurements by Absorption Spectroscopy,” Carbon, Vol. 42, No. 8-9, 2004, pp. 1523- 1535. doi:10.1016/j.carbon.2004.02.005
- J-S. Laurent, C. Voisin, G. Cassabois, C. Delalande, Ph. Roussignol, O. Jost and L. Capes, “Ultrafast Carrier Dynamics in Single-Wall Carbon Nanotubes,” Physical Review Letters, Vol. 90, No. 5, 2003, Article ID: 057404-1-4.
- J. Yu, N. Grossiord, C. E. Koning and J. Loos, “Controlling the Dispersion of Multi-Wall Carbon Nanotubes in Aqueous Surfactant Solution,” Carbon, Vol. 45, No. 3, 2007, pp. 618-623. doi:10.1016/j.carbon.2006.10.010
- H. Liu, D. Nishide, T. Taanaka and H. Kataura, “LargeScale Single-Chirality Separation of Single-Wall Carbon Nanotubes by Simple Gel Chromatography,” Nature Communications, No. 305, 2011, pp. 1-7.
NOTES
*Corresponding authors.