Microscopy Research
Vol. 1 No. 3 (2013) , Article ID: 37744 , 5 pages DOI:10.4236/mr.2013.13005
Preparation Procedure of Liposome-Absorbed Substrate and Tip Shape Correction of Diameters of Liposome Measured by AFM
![]()
1Surface Analysis Laboratories, Toray Research Center Inc. (TRC), Otsu, Japan; 2Research Institute of Instrumentation Frontier, National Institute of Advanced Industrial Science and Technology (AIST), Tsukuba, Japan; 3Advanced Key Technologies Division, National Institute for Materials Science (NIMS), Tsukuba, Japan.
Email: takaya_fujita@00.alumni.u-tokyo.ac.jp
Copyright © 2013 Yuichi Muraji et al. This is an open access article distributed under the Creative Commons Attribution License, which permits unrestricted use, distribution, and reproduction in any medium, provided the original work is properly cited.
Received August 2nd, 2013; revised September 20th, 2013; accepted October 11th, 2013
Keywords: Atomic Force Microscope (AFM); Dynamic Light Scattering (DLS); Anionic Liposome; 3-Aminopropyltriethoxysilane (APTES)
ABSTRACT
The procedure to measure liposome in aqueous solution has been examined using atomic force microscope (AFM). We concluded a chemical modified silicon wafer (substrate for AFM observation of liposome) with 3-aminopropyltriethoxysilane (APTES) which enabled us to scan anionic liposome softly in water because they were keeping structures as vesicles and stably adsorbed on the substrate by electrostatic force. From captured AFM topographic images, we counted the amount of liposome and analyzed the distribution of mean diameters, which were corrected by an approximated curve of the tip shape. We discussed the method of effective evaluation as practical analysis and its problems for robust analysis.
1. Introduction
Atomic force microscope (AFM) [1] is widely used for characterization of a three dimensional topography and analyzing a property of specimens’ surfaces. The AFM market has grown and spread since the operation modes were designed for direct observation and manipulation of biological molecules and cells. Several reviews of applied study using AFM for biological science and medical and pharmaceutical industry have been also reported so far. The AFM needs in this kind of applications are still high and the preparation and measurement procedure would be an important issue in practical analysis.
Liposome with a vesicular structure is adopted in drug delivery system (DDS) as nanometer scale carriers of the transporting pharmaceutical compounds to target sites within the body. For evaluating their pharmacokinetics, average diameter of liposome in a liquid suspension is usually performed by conventional tools. For clarifying the mechanism and improving the medical effect, it is important to investigate individual nature and distribution, so that the liposome laid on an atomically flat substrate although technically difficult. In such a background, observations and metrological measurements of liposome have been tried in the past frontier studies [2-5]. In this work, we examined the reproducibility of the reported procedures and also discuss the possibility of robust analysis for their pre-standardization.
2. Experimental Methods
2.1. Materials
Distearoylphosphatidylcholine (DSPC), distearoylphosphatidylglycerol (DSPG) and cholesterol were purchased from Sigma-Aldrich (St. Louis, MO) and 3-Aminopropyltriethoxysilane (APTES) was from Nacalai tesque Inc. (Kyoto, Japan). Water was taken from a Milli-Q Plus 185 (Millipore, Molsheim, France) ultrapure water system with a resistivity of 18 MΩcm. Polished 100-oriented silicon wafers were from KST World Corp. (Fukui, Japan). Tris-NaCl/EDTA buffer (including 0.1 M NaCl and 0.1 mM EDTA, abbreviation of ethylenediaminetetraacetic acid) was used for preparing liposome and AFM measurement in aqueous solution.
2.2. Liposome Preparation
Liposome is a self-assembled membrane consisted of amphiphilic lipids in aqueous solution, which has a vesicular structure with bilayer formation, as illustrated in Figure 1. In this work, we focused on a typical anionic liposome with lipid composition of DSPC and DSPG besides ones of the referred literature [2-5], whereas Neil H. Thomson et al. methodically studied cationic liposome by AFM. The anionic liposome suspension was prepared as follows. Lipid consisted of DSPC, DSPG and cholesterol at 66.7, 3.3 and 30 mol% was dissolved in chloroform, deposited on the wall of a round flask by evaporation of the solvent, and dissolved again in Tris-NaCl/ EDTA buffer at room temperature. Soon after that, ultra sonication for 5 minutes and extrusion through a filter with a pore size of 200 nm in diameter were done to remove impurities.
2.3. Modification of Substrate
Silicon chip with a size of 20 mm square, cut from silicon wafer to use as a substrate for AFM measurement of liposome, was reacted with 3-aminopropyltriethoxysilane (APTES) in toluene at 60˚C for 10 minutes. The silanization by chemical adsorption reaction can be represented as shown in Figure 2.
Consequently, a certain amount of liposome were not only keeping structures as vesicles but also stably adsorbed on the substrate by electrostatic force because the amine functions have positive charge as illustrated in Figure 3. This modification, which is one of much essential preparations, enabled us to scan anionic liposome softly in fluid.
2.4. Atomic Force Microscope
AFM measurements in aqueous solution were performed using a BioScope II AFM with NanoScope V controller system (Bruker AXS), after dropping a liposome suspension on a silanized substrate. Scanning mode was tapping
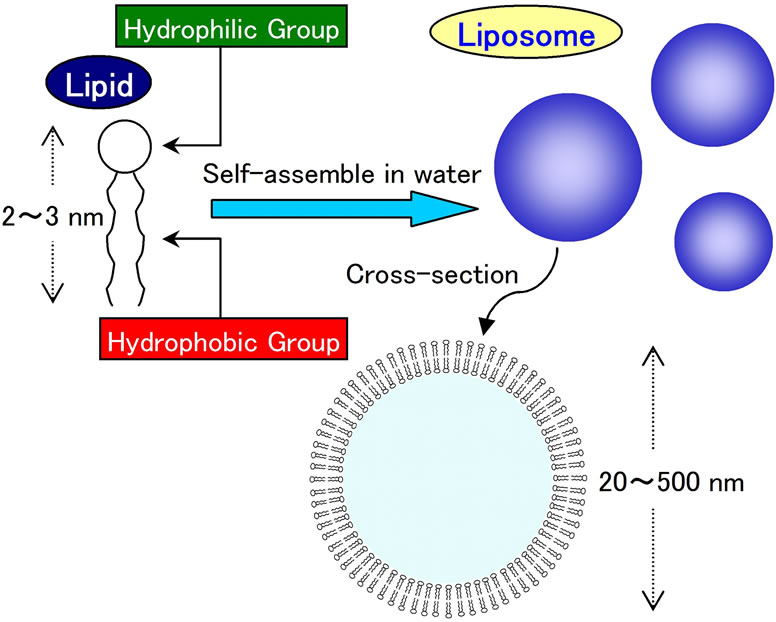
Figure 1. Schematic illustration of amphiphilic lipid and vesicle of liposome.

Figure 2. Frequently used preparation of silicon wafer modification with 3-aminopropyltriethoxysilane (APTES) which reacts with hydroxy groups on the silicon surface.
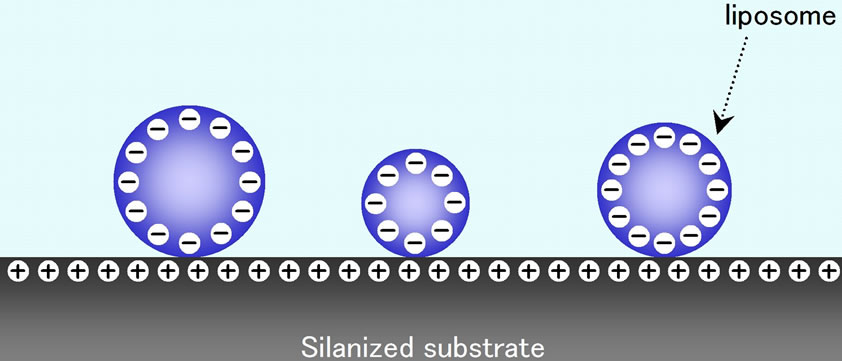
Figure 3. Schematic illustration of electrostatic adsorption of anionic liposome on the silanized substrate in aqueous solution.
mode. Silicon nitride cantilevers (OMCL-TR800PSA, Olympus) with a nominal spring constants of 0.15 N/m were used. Scanning area was 2 micrometers square and scan rate was around 1.0 Hz. Set point, the force between tip and sample, was carefully controlled in order not to destroy vesicular structure. From the captured images, size distribution of liposome was analyzed using image analysis soft.
3. Results
The captured AFM image is shown in Figure 4. The protrusions with spreading tails in Figure 4 were assigned as the adsorbed liposome on the substrate, which were agreement with the results of the literatures [2-5]. As a result, we confirmed amount of liposome were scanned with less deformation by controlling the set point force of the probe. As Pignataro et al. reported that vesicular structure of liposome ruptured if the force between tip and liposome exceeded 100 pN [6], it is significant to apply necessary and sufficient force in fluid AFM observation of liposome. In addition to that, prompt measurement is desirable, since observed protrusions of liposome often change into a step and terrace structure of a monolayer or bilayer of the compounds after repeated scanning.
The procedure of uniformly dispersing liposome on the substrate was optimized, in which we counted the number of liposome and corrected their diameters. How to count liposome and measure their diameters is illustrated in Figure 5. We extracted each non-ruptured liposome and enclosed it with a circle. More than 200 counts could be enough for evaluating the average size and size distribution. As one AFM image is not probably sufficient, two or more images are necessary to achieve reproductive counts. After more than 200 counts (circles), the sheets on which circles were drawn are analyzed using image analysis soft “Image J”, publically provided by Wayne Rasband. Image J calculated an individual areas of the drawn circles automatically, and we calculated their diameter from the areas which were adjust to cross the full width at half maximum (FWHM) of their protrusions Tip shape of the actually used probe was also characterized from a reconstruction image obtained by scanning a roughed titanium sample as shown in Figure 6. The horizontal axis is estimated average half width of the probe, and the vertical axis corresponds to the probeshank length from the contact point of the surface. Hence, this curve shows the average profile of the cross section of the probe, which causes appearing protrusions of liposome to grow wider than the actual. Figure 7 shows a correction curve between the estimated diameter and measured FWHM, assuming that the shape of liposome is spherical structure. Finally, using two AFM images like Figure 4, we analyzed a histogram of size distribution of the corrected diameters, as shown in Figure 8. A mean diameter on the substrate was found to be 60.1 nm and root-mean-square (RMS) deviation to be 16.7 nm.
4. Discussion
Dynamic light scattering (DLS) method was also used to compare with AFM, resulting to a mean diameter in the liquid suspension of the same liposome was 66.3 ± 17.4 nm, as indicated in Table 1. Though the mean diameter on the substrate by AFM was expected to be a little bit larger because of their flatly deforming, the average diameter was smaller than that of floating liposome measured by DLS. Regarding this discrepancy with the estimated values between AFM and DLS, two possibilities have been suggested.
One is that AFM gives us the information of structurallygeometric radius, whereas DLS would include severalfold hydrated ionic radius of the liposome. Another hypothesis is that the adsorbed liposome on the substrate by electrostatic force would be shrunk because of partial charge-transfer of electrons as like going from anionic species to cationic sites of the substrate.
Further investigations of liposome using AFM method would need more attentions and improvements. For example, when the values in literatures are compared, estimated diameters may involve some irretraceable errors of the tip shape. In fact, we showed one of the correction curve calculated from reconstruction image, however they depend on factors of the boundary condition in the algorithm. As it is now, we suggest users should better keep the used probe as a proof until the correction procedure is established and standardized in the not-so-distant future. And more, discrepancies among various different methods involving AFM and DLS need to be examined and defined to understand what is physically going on. Those who are engaged in research and analysis institute should always discuss other possibilities such as shrinking or expanding effect in the liquid suspension. These efforts would be useful to improve and provide
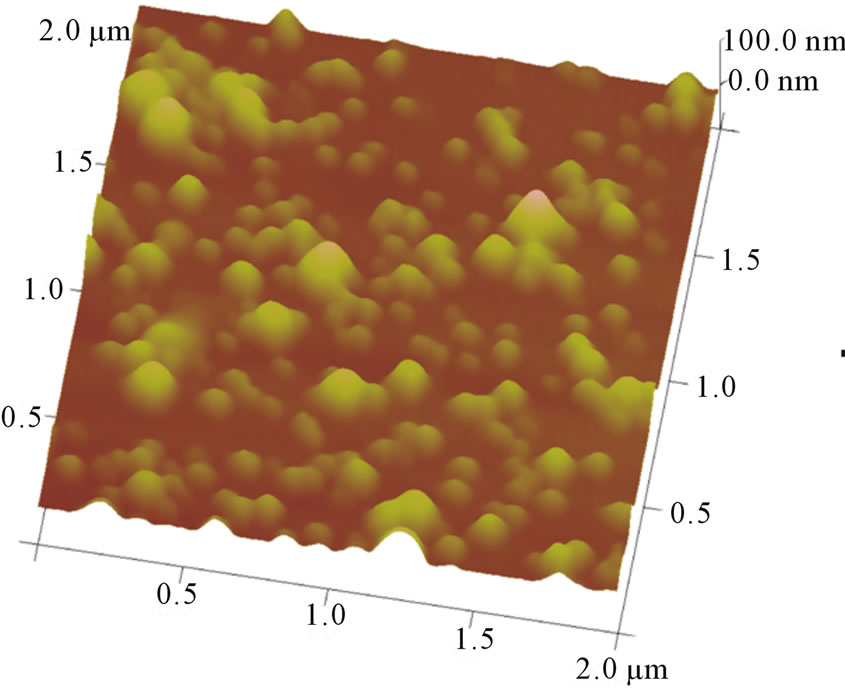
Figure 4. Three-dimensional AFM image of anionic liposome on a silanized silicon wafer in Tris-NaCl/EDTA buffer. Scanning area is 2 × 2 micrometers.

Figure 5. Schematic illustration of analyzing size distribution of liposome from captured AFM topographic image using image analysis soft.
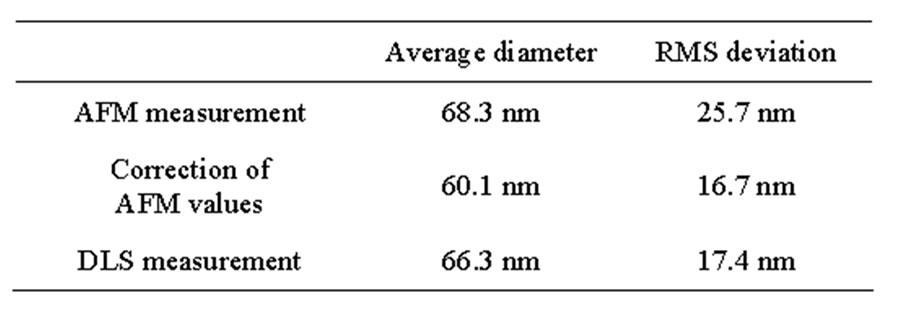
Table 1. Average diameters of liposome evaluated by AFM and DLS.
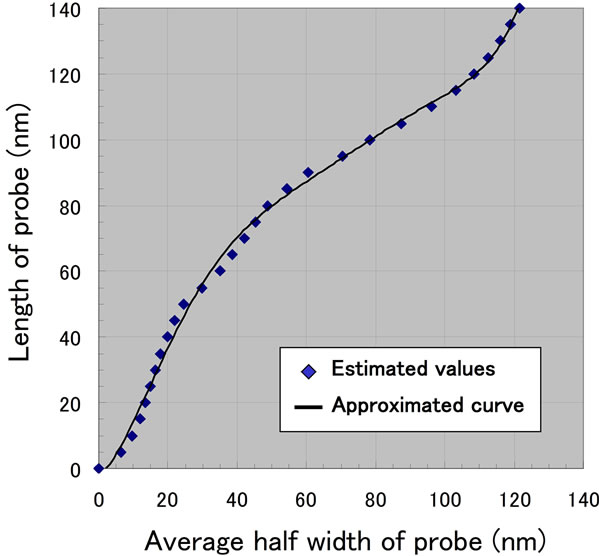
Figure 6. Profile of length and average half width of the AFM probe used in the measurement.
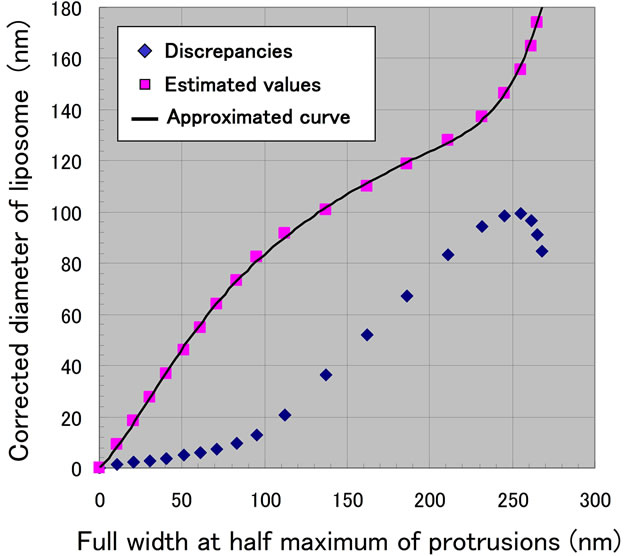
Figure 7. Correction curve between the estimated diameter of liposome and measured full width at half maximum of protrusions.
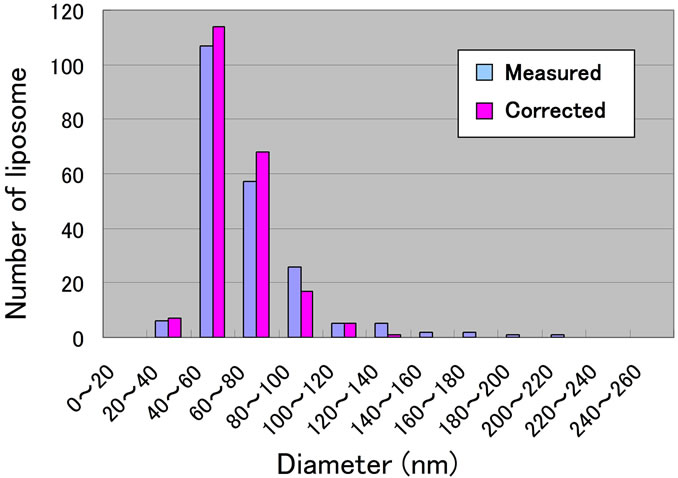
Figure 8. Distribution of diameters of the liposome analyzed from AFM images. Average diameter and RMS deviation were estimated to be 60.1 nm and 16.7 nm, respectively.
solutions for robust analysis.
Related techniques about our discussed chemical modification of the substrate and tip shape correction on measured protrusions could be also applied for other anionic liposome, though estimated values should be more considered in detail. As well as the application of the electrostatic effect, negatively-charged substrate and cationic liposome, which is our next planning subject, will be researched.
5. Summary
In this work, a method of a sample preparation of anionic liposome with lipid composition of DSPC and DSPG for AFM evaluation was examined. A modification of substrate with 3-aminopropyltriethoxysilane (APTES) allowed the observation of the adsorbed anionic liposome in fluid so that they were stably adsorbed on the substrate by electrostatic force. Tip shape of the actually used probe was also characterized and the diameters of the liposome were corrected by an approximated curve of the tip shape.
6. Acknowledgements
This work was partially supported by Ministry of Economy, Trade and Industry (METI). We also thank Prof. Shunsaku Kimura at Kyoto University for the sample preparation and DLS measurement.
REFERENCES
- G. Binnig, C. F. Quate and Ch. Gerber, “Atomic Force Microscope,” Physical Review Letters, Vol. 56, No. 9, 1986, pp. 930-933. http://dx.doi.org/10.1103/PhysRevLett.56.930
- H. Egawa and K. Furusawa, “Liposome Adhesion on Mica Surface Studied by Atomic Force Microscopy,” Langmuir, Vol. 15, No. 5, 1999, pp. 1660-1666. http://dx.doi.org/10.1021/la980923w
- N. H. Thomson, I. Collin, M. C. Davis, K. Palin, D. Parkins, C. J. Roberts, S. J. Tendler and P. M. Williams, “Atomic Force Microscopy of Cationic Liposomes,” Langmuir, Vol. 16, No. 11, 2000, pp. 4813-4818. http://dx.doi.org/10.1021/la991256p
- J. Jass, T. Tjarnhage and G. Puu, “From Liposomes to Supported, Planar Bilayer Structures on Hydrophilic and Hydrophobic Surfaces: An Atomic Force Microscopy Study,” Biophysical Journal, Vol. 79, No. 6, 2000, pp. 3153-3163. http://dx.doi.org/10.1016/S0006-3495(00)76549-0
- K. Nakano, Y. Tozuka, H. Yamamoto, Y. Kawashima and H. Takeuchi, “A Novel Method for Measuring Rigidity of Submicron-Size Liposomes with Atomic Force Microscopy,” International Journal of Pharmaceutics, Vol. 355, No. 1-2, 2008, pp. 203-209. http://dx.doi.org/10.1016/j.ijpharm.2007.12.018
- B. Pignataro, C. Steinem, H. J. Galla, H. Fuchs and A. Janshoff, “Specific Adhesion of Vesicles Monitored by Scanning Force Microscopy and Quartz Crystal Microbalance,” Biophysical Journal, Vol. 78, No. 1, 2000, pp. 487-498. http://dx.doi.org/10.1016/S0006-3495(00)76611-2

