Current Urban Studies
Vol.05 No.01(2017), Article ID:74550,15 pages
10.4236/cus.2017.51002
An Assessment of Villagers’ Satisfaction with the Quality of Construction-Related Services Based on the SERVQUAL Model
Naser Shafieisabet1*, Behzad Doostisabzi2,3, Shahryar Azharianfar3
1Human Geography Department, Shahid Beheshti University, Tehran, Iran
2Geography & Rural Planning, University of Tehran, Tehran, Iran
3Geography & Urban Planning, Islamic Azad University Central Tehran Branch, Tehran, Iran

Copyright © 2017 by authors and Scientific Research Publishing Inc.
This work is licensed under the Creative Commons Attribution International License (CC BY 4.0).
http://creativecommons.org/licenses/by/4.0/


Received: October 31, 2016; Accepted: February 28, 2017; Published: March 1, 2017
ABSTRACT
Improving the quality of civil services offered to rural areas in order to empower them in terms of the rural development process depends on feedbacks received from the rural residents. Underestimating the viewpoints, demands and expectations of rural residents has brought about many challenges in the process of serving the villages. Therefore, identifying strengths and weaknesses of various aspects of service-rendering quality allows rural planners to achieve the objectives, to implement projects and to cope with the shortcomings. Accordingly, this study was conducted with the aim of analyzing the rural residents’ satisfaction with the quality of the construction-related services in terms of SERVQUAL model. As a descriptive-analytic study, it was conducted on 400 households in Lorestan province villages (southwestern of Iran) by a random sample. Analysis of the average significance and satisfaction in all aspects of SERVQUAL scale indicates a big gap between the expectations and perceptions of the rural residents about the construction-related services provided by the Housing Foundation in terms of aesthetics, reliability, confidence, accountability and empathy. However, in some dimensions of the mentioned five dimensions, some improvements have been reported in contrast to the villages’ condition in the past. However, ignoring the rural residents’ demands has widened the gap between their perception and expectations about the effective services.
Keywords:
Satisfaction, Quality, SERVQUAL Model, Civil Services

1. Statement of Problem
The most important issue addressed in the literature of development in recent decades is the quality of offering services to villagers and paying attention to delivering services with higher quality (Osman & Sentosa, 2013) . Thus, assessing executive and service projects in the level of territorial and regional spaces and providing scientific solutions in this area have helped considerably in improving the quality of the services provided. Evaluation of how to implement projects and provide services needs receiving feedback from the users. Ignoring the demands and expectations of the users also brings about many challenges in the process of serving them. Hence, identifying the strengths and weaknesses of various aspects of services helps the rural planners to achieve the objectives, to execute programs and to compensate its weaknesses (Sureshchandar et al., 2006) .
The quality of services is the most important factor in the success of any organization, as the survival of each organization in a highly competitive environment depends on its ability to offer high-quality services (Al Bassam & Al Shawi, 2011) . Moreover, the user’s satisfaction level of services is assessed through comparing the initial expectations of service quality and their actual quality. Thus, the satisfaction is clearly related with the quality of service (Krivobokova, 2009) . In fact, satisfaction feeling about services is influenced by such factors as people’s previous experience, personal needs and experiences of others. These factors determine the gap between user’s expectations and perceptions of the provided services (Akbaba, 2006) . In this regard, assessment of satisfaction level of rural residents about project implementation and the quality of services provided by the Housing Foundation is an important way to improve its performance in the process of rural development planning in the context of regional and zonal planning. Since improving the quality of project implementation and services provided by the Housing Foundation in terms of land preparation and spatial planning approach is impossible without considering the perspectives, demands and expectations of rural residents, it is necessary to use proper tools to understand the perspective of rural residents and their satisfaction about the constructional services. A proper and efficient tool is “SERVQUAL” tool (Parasuraman et al., 1988) . The research conducted by Parasuraman, Zeithamel, and Berry in 1988 led to the development of this tool, which is a combination of quality and service terms, measuring the gap between the customers’ expectations and perceptions and the services provided.
In comparison with other evaluation models, SERVQUAL model enjoys considerable advantages that justify its application especially for this study. A number of the aforesaid advantages are as follows: 1) owing to its extensive use, SERVQUAL model is known as a benchmark to evaluate different dimensions of quality; 2) validity and capability of this model have been confirmed in a great number of studies. That is, the questionnaire of this model evaluates users’ opinions correctly and the questions of this tool precisely assess service quality; 3) the measurement of the expectations of service users in SERVQUAL is another advantage of this model in quality improvement models; 4) a number of researchers stated that SERVQUAL can be applied according to a regular plan for repeated evaluations as well as comparative benchmarking purposes. This model also enjoys an important superiority, namely its applicability as a tested tool in benchmarking projects (Parasuraman et al., 1988) .
In Iran, there are various organizations active in the planning and implementation of projects in rural areas. They provide such services as preparing and executing rural guide and organizational plans, issuing rural property ownership documents, providing technical services of issuing rural building license, etc. Assessing the satisfaction level of rural residents about the quantity and quality of programs and services helps us to improve this kind of services. Housing Foundation is one of those organizations which provide multiple services in the villages in accordance with the constitutional law and the Iranian government’s policies and programs.
Hence, assessment of the quality of project implementation and construction services offered to the villages of the region under study and the satisfaction level of its rural residents with the services of the Housing Foundation as well as the villagers’ perception on the desired service projects formed the core of this study. Likewise, to answer the most important question of this study, which is to what extent have project implementation and service by the facilitating organizations led to the optimal distribution of resources and improved status of villages, thus bringing about villagers’ satisfaction, SERVQUAL model was used. Parasuraman, Zeithaml and Berry research in 1988 led to the formation of this tool, combination of quality of service terms, and the gap between the expectations and perceptions of the users about the provided services.
Theoretical literature and research background
Satisfaction or dissatisfaction is one of the emotional and physical behaviors of human being that reflects his/her mental perception about his/her environment. Surrounding environment dominates man which in turn affects the human behavior. According to the Kant’s combination theorem, human emotional behavior consists of moods, aspirations of individuals as well as the effects of the environment on human perception. People’s satisfaction of life, implementation of programs, projects and offered services is based on their combined analysis and implementation of the people living conditions with their dreams and aspirations. The more the human being life and socioeconomic is adapted with his dreams, the more satisfied he will be and vice versa. Therefore, since for Kant the knowledge is based on experience and wisdom (Foroughi, 2012) , then it can be said that the epistemological basis of satisfaction, realism and idealism shapes the conceptual system of human subjects. People’s satisfaction reflects psychological state, fatalism and instrumental rationality. So, some researchers have described the steps of satisfaction understanding of people with a perception views. The second category is related to destiny, and the third deals with those who anyway unable to adapt the current situation of residence (Rafiean et al., 2009) . In general, all behavioral principles of human being are relied on two moral feelings and rational action-based and non-rational action-based activities (Haji Hashemi, 2000) .
From this perspective, behavior is either based on human psychological and emotional moods in which mental concerns (aspirations) are crucial, or based on rationality in which people compare the level and quality of their life with the level and quality of others and what accordingly announce their satisfaction or dissatisfaction.
Accordingly, different models may be used in evaluation of resident’s satisfaction in different areas of the operational projects and the services provided to them. According to a type of classification, models used to assess the satisfaction gained from services, users are divided in two types of “objective and subjective”. Objective models are based on the idea that user’s satisfaction is assessed through indicators that are correlated with the intensity of their satisfaction. In contrast, mental models are determined based on the satisfaction level of user’s needs. In other words, these models act based on the user’s perception about their satisfaction. These models take advantage directly of opinions of users and give their satisfaction approach that is closer to their perception (Ganpat et al., 2014) .
Service provider organizations and institutions need to receive feedback from users of their services in order to attract satisfaction of more users and to improve the quality of their services. In this regard, there are numerous models and tools for this purpose, SERVQUAL tool is one of the most popular tools used to assess the gap between service expectations and the actual services provided and understood by consumers. SERVQUAL is a subset of the mental models that considers the perceptions and opinions of customers. According to (Parasuraman et al., 1988) , expectations are determined based on people needs, experiences, and background about service providers, others opinions and external communications (Figure 1). SERVQUAL is one of the models that can assess the quality of service through the gap between the expectations and perceptions of the users. Parasuraman et al., 1988 defined the quality of public services as the difference between people’s perception and expectations. They believe that perception is the quality evaluation of service. However, expectation is the demand users expect from service provider. Received feedbacks from users allow to identify and to prioritize areas where there is a need for ongoing improvement. However, often there is no symmetry between service management knowledge of service recipient’s perceptions and expectations and their real perceptions and expectations
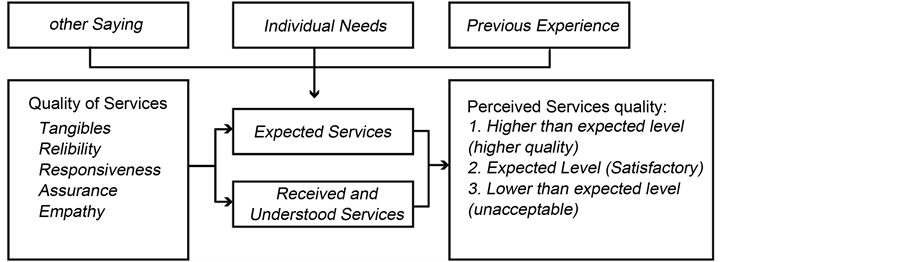
Figure 1. Perceived services quality. Source: Khan and Sue (2003) .
and it may damage the quality of service (Safiek et al., 2011) .
SERVQUAL tool evaluates service quality of an organization in terms of the following five aspects: 1) Tangibles which evaluate the physical and material aspects of the service provider; 2) Reliability that assesses an organization’s ability to deliver Services correctly and in due time; 3) Responsiveness that evaluates the tendency of organizations to assist users and provides faster services to them; 4) Assurance that measures knowledge, politeness and ability of employees to create confidence in consumers; and 5) Empathy that assesses the degree of user’s importance and staff dealing with customers.
In short, the performance of SERVQUAL (Table 1) is based on the fact that the service users are asked to rank their components in terms of their expectations from the offered services and then to rank their perceptions of the actual intended performance or the received services in terms of the same parameters. The two sets of rankings are compared with each other and if the perception is lower than the expectations of users, it indicates a poor quality service or a gap between them. However, on the contrary, if the level of the perceived performance is higher than the expectations of users, it indicates a high level quality service or absence of a gap between them (Parasuraman et al., 1988) . Ultimate goal of the model is guiding the organization towards an excellent performance (Bodvarsson & Gibson, 2002) .
SERVQUAL tool has been criticized frequently, for instance some say that SERVQUAL can only be used to assess the satisfaction level of users of organizations’ Services; whereas, often it cannot be used to measure the satisfaction of products users. “Goodrich and Ramsey” believe that the practical problem of Servqual is the lack of dimensional stability and the analyzed factors regarding the various services and areas in question (Goodrich & Ramsey, 2012) . “Kong and Bradley” believe that in many cases user expectations are idealistic and this exacerbates the gap between expectations and perceptions of services. Therefore, Servqual model suggests that services should be evaluated in three levels ideal, acceptable and perceived (Kang & Bradley, 2002) . Despite the criticisms, Servqual frequently is used in studies to assess the level of satisfaction of users about the organizations services. As today, this tool is widely used to assess the quality of various services.

Table 1. Profile of SERVQUAL model.
Source: Research findings.
Numerous studies have been conducted using SERVQUAL tool, which are different and at times contradictory in terms of their concept, methodology, and analysis of practical problems. However, no research has been conducted so far regarding the quality of construction services provided. Thus, those references were examined in the literature that merely adopted SERVQUAL model to evaluate services. In this respect, a summary of the studies performed regarding service evaluation may be seen in Table 2.
Research literature investigation results using SERVQUAL tool and model indicate that this model has been predominantly used to evaluate the performance of governmental and non-governmental organizations such as hospitals, banks, institutes, universities, etc. It has been rarely used in Iran to assess the performance of the governmental institutes in charge of rural affairs. On this basis, the present study aims to provide a novel research different from that of other researchers on the evaluation of providing service to villages by evaluating and measuring the quality of the services provided to rural population and presenting scientific solutions to improve the service provision status. Therefore, in addition to expanding knowledge in this field, this research can be used by public sector and private sector facilitating organizations to improve their status of service provision to rural population.
2. The Study Area
The region under study is the villages of Lorestan Province located in southwestern Iran (Figure 2). The villages of Lorestan in southwestern Iran have particular geographical conditions. Rural residents are located in these villages in the mountainous and highly uneven area of Zagros Mount Chain. The typical feature of these villages compared with other villages in Iran is their relative distance from Iran’s large cities. The boom of construction activities in the villages
Table 2. A number of studied conducted regarding the evaluation of public sector service quality.
Reference: Exploration of research literature.
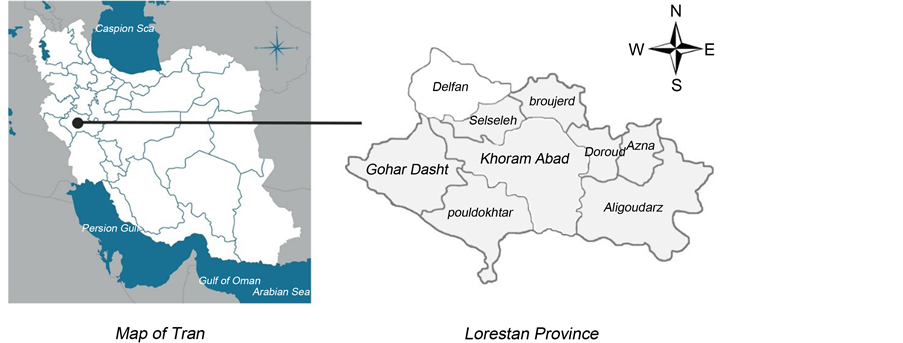
Figure 2. The geographical position of the study area. Source: Iran national statistical center (2012).
of this region in the past two decades and especially after the 8-year Iran-Iraq war adds to the importance of evaluating the quality of the services offered in this region. For this reason, villages of the region were selected for appraising people’s satisfaction rate on the proposed civil services.
3. Methodology
As a descriptive-analytical study, it was conducted in 152 rural settlements of Lorestan Province located in South West of Iran. Statistical population included about all rural households enjoying civil services, according to the data released by Iran Statistical Center in 2012. 400 households were selected randomly by cluster and simple random sampling for large statistical population. They were selected based on the Cochran formula (Soraee, 1996) , with the confidence level of 95% and the ideal accuracy of 5% and variance estimation of 25%. People were questioned directly in this study. The main tool to collect the field data is a SERVQUAL modified questionnaire adjusted based on the literature and initial studies of researchers in order to be coordinated with the original questionnaire in terms and imperatives and rules of the Iran’s Civil Services. Thus, some changes and alterations were applied in the SERVQUAL questionnaire in terms of type and number of items studied here. Accordingly, respondents’ expectations and perceptions from Civil services were evaluated in five dimensions namely tangibles, reliability, assurance, responsiveness and empathy. The questionnaire, in addition to several questions related to the general characteristics of rural respondents has 41 questions that were dealt with in both expectations and perceptions areas. Five options Likert Scale was used in items adjusting. Cronbach’s alpha coefficient was also used to analyze the questionnaire reliability. This amount in expectations is equal to 0.81 and 0.88 in perceptions, which indicates good reliability of the tool. Also, since the SERVQUAL tool is a standard tool, it has a high validity. In order to confirm the validity of questionnaire, thematic experts’ opinions were used; hence necessary corrections were applied. Grading method (Scoring method) to each Likert item was used to analyze the quality of services provided by the Civil Services in the villages and in order to analyze the gap between the expectations and perceptions of respondents in any studied aspect. Since the data were abnormal, Wilcoxon test was used for analyzing the hypotheses and examining whether the gap between the expectations and perceptions of respondents in these five items is significant or just has been caused by other interventions and accidents. Also, to evaluate the relationship between service quality and general characteristics of the respondents, Spearman correlation coefficient was used.
4. Research Findings
The results of the study in rural settlements indicate that out of 400 participants in the research process, the average age of respondents was 39 years. The youngest rural participant was 20 years-old and the oldest one was about 64 years old. Most participants were farmers and ranchers or a combination of both in terms of occupation. Agriculture and animal husbandry form nearly 80 percent of the rural residents’ jobs in Lorestan Province. In terms of income, 62% of respondents had less than one million∙Tomans (USD 332) per month. In general, 85% of the rural residents had a monthly income of less than 1.5 million∙Tomans (USD 498) per month. About 60 percent of the rural residents had primary education and only five percent of them had academic education (Table 3).
Evaluation of the significance and satisfaction averages in any aspect of SERVQUAL scale indicates a large gap between the expectations and perceptions of the rural people about the Civil services; as the resulting difference in the quality is equal to −0.75 in tangibles, −0.89 in terms of reliability, −0.64 in the
Table 3. Distribution of participants according to public properties in the rural settlements (n = 400).
Source: Research finding 2014.
Assurance and −0.80 in empathy. Among the items the largest gap is observed regarding the views of people, follow-up and accelerates the preparation and implementation of the rural Hadi plan and the quality of implementation of the Hadi plan which are −1.24, −1.12 and −1.09 respectively. The Lowest gaps mean −0.47 (Table 4), related to pitying for duties.
Anyway, the descriptive statistics used in this study indicate the gap between expectation and perception of villages on the civil services proposed by the in-charge organization working in the village; and they also show how inferior is the quality of these services for the villagers. On the other hand, appraising the civil services proposed in the villages in question indicate how big is the gap between the general quality of services offered to villagers and their expectations. Regarding outcomes, despite many activities made in villages of the region in question and regarding the poor quality of services offered for residential constructions and quantitative and qualitative renovation of housings, administrative bottlenecks for taking construction license and issuing housing documents and constructions, we see that the proposed services in this field have failed to attract satisfaction of villagers. Likewise, regarding numerous administrative bottlenecks and problems and lack of coordination between relevant organizations, there are several dissatisfactions on condition, timing and amount of loans and banking facilities for repairing, renovation and construction of new housing constructions and buildings etc. moreover, there is dissatisfaction on implementing the basic projects and transferring lands and supervising constructions. As since the government and its organizations have failed to complete the project in the due time, villagers have lost their confidence. Moreover, still the villagers living in the areas studied by this study have not succeeded to start a proper relationship with authorities and executives of the civil projects. For this, the rural residents have no trust in commitment of the project executives. It resulted in a big gap between expectation and perception of rural residents. Likewise, since the executive and contractors working in the rural projects had low experience and knowledge, the rural villagers have not enough trust and confidence on successful implementation of projects. In fact, regarding the improper implementation of projects, the residents of the villages in question had not trust in the quality of knowledge and skill of the executives. Similarly, for accountability, the rural residents were dissatisfied because they think that their viewpoints are not considered in implementing the projects, especially the basic and organizing projects. For this reason, since the viewpoint and expectations of rural residents are underestimated we seen dissatisfaction during planning, prioritizing and implementing projects, as well. As underestimating the viewpoints and expectations of people during implementing projects, in attention to the various rural groups and inattention to people’s ideas and expectations have left projects incomplete, which has made villagers dissatisfied more than ever.
To assess and make sure that the gap between the expectations and perceptions of respondents in five evaluated contexts are not the result of occupation and interfere with other factors, regarding the abnormal distribution of data in
Table 4. The mean scores of importance and satisfaction of respondents in rural areas (n = 400).
Source: Research finding 2014.
rural settlements in the study area according to Shapiro and Kolmogorov- Smirnovtests, Wilcoxon test was used. Test results indicate that the overall quality of the provided services and terms of tangibles, reliability, assurance, responsiveness and empathy between perception and rural respondent’s expectation was significant at 99% (Table 5).
In order to evaluate the effect of respondent’s characteristics and education in their quality assessment of services provided by the responsible agencies, with establishment of Spearman the correlation between these attributes was examined with different aspects of service quality. Accordingly, a negative and significant relationship was found between “tangibles qualities” and “education” in 99% of cases. In fact, with increasing education and awareness of villagers, their satisfaction about services is decreased. Similarly, there was a significant negative relationship between “tangibles qualities” and “income” in 95 percent of cases (Table 6).
In addition, a significant negative relationship was found among “responsibility”, “income” and “literacy”, “quality of empathy” and “income” and “literacy”, and “quality of service” and “literacy” in 95% of cases.
5. Conclusions and Recommendations
Assessment of Civil services in the villages indicates the gap between the overall quality of services provided to the villagers and their expectations. In tangibles
Table 5. Level of significance test of difference between expectations and perceptions of service quality dimensions.
Source: Research finding 2014.
Table 6. Public variables studied correlation with quality of service.
Source: Research finding 2014.
(especially in the way of implementation of Hadi plan), there was a significant difference between significance and satisfaction of respondents, and in other cases, such as consent on rural construction, the possibility of using banking facilities and repairing and reforming the housing, this gap and dissatisfaction were higher than other items. In terms of reliability, yet rural residents failed to establish proper communication with construction projects trustees and operators. For this reason, the villagers don’t have enough trust in accountability of project’s executives in the implementation of Hadi plans. This develops a gap between the expectations and perceptions of the rural people on this item. Also in confidence tab, the difference is evident between expectations and perceptions of the villagers and dissatisfaction in this is more evident about the expertise and knowledge. Due to the poor implementation of projects, the villagers do not have necessary assurance on the executive’s knowledge and skills. In the same direction, in accountability dimension, rural residents showed their dissatisfaction with the fact that their ideas are not considered in projects, particularly in Hadi plans. Likewise, in empathy aspect, ignoring the views of the people and their demands and comments, and lack of care to rural peoples caused the project to be unfinished and be released without necessary follow-up. Also, inattention to the rural poor has caused most dissatisfaction in the studied areas (Table 7).
This study reached similar conclusions when compared with the findings of Lgsvych, BTShaykh, Nazemy and Pedramnya. Thus, the gap between all above mentioned five aspects has been reported repeatedly. In Lgsvych, Nazemy and Pedramnya great gap was found among the five items. However, a big gap was found in this study between five aspects, and the largest gap was observed in the “responsiveness”. This reflects that the responsible agencies give a weak performance in relation to its duties in this part and less attention to cases such as accelerating the implementation of programs, notification of regulations, paying attention to public opinion, amount of responsiveness in times of crisis, and timely issuance of permits for the rural building etc.
The results of correlation analysis showed that with increasing the income and education level of rural residents, the expectations went higher. Also, with increased information and awareness through mass media the expectations gradually have increased in the studied areas. And the traditional distance between the urban and rural areas has disappeared in this respect. This is due to increasing demands and expectations of villagers about the civil service. Therefore, it is
Table 7. Research finding in rural settlements of the region under study.
Source: Research finding 2014.
essential that the organizations that provide services to the rural population pay attention to developments in the field of promoting knowledge and information to rural residents about the quality of the environment and rural life.
It is noteworthy that planning in Iran on the basis of a rational, technical- oriented approach (technical, instrumental, and with the greatest importance placed on experts) and failing to pay attention to the villagers’ demands in construction plans and their implementation have led to the dissatisfaction of villagers and a deep gap between the status quo and the desirable status.
Therefore, since the aim of this study was to assess the quality of programs, implementation of civil projects to improve the satisfaction of rural residents, optimal distribution of resources and services, and ultimately improve the quality life of villagers in the region under study area, following actions based on the findings and results are recommended to improve service to villages:
1) Considering local knowledge, demands, tendencies, a moral feeling, and people’s opinions and considering as the most important factor the people and their needs in planning, designing, prioritizing projects, implementing plans and providing services to the rural population.
2) Paying attention to a more desirable timing in the planning and implementation of plans and providing circumstances where all villagers can contribute to the implementation process of service provision projects, thus being able to use the construction services and credit facilities of banks and official credit institutions (such as getting loans for building and improving the housing) in a similar, transparent manner.
3) Revision of the project implementation and service provision process to the villages and changing the planning and construction project implementation approach and a transition from the implementation of state-run construction projects with a rational, technical-instrumental approach to a society-oriented approach in order to reduce the gap between existing perceptions and the expectations of villagers regarding the five-fold dimensions of SERVQUAL.
Cite this paper
Shafieisabet, N., Doostisabzi, B., & Azharianfar, S. (2017). An Assessment of Villagers’ Satisfaction with the Quality of Construction-Related Services Based on the SERVQUAL Model. Current Urban Studies, 5, 20-34. https://doi.org/10.4236/cus.2017.51002
References
- 1. Akbaba, A. (2006). Measuring Service Quality in the Hotel Industry: A Study. International Journal of Hospitality Management, 25, 170-192.
https://doi.org/10.1016/j.ijhm.2005.08.006 [Paper reference 1] - 2. Al Bassam, T., & Al Shawi, S. (2011). Analyzing the Use of the SERVQUAL Model to Measure Service Quality in Specific-Industry Contexts. www.wbiconpro.com/443-Tameem.pdf [Paper reference 1]
- 3. Alirezaee, A., & Amini, A. (2009). Evaluation and Quality Analysis Services Using Servqual Method. Islamic Research Center of Mash’had City, 3, 1-24. [Paper reference 1]
- 4. Bodvarsson, O. B., & Gibson, A. (2002). Tipping and Service Quality: A Reply to LYNN. The Social Science Journal, 39, 471-476. [Paper reference 1]
- 5. Cerry, S. (2012). Assessing the Quality of Higher Education Services Using a Modified Servqual Scale. Annals Universities a pulensis series Oeconomica, 14, 664-679. [Paper reference 1]
- 6. Foroughi, M. A. (2012). Philosophy Course in Europe (2nd Edition). Tehran: Zavareh. [Paper reference 1]
- 7. Ganpat, W., Ramdial , R., & Narine, L. K. (2014). Farmers’ Satisfaction with the Extension Service in Trinidad, West Indies. Miami, FA: Association for International Agricultural & Extension Education. [Paper reference 2]
- 8. Goodrich, K., & Ramsey, R. (2012). Are Consumers with Disabilities Receiving the Services They Need. Journal of Retailing and Consumer Services, 19, 88-97.
https://doi.org/10.1016/j.jretconser.2011.09.004 [Paper reference 1] - 9. Haji Hashemi, S. (2000). Development and Underdevelopment: Way of Thinking and Rationality Method in the Development Context (2nd Edition). Esphehan: Vapasan. [Paper reference 1]
- 10. Kang, H., & Bradley, G. (2002). Measuring the Performance of IT Services: An Assessment of SERVQUAL. International Journal of Accounting Information Systems, 3, 151-164.
https://doi.org/10.1016/S1467-0895(02)00031-3 [Paper reference 1] - 11. Khan, M. M., & Su, K. D. (2003). Service Quality Expectations of Travellers Visiting Cheju Island in Korea. Journal of Ecotourism, 2, 114-125. [Paper reference 1]
- 12. Krivobokova, O. V. (2009). Evaluating Customer Satisfaction as an Aspect of Quality Management. World Academy of Science, Engineering and Technology, 53, 565-568. [Paper reference 1]
- 13. Kumra, R. (2008). Service Quality in Rural Tourism: A Prescriptive Approach. [Paper reference 1]
- 14. Kwek, C. L., Lau, T. C., & Tan, H. P. (2010). Education Quality Processes Model and its Influence on Students Perceived Service Quality. International Journal of Business and Management, 5, 154-165. [Paper reference 1]
- 15. Legcevic, J. (2009). Quality Gap in Educational Services in Viewpoints on Students. Economic Thought and Practice, 18, 279-298. [Paper reference 1]
- 16. Markovic, S., & Jankovic, S. R. (2013). Exploring the Relationship between Service Quality and Customer Satisfaction in Creation Hotel Industry. Tourism and Hospitality Management, 19, 149-164. [Paper reference 1]
- 17. Nazemi, S., & Pedramnia, S. (2009). Analysis of the Quality of Services with SERVQUAL Method, Case Study: Urban Green Space Mashhad City. [Paper reference 1]
- 18. Osman, Z., & Sentosa, I. (2013). Service Quality and Customer Loyalty in Malaysian Rural Tourism: A Mediating Effect of Trust. International Journal of Marketing Practices, 1, 31-42. [Paper reference 2]
- 19. Parasuraman, A., Zeithaml, A. V., & Berry, L. A. (1985). A Conceptual Model of Service Quality and Its Implications for Future Research. The Journal of Marketing, 41-50. [Paper reference 1]
- 20. Parasuraman, A., Zeithaml, A. V., & Berry, L. A. (1988). SERVQUAL: A Multiple Item Scale for Measuring Consumer Perceptions of Service Quality. Journal of Retailing, 64, 12-40. [Paper reference 5]
- 21. Parasuraman, A., Zeithaml, A. V., & Berry, L. A. (1991). Refinement and Reassessment of the SERVQUAL Scale. Journal of Retailing, 67, 420. [Paper reference null]
- 22. Parasuraman, A., Zeithaml, A. V., & Berry, L. A. (1993). The Nature and Determinants of Customer Expectations of Service. Journal of the Academy of Marketing Science, 21, 1-12. [Paper reference null]
- 23. Parasuraman, A., Zeithaml, A. V., & Berry, L. A. (1994). Reassessment of Expectations as a Comparison Standard in Measuring Service Quality: Implications for Further Research. The Journal of Marketing, 111-124. [Paper reference null]
- 24. Rafiean, M., Asgari, A., & Asgari Zadeh, Z. (2009). Measuring Satisfaction Nawab Residential Neighborhood. Human Geography, 14, 53-68. [Paper reference 1]
- 25. Safiek, M., Yaleakho, A., & Mamat, I. (2011). Municipal Service Quality and Citizen Satisfaction in Southern Thailand. Journal of Public Administration and Governance, 1, 122-137. [Paper reference 1]
- 26. Sharma, J., & Narang, R. (2011). Quality of Healthcare Services in Rural India: The User Perspective. Vikalpa, 36, 51-60.
https://doi.org/10.1177/0256090920110104 [Paper reference 1] - 27. Soraee, H. (1996). Introduction to Survey Sampling (2nd Edition). Tehran: SAMT Publication. [Paper reference 1]
- 28. Sureshchandar, G., Rajendran, C., & Anantharaman, R. (2006). The Relationship between Service Quality and Customer Satisfaction—A Factor Specific Approach. Journal of Services Marketing, 16, 363-379.
https://doi.org/10.1108/08876040210433248 [Paper reference 1]