Current Urban Studies
Vol.04 No.01(2016), Article ID:64292,14 pages
10.4236/cus.2016.41002
Detecting the Shallow Subsurface Chinks below Buildings of District No. 27 at 15th May City Using ERT, and SSR, Helwan, Egypt
Alhussein Adham Basheer
Geology Department, Faculty of Science, Helwan University, Cairo, Egypt

Copyright © 2016 by author and Scientific Research Publishing Inc.
This work is licensed under the Creative Commons Attribution International License (CC BY).
http://creativecommons.org/licenses/by/4.0/


Received 26 February 2016; accepted 5 March 2016; published 8 March 2016
ABSTRACT
In 1986, the Egyptian government planned 15th May City, which is located in the southeast of Helwan city. It is considered one of the most propitious cities that pull out the residents who live around the Nile valley in Egypt. This study examines the district No. 27. The chief aim of this paper is to identify the chinks in the near subsurface layer under buildings and calculate approximately its displacement to attain its reasons. This research uses shallow seismic refraction and two- dimension electrical resistivity surveys. The three-dimension electrical imaging method is interpreted in the form of the geoelectric layers’ depths and thicknesses. Accordingly, the interpretation proposes sequences of three layers. Moreover, the borders of the crack can be noticed. The results of shallow seismic refraction method show the same sequences of three seismic layers. The interpreted layers from both techniques are dried limestone “calcite to dolomite” layer; the second is wetted Marley limestone; and the third Layer is semi-wetted Marley limestone. Alternatively, these parameters separate the location into layers of dissimilar competence nature and dissimilar appropriateness. The interpretation of both methods delineates five chinks or cracks. These chinks extend in the study area. These chinks can be watched by naked eyes in the buildings close to the area of the study. This study recommends getting rid of the gardens that is located between buildings to avoid the negative effect of irrigation water.
Keywords:
ERT, SSR, 15th May City, Egypt

1. Introduction
The City of 15th May covers an area of about 18 km2. It is revealed between latitudes 29˚50'9''N and 29˚50'11''N and longitudes 31˚22'25''E and 29˚22'31''E (Figure 1). The city, as an inhabited one, has many buildings that are dedicated to factories and workers’ dwelling and the city has also motive trucks. Some buildings, in specific districts, suffer from cracks. This study tries to find the reason of these cracks. The district No. 27 is chosen for this study to detect the reasons of this problem.
This study uses the two-, three-dimension electrical array (R2D & R3D), and shallow seismic refraction “SSR” surveys. It helps in detecting any credible or interrupted shallow structural features. The integrated interpretation of the techniques classifies the subsurface into three layers with noticed chinks over all the study area.
2. Geological Setting
2.1. Surface Geology
Abbas (1953), Shukri (1953), Said (1962, 1971), Farag and Ismail (1955, 1959), Ismail and Farag (1960), Moustafa et al. (1985) , and Strougo (1985) discussed the geology of Helwan area in general and 15th May city especially. These studies, with field notes of the author, define the foundations of the discussion around the study area; that handles the geology, the geomorphology, stratigraphy, and the structure. Figure 2 is the geological map of east Helwan including the study area.
2.2. Stratigraphy
Cuvillier (1924a, 1924b, 1930), Awad and others (1953), Shukri (1953), Farag and Ismail (1955, 1959), Ismail and Farag (1960), Said (1962, 1971), Tadros (1968), Ghobrial (1971), Strougo (1976, 1979), and Moustafa et al. (1985) studied the stratigraphical item at some zones of the study area. Middle Eocene, Upper Eocene, and Oligocene rocks crop out in the mapped area. A number of classifications are related to the Eocene rocks in the special parts of the study area. The traditional classifications of G. Mokattam and east of Helwan are shown in Table 1.
Figure 3 shows nine stratigraphic sections that are located in different parts of the study area. They are linked, based on lithologic and faunal similarities, in order to have only one set of rock units that can be used in every part of the study area and also to be used for building the geological map.

Figure 1. General location map of the study area.

Figure 2. Geological map of 15th May area, compiled from the Geological Survey of Egypt (1983).

Table 1. G. Mokattam and east of Helwan’s Eocene rock units (after strougo, 1985 and Moustafa et al., 1985 ).
A short report of the mapped rock units is given below. The complete description of these units is given as follows (Strougo, 1976; Moustafa et al. 1985) .
3. Data Acquesition
3.1. Electrical Imaging Survey in Two- and Three-Dimension
The 2-D and 3-D imaging surveys overcome the changes of resistivity in both the horizontal and the vertical ways along the survey line. Therefore, the 2-D geo-electrical imaging technique is selected for the survey. While the Wenner array gives the least number of probable data compared to the other common arrays (Griffiths & Barker, 1993) . It is also has the ability to work in noisy fields and when fine vertical resolution is necessary. The Wenner array has been used in this study.
Eight geo-electrical profiles with 72 m length for every one spread over the spot area (Figure 4). The survey uses 73 multi-electrodes system linked to SYSCAL R2 resistivity meter through a multi-core cable.

Figure 3. Lithological sections of Helwan area; (after Strougo, 1986).

Figure 4. Location map of the study area shows “ERT” and “SSR” profiles.
3.2. Shallow Seismic Refraction Survey
Seismic exploration involves generation of seismic waves and recording the arrival times of these waves from the source to the series of geophones (Dobrin, 1976) . Seismic refraction method is very useful as an investigation tool in lately explored areas, chiefly in engineering schemes.
The seismic refraction data obtained along eight shallow seismic refraction profiles spread over the same part planned for the R2D and R3D resistivity imaging survey. The survey uses 72 channels signal enhancement seismograph “GEOMETRICS SMARTSEIS” along 72 m length profiles (Figure 4).
4. Data Interpretation
4.1. R2D and R3D Geo-Electrical Imaging
The computer softwares RES2DINV and RES3DINV, edited in 1998, (Loke, 2000, 2002) are used to interpret resistivity data, and these programs have the ability to:
1) Calculate the parameters such as (depth, and resistivity under each electrode) of different layer.
2) Draw the electric cross sections along each recorded profile in the study area.
Three layers can be defined in the study area according to the general view up of the constructed cross sections. The surface layer consists of weathered and dried limestone (mainly Dolomite). The second layer consists of fractured and structured wetted Marley limestone; this layer appears as dotted layer with low Resistivity values related to fractures in layer which filled up by water. The third layer consists of semi-wetted Marley limestone with moderated low Resistivity values.
Figure 5 shows the geoelectric cross sections constructed over this area. The noted feature is classified as a cracks or chinks, it is clear that these chinks are shown at distances 3.5, 4.5, 25.5, 30.5, and 55.5 m from the first electrode. It can be noted that its dimension reaches the maximum diameters in profile number “8”. The effects of the cracks extended to the third layer around it. There is a shift in displacement that differ from profile 1, 6, and 8, the cracks outline at distances 16, 20, 48, and 76 m from the first electrode.
4.2. SSR Data Interpretation and Discussion
Computer program SEIPEEDIT (2002) has been used to treat the data to build the travel time curve, in which the time of the first arrival is plotted versus the geophone, offset distance. The layer’s parameters (thickness, depths, and the different velocities beneath each geophone) have been calculated to create geo-seismic cross sections (Figure 6).
The mainly interpretation for profiles are based on the profiles done on the normal and middle shooting position and they are compared with the Reverse ones. The interpretation is made to avoid the confused data and output signals caused by cracks that contain incoherent materials filled with air. These air-filled materials weaken waves (Figure 7).
The inspection of the constructed seismic cross sections can lead to the similar result to the R2D and R3D. The study area consists of three seismic layers with highly observed five cracks as features that can be noticed over the seismic lines from 1 to 8. Figure 8 and Figure 9 represent the Time-Distance curve and the interpretive lithological reading respectively of profile 1 as an example of these lines. The same result can be also noted in Figure 9, Figure 10, and Figure 11 for (P-wave velocity, SH-wave velocity, and Slandered Penetration Test) as cross-section profiles; as Figure 12, Figure 13, and Figure 14 present it as 3D maps.
Sudha et al. (2009) presented a linear correlation between SPT N-value and the transverse resistance (T) that is given by equation:
 (1)
(1)
where ρi and hi is the resistivity and thickness of ith layer.
Finally, a comprehensive interpretation of the R2D, R3D and the SSR data can lead to define five sites lines of cracks or chinks (Figure 15); these chinks are illustrated from south western part to north eastern part over all the study area.
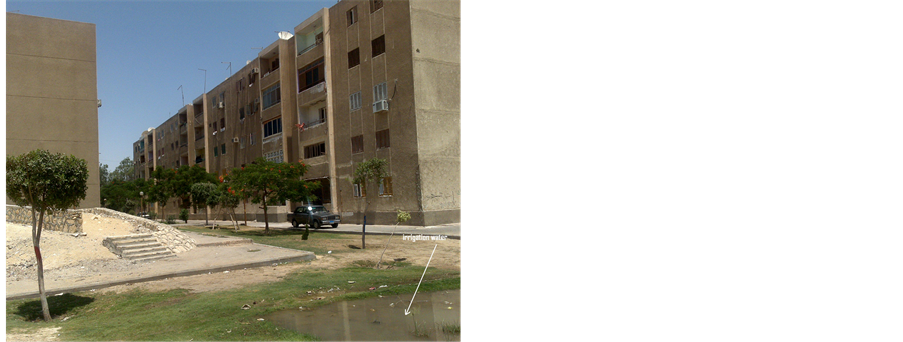
The chinks come out as a result of the irrigation water (used in garden). This water seeps into the subsurface layers. Clay minerals in the second and third layers “Marley Limestone” are saturated with water in the winter and they stay nearly stable. When the hot weather of summer appears, the subsurface layers drive out water by evaporation. This operation, in addition to the loads of buildings, produces the chinks features which cause splits in the buildings.
 (a)
(a)
 (b)
(b)
Figure 5. (a) R2D of the study area with over measured surface shows the geoelectrical cross sections along profiles 1, 6, and 8; (b) R3D of the study area shows the geoelectrical cross sections along the study area.

Figure 6. Velocity estimation using the slope method calculation with shot point and geophones array in field (after Basheer, 2003).
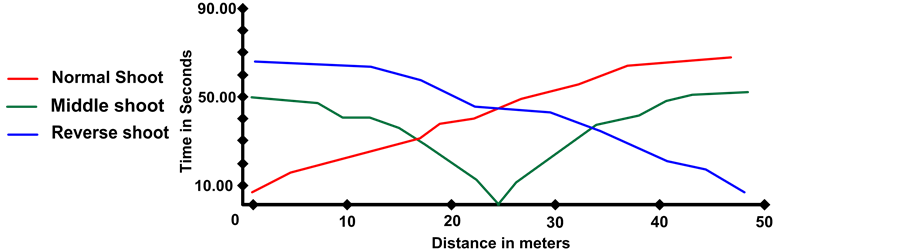
Figure 7. Time-Distance curves along profile “1”.
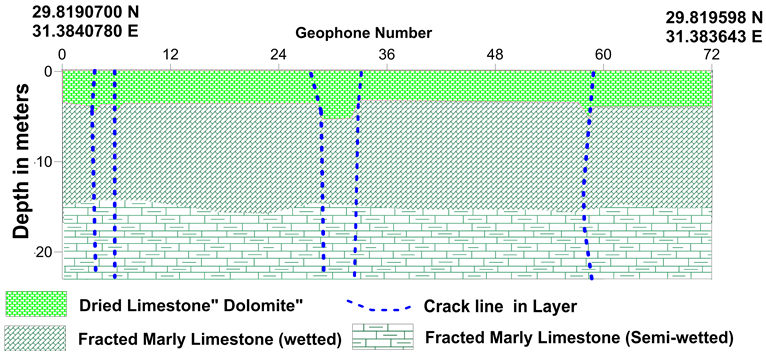
Figure 8. The lithological layers interpreted from the seismic data of the profiles.

Figure 9. The P-waves distribution along profiles in two dimensions.

Figure 10. The SH-waves distribution along profiles in two dimensions.

Figure 11. The Standard Penetration Test “N-values” distribution along profiles in two dimensions.
5. Conclusions
The present study has been conducted mainly to detect the site of the chinks and provides an interpretation of the data in terms of the foundation rock materials and parameters.
The study involves carrying out three main geophysical techniques integrately; the first technique embraces executing two- and three-dimension of electrical resistivity imaging survey in the form of eight parallel profiles. These profiles are distributed over a suggested portion of the study area where the bad effects on building are noticeable. The Wenner’s electrode arrangement with maximum spread of 72 m, 1 m between the electrodes and 0.5 m interline distance is used utilizing the SYSCAL R2 system. The second techniques depend on the same last techniques with another processing and presentation; three-dimension electrical resistivity imaging gives a formed shape. The third technique of the study depends on the analysis of the acquired seismic refraction data using eight shallow seismic refraction profiles spread over the same sites of R2D and R3D profiles. In the survey, the velocities of the P- and SH-wave have been specified with interpreted standard penetration test (N-values). Most interpretations of seismic profiles have been made on normal and middle shooting position types to avoid the effect of blind layer that causes the attenuation of waves. Through the R2D and R3D survey, the penetrated depth reached about 30 m while the penetrated depth using the SSR varied from 22 m under geophone No. 16 of profile 5 to 23.3 m under geophone 22 of profile 2.
The integrated results, obtained from the interpretation of the R2D, R3D, the SSR records and calculated N-values, can be classified lithologicaly into three layers invaded with five structural features as subsurface cracks or chinks (Figure 15). These layers from the top to the bottom (according to geo-electrical values, shallow seismic refraction waves’ values, interpreted N-values, and the known geological column in the area) are classified as follows:
1) Top soil layer consists of weathered limestone (mainly Dolomite); its thickness varies between about 3.5 m and about 5 m.
2) Wetted Marley limestone with thickness varies from 10.3 m to 10.33 m.
3) Semi-wetted Marley limestone.


Figure 12. The distribution of the P-waves in three dimensions profiles and maps (Logarithmic scale).


Figure 13. The distribution of the SH-waves in three dimensions profiles and maps (Logarithmic scale).


Figure 14. The standard penetration test “N-values” distribution along profiles in three dimensions profiles and maps (logarithmic scale).

Figure 15. Direction and spread of cracks lines over the studied area.
 (a) (b)
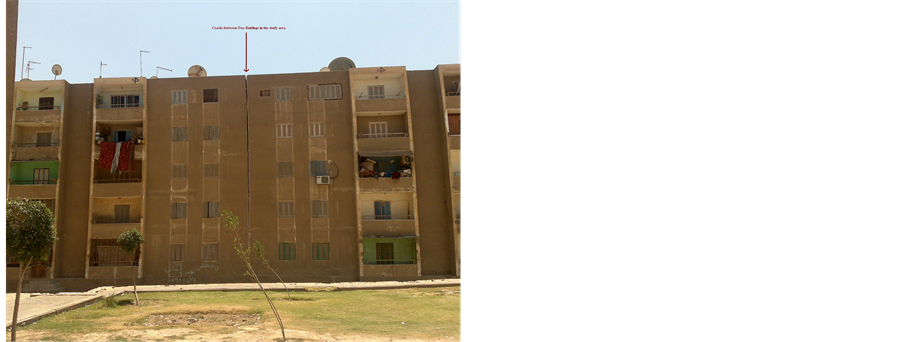
Figure 16. (a) Crack between two sides of building in the study area; (b) The water pool used in the irritation of garden between buildings in the study area.
Five chinks or fractures have been outlined by the interpretation of these three techniques. These features spread all over the study area. They have also been organized and noticed by eyes in the buildings near the study area (Figure 16). It is recommendable to remove the gardens between buildings to avoid the effect of irrigation water (used in garden’s watering) and keep it away.
Acknowledgements
I would like to thank the personnel in the authority of 15th May City, because they considered the results of this research seriously by evacuating residents of the two buildings No. 13, and 14 and removing these buildings (depending on the results and the recommendations of this work). Great thank to Dr. Nihal Adel for her language review in this research.
Cite this paper
Alhussein AdhamBasheer, (2016) Detecting the Shallow Subsurface Chinks below Buildings of District No. 27 at 15th May City Using ERT, and SSR, Helwan, Egypt. Current Urban Studies,04,9-22. doi: 10.4236/cus.2016.41002
References
- 1. Awad, G. H., Faris, M. I., & Abbas, H. L. (1953). Contribution to the Stratigraphy of the Mokattam Area East of Cairo. Bulletin de l’Institut du Desert d’Egypte, 3, 106-107.
- 2. Basheer, A. A. (2003). Application of Geophysical Techniques at New Qena City. Qena: Master Degree in Geophysics, Faculty of Science in Qena, South Valley University.
- 3. Cuvillier, J. (1924a). A Conglomerate in the Nummulitic Formation of Gebel Mokattam, near Cairo. Geological Magazine, 64, 522-523. http://dx.doi.org/10.1017/S001675680010442X
- 4. Cuvillier, J. (1924b). Contibution a l’etude geologique du Mokattam. Bulletin de l’Institut d’Egypte, 6, 94-102.
- 5. Cuvillier, J. (1930). Revision du Nummilitique Egyptien. Memoires de l’Institut d’Egypte, 16, 371.
- 6. Dobrin, M. B. (1976). Introduction to Geophysical Prospecting (3rd ed., pp. 25-56, 292-336, 568-620). New York: McGraw Hill Book C.
- 7. Farag, I. A. M., & Ismail, M. M. (1955). On the Structure of the Wadi Hof Area (North-East of Helwan). Bulletin de l’Institut du Desert d’Egypte, 5, 179-192.
- 8. Farag, I. A. M., & Ismail, M. M. (1959). Contribution to the Stratigraphy of the Wadi Hof Area (North-East of Helwan). Bulletin of Faculty of Science. Cairo University, 34, 147-168.
- 9. Ghobrial, G. A. (1971). Geological Studies in the Area East of Maadi. M.Sc. Thesis, Cairo University, 114.
- 10. Griffiths, D. H., & Barker, R. D. (1993). Two-Dimensional Resistivity Imaging and Modeling in Areas of Complex Geology. Journal of Applied Geophysics, 29, 224-226. http://dx.doi.org/10.1016/0926-9851(93)90005-J
- 11. Ismail, M. M., & Farag, I. A. M. (1960). Contribution to the Stratigraphy of the Area East of Helwan (Egypt). Bulletin de l’Institut du Desert d’Egypte, 7, 95-134.
- 12. Loke, M.H. (2000). Time-Lapse Resistivity Imaging Inversion. Proceedings of the 5th Meeting of the Environmental and Engineering, Geophysical Society European Section, Em1.
- 13. Loke, M. H. (2002). 2-D and 3-D Electrical Imaging Surveys. http://www.geotomosoft.com
- 14. Moustafa, A. R., El-Nahhas, F., & Abdel Tawab, S. (1985). Structural Setting of the Area East of Cairo, Maadi, and Helwan. Middle East Research Center, Ain Shams University Scientific Research Series, 5, 40-64.
- 15. RES2DINV Program Version 3.55.49. Copyright (1995-2006). Geotomo Software. www.geoelectrical.com
- 16. RES3DINV Program Version 3.55.49. Copyright (1995-2006). Geotomo Software. www.geoelectrical.com
- 17. Said, R. (1962). The Geology of Egypt (p. 377). Amsterdam: Elsevier Pub. Co.
- 18. Said, R. (1971). Explanatory Notes to Accompany the Geological Map of Egypt. Geological Survey of Egypt, 3, 89-105.
- 19. SEIPEEDIT Program Version 6.23 (2002). Seismic Interpretation Program Software. New York: OHOO Company. http://www.seismicimageprocessing.com/
- 20. Shukri, N. M. (1953). The Geology of the Desert East of Cairo. Bulletin de l’Institut du Desert d’Egypte, 3, 89-105.
- 21. Strougo, A. (1976). Decouverte d’une discontinuite de sedimentation dans l’ Eocene superieur du Gebel Mokattam (Egypte). Bulletin de la Societe Geologique de France, 5, 213-215.
- 22. Strougo, A. (1979). The Middle Eocene-Upper-Eocene Boundary in Egypt. Annals of the Geological Survey of Egypt, 9, 454-469.
- 23. Sudha, K., Israil, M., Mittal, S., & Rai, J. (2009). Soil Characterization Using Electrical Resistivity Tomography and Geotechnical Investigations. Journal of Applied Geophysics, 67, 74-79. http://dx.doi.org/10.1016/j.jappgeo.2008.09.012
- 24. Tadros, S. F.(1968). Geologic, Palentologic and Economic Studies on Some Rocks from Mokattam Area (p. 244). MSc Thesis, Cairo: Ain Shams University.