World Journal of Nuclear Science and Technology
Vol.07 No.01(2017), Article ID:73080,9 pages
10.4236/wjnst.2017.71002
Control Rod Calibration and Worth Calculation for Optimized Power Reactor 1000 (OPR-1000) Using Core Simulator OPR1000
Nguyen An Son1, Nguyen Duc Hoa1, Tran Trung Nguyen1, Tran Quoc Tuan1, Osvaldo Camueje Raul2
1Dalat University, Da Lat, Vietnam
2Agostinho Neto University, Luanda, Angola

Copyright © 2017 by authors and Scientific Research Publishing Inc.
This work is licensed under the Creative Commons Attribution International License (CC BY 4.0).
http://creativecommons.org/licenses/by/4.0/


Received: November 10, 2016; Accepted: December 25, 2016; Published: December 28, 2016
ABSTRACT
Control rod is used to change the power in nuclear reactor. Certainly, the core at any moment can be made subcritical condition and shut downs when occurring to emergency instance in the core. The rod is grouped based on their function and located at different places in the core where their feature is maximized. Two methods of control rod calibration are the asymptotic period method and the rod-drop method, which were applied in this experiment. In the first method, the reactor is made supcritical by inserting the control rod to be calibrated a certain level. The rod drop method is to determine the subcritical; at the critical state, the rod to be calibrated is dropped into the core, and the resulting decay of neutron flux is observed and related to the reactivity. In this paper, the regulating rod will be calibrated according to the reactivity in OPR-1000 that corresponds to a certain control rod insert or withdraw, and the reactivity in power reactor depends on the integral and differential control rod group too. The core simulator OPR1000 is used to test those methods.
Keywords:
Control Rod, The Asymptotic Period Method, The Rod-Drop Method, Core Simulator OPR1000

1. Introduction
Core simulator OPR1000 is core nuclear power plant OPR1000 simulation. OPR1000 simulator for ShinKori-Unit 1, which will be operated at 2815 MWt, is being developed while the ShinKori-Units 1 and 2 are being built. OPR1000 simulator adopted the RELAP5 R/T code which ran in real-time mode. OPR1000 is the optimal multi-faceted, such as: time, the capacity to change the placement of the controls, temperature, power distribution and boric acid concentration [1] .
The OPR1000 core consists of 177 fuel assemblies, which include 73 control element assemblies (CEAs), and 45 in-core instrument (ICI) thimbles. The core configuration is shown in Figure 1. The control rods are made of boron carbide which has ninety percent of control rod axial length is composed of B4C, and 10% of control rod length at the bottom part of it is composed of DyTi. The groups A and B are shutdown bank. The 5 groups (from 1 to 5) are regulating bank that controls the neutron flux, and the group P is part-strength that is used for manually positioned in the core [2] .
The asymptotic period method is frequently used to calibrate control rods, which are derived from the diffusion theory. It approximately requires two minutes for the transients to die to within 1% of the asymptotic period for periods less than 300 seconds [3] [4] . The stable period is watched by the linear power meter. The reactor reaches to the original critical power by inserting one control rods. The procedure is repeated until all control rods are calibrated.
The rod-drop method is used to reactivity determination [5] [6] [7] [8] . This method is based on the transient response of the reactor to a rapid time variation due to the reactor is in a critical state during the dropping of the reactor control rods.
2. Calculation Methods
2.1. Calibration Methods
The control rod moves vertically parallel to the z-axis of the cylindrical core as Figure 2. The neutron flux density can be written as [9] [10] :
 (1)
(1)
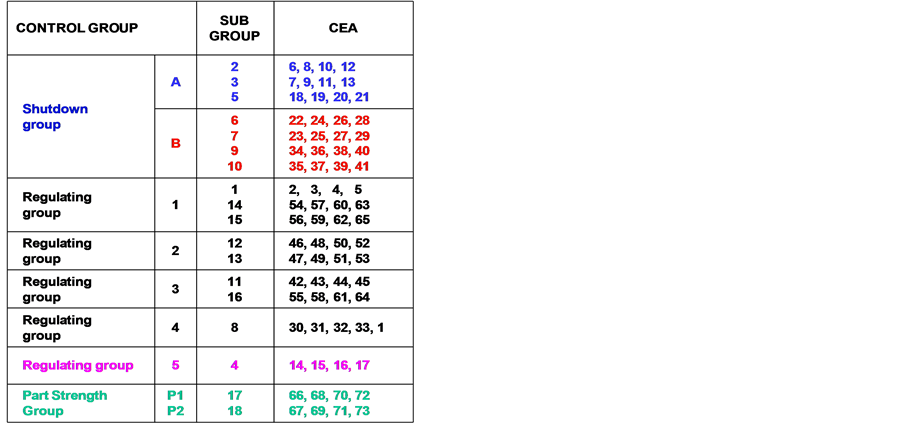
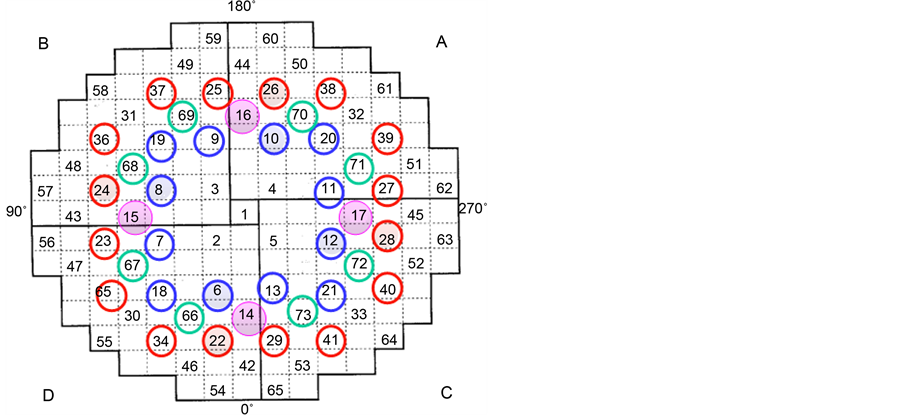
Figure 1. The OPR1000 reactor core configuration.
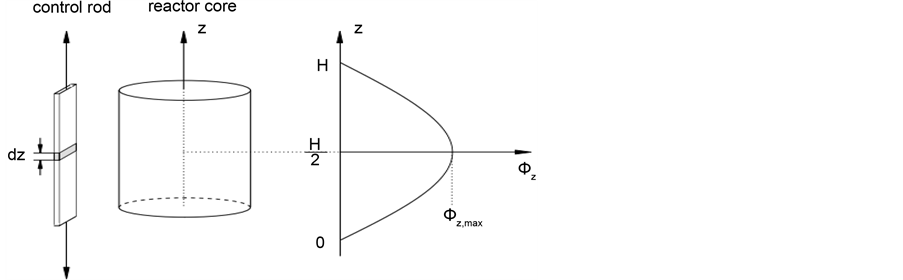
Figure 2. Cylindrical reactor core with control rod and axial neutron flux density distribution.
H is the height of the core. The number of free neutrons decreases in reactivity which is caused by a differential rod slice dz being located at the position z is the larger:
- The maximum neutron flux  at the position z;
- The larger the macroscopic absorption cross section Σa;
- The larger the neutron flux density  at the position z;
- The longer the slice dz is.
The total probability of neutron product is depended on control rod position. The reactivity in the reactor is linear neutron product. So the differential reactivity  can be written [9] [10] :
 (2)
(2)
This equation for the differential control rod characteristic is:
 (3)
(3)
C is a constant of proportionality. A control rod is moved into the reactor core by a finite length ∆z = z2 − z1will be changed the reactivity by:
 (4)
(4)
Integration over the whole rod length up to the position z is the following function:
 (5)
(5)
So the neutron flux distribution can be written:

and up to the full length 0… H gives, the integral reactivity is:
 (6)
(6)
 (7)
(7)
The asymptotic period method utilizes period measurements in the nearly super-critical region. By measuring the reactor period followed a reactivity change, the reactivity is found by using the inhour equation:
 (8)
(8)
where T is period of time, Λ is the neutron reproduction time,  is delayed neutron fractions,
  is delayed neutron precursor decay constants.
2.2. Control Rod Worth Calculation
The neutron flux distribution is effected by control rod position, which depends on insert or withdraw control rod. Figure 3 is description on effect of control rod on radial neutron flux distribution. Control rod worth can be measured in some methods that are the following methods:
・ Boron swap;
・ Rod swap;
・ Subcritical rod worth.
There are two ways definite control rod worth that is integral rod worth and differential rod worth. The change of reactivity is the integral control rod worth for the displacement distance when a control rod moves from top to bottom of the core. The effect of inserting control rod is calculated by determining the reactivity change between the rod withdrawal state and the state at which rod be inserted from top to that part. In other method, differential rod worth, worth of each part of control rod is estimated based on reactivity change by inserting that part of control rod.

Figure 3. Effect of control rod on radial neutron flux distribution.
3. Results and Discussions
3.1. Calibration of Control Rods
The rod test is inserting a small distance so that the reactor is slightly subcritical and the power starts to decrease. After a few minutes for the transients to die out, the reactor period is determined from the doubling time. Other rod is inserted into the reactor to bring it back to critical. The previous procedure is repeated until the rod test is calibrated along its whole length. From the observed periods are computed utilizing the inhour equation when the corresponding reactivity. Once the control rods are calibrated, it is possible to evaluate the magnitude of other reactivity changes by comparing the critical rod positions. Figure 4 is R5 control rod display on core OPR1000 interface. Figure 5 showed the results rod calibration.
The error of this method is determined by propagation of errors. The results of control rod calibration that are approximately ±4% for the total rod worth but it is about 1% for slope of the rod calibration curve.
The rod-drop method must be dropped the rods from criticality, so the rod combinations limited that can be measured, and the rod-drop time is more difference theory. Table 1 was compared with those two result methods. Table 2 was control rod worth and criteria of OPR1000 reactor that detect by this study and evaluate the theory result.
The results showed that the asymptotic period method is accuracy and advantage. Until now, this method is the best method to use calibrated the control rod in the nuclear reactor.

Figure 4. R5 control rod display on core OPR1000 interface.
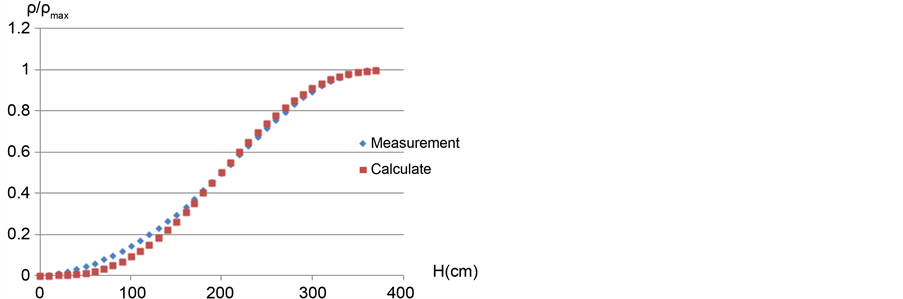
Figure 5. The control rods were calibrated by the asymptotic period method.

Table 1. Compared control rod worth between two methods.
Table 2. Control rod worth and criteria of OPR1000 reactor got the asymptotic period method.
*If the predicted rod worth for each group is greater than or equal to 667 pcm, use the ±15% acceptance criteria; otherwise use the ±100 pcm acceptance criteria.
3.2. Integral and Differential Worth of Control Rod Groups
The results of the integral and differential worth were shown in Figure 6 and Figure 7, respectively. The integral worth of groups: 1, 2, 3, 4, 5 is about 898.16 pcm, 809.34 pcm, 729.26 pcm, 443.9 pcm and 289.21 pcm, respectively. The integral worth of SA (safety group) is about 1553 pcm. This case showed that the control rod worth of safety rod is highest for shutdown in the reactor, which is very important protect to reactor when NPP occur emergency.
Figure 7 shows that the maximum value of differential worth of each control rod groups when the control rod reaches the nearby center of core, group 5 reach 252 cm and the minimum value of each control rod groups when the control rod is just inserted into the core, group 5 reach 252 cm. The curve of Figure 7 is not exactly symmetrical because of asymmetrical distribution for the fuel in simulation. The differential worth is different when the control rod is on the top and the bottom of core, which is due to the fuel and graphite’s asymmetrical distribution.
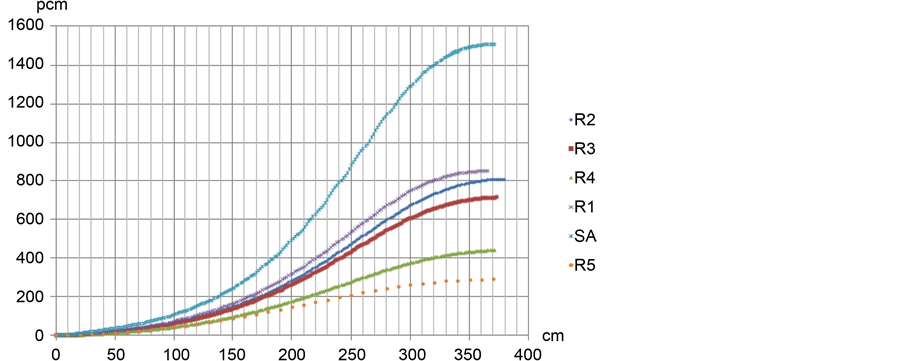
Figure 6. Integral worth of R5, R4, R3, R2, R1, SA in OPR1000 reactor (1000 MWe).

Figure 7. Differential worth of all control rod in all rod out (Y axis show reactivity per cm; X axis show vertical core reactor).
The slope of the curve (∆ρ/∆x) and therefore the amount of reactivity inserted per unit of withdrawal is greatest when the control rod is midway out of the core. This occurs because the area of greatest neutron flux is near the center of the core. Therefore, the amount of change in neutron absorption is greatest in this area. If the slope of the curve for integral rod worth in Figure 7 is taken, the result is a value for rate of change of control rod worth as a function of control rod position.
When group 5 located at 252 cm in the core, it is effect to neutron flux distribution, and is shown in Figure 8. The more group 5 insert into the core, the more neutron flux distribution will effect.
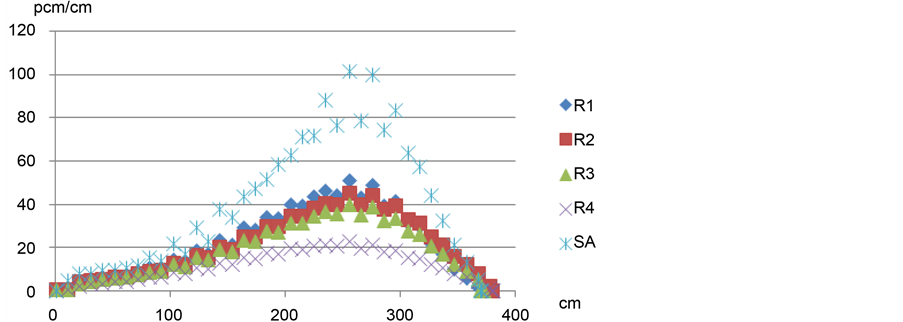
Figure 8. Differential worth of all control rods with group 5 at 252 cm.
The error of the simulation is around ±20 pcm. It can be seen that one control rod worth varies with the density, but the worth does not always rise when the density increases. It could be due to strong self-shielding effect of neutron absorbers. When clubbed control rod is inserted into the core, the effective absorption cross sections decrease. The result that the total worth of multiple control rods inserted into the reactor is not equal to the sum when each of them is inserted into the reactor respectively is shown.
4. Conclusion
The Core OPR1000 was used to simulate. The rod-drop method and the asymptotic period method were testing. The control rods were calibrated by asymptotic period method and the worth of regulating, and safety rods. According to this study, the integral and differential control rod worth and the total worth of five control rod groups with different position are also simulated. The effect of control rods to the axial and radial neutron flux was analyzed here. The simulation results are necessary for the control rod’s process and more than applications in the OPR1000 reactor.
Acknowledgements
We would like to thank Korea Hydraulic and Nuclear Power (KHNP), Hanyang University, and The Korea Nuclear Association (KNA) for supported Core Simulator OPR1000 that is the main equipment for this study.
Cite this paper
Son N.A., Hoa N.D., Nguyen, T.T., Tuan, T.Q. and Raul, O.C. (2017) Control Rod Calibration and Worth Calculation for Optimized Power Reactor 1000 (OPR-1000) Using Core Simulator OPR1000. World Journal of Nuclear Science and Technology, 7, 15-23. http://dx.doi.org/10.4236/wjnst.2017.71002
References
- 1. Hwang, D.H., Lee, M.S., Hong, J.H., Lee, S.H. and Suh, J.K. (2009) Interface between CoSi/TH Model and Simulator for OPR1000. Transactions of the Korean Nuclear Society Spring Meeting, Jeju, 29-30 October 2009, 815-816.
- 2. Keun, K.J. (2015) System Engineering of Nuclear Power Plant. Korea Nuclear Association for International Cooperation. Nuclear Engineering Track, Yeungnam University, Gyeongsan.
- 3. Glasstone, S. and Edlund, M.C. (1952) Nuclear Reactor Theory. Addison-Wesley Pub. Co., Boston, 293-310.
- 4. Glasstone, S. and Sesonske, A. (1968) Nuclear Reactor Engineering: Reactor Design Basics. Springer-Science + Business Media, B.V, Berlin, 230-242, 244-251, and 287-288.
- 5. Keepin, G.R. (1965) Physics of Nuclear Kinetics. Addison-Wesley, Reading, 242-249.
- 6. Gozani, T. (1962) Subcritical Reactor Kinetics and Reactivity Measurements. Israel Institute of Technology, Haifa, 125.
- 7. Kimel, W.R. (1959) Determination of Time Behavior of neutron Density and of Reactivity on the Argonaut Reactor. Nuclear Science and Engineering, 6, 233-237.
- 8. Harrer, J.M. (1963) Nuclear Reactor Control Engineer. Van Nostrand, Princeton, 125-127.
- 9. Ragheb, M. (1982) Lecture Notes on Fission Reactors Design Theory. FSL-33, University of Illinois, Champaign.
- 10. Lamarsh, J.R. (2014) Introduction to Nuclear Engineering. Addison-Wesley Publishing Company, Boston.