World Journal of Nuclear Science and Technology
Vol.3 No.1(2013), Article ID:27467,8 pages DOI:10.4236/wjnst.2013.31002
Radioisotopes and Analytical Chemistry
Department of Inorganic and Nuclear Chemistry, Faculty of Chemistry, National University of Mexico, Mexico City, Mexico
Email: jmnat33@unam.mx
Received September 11, 2012; revised November 8, 2012; accepted November 22, 2012
Keywords: Radioisotopes; Radiations; Chemical; Quantitative; Analysis
ABSTRACT
When Periodic Chart of elements is consulted to find natural radioisotopes, one firstly finds tritium, followed by 10Be, 14C, 50V and many others. Before Bi, 12 cosmogenic radioisotopes are listed. They are those continuously produced by nuclear reactions among light elements present in earthly atmosphere and radiations coming from the outside space. Eighteen additional primordial radioisotopes are listed. They were created at the same time that the non-radioactive isotopes composing the 92 natural elements in the periodic table. From Bi on, every isotope is radioactive, up to U. Then follow the artificial elements produced by laboratory nuclear reactions from Np to element with atomic number 118. In this way, from 118 known elements, 64 are radioactive, which amount 55% of all those units forming the chemical compounds. Therefore, the complete understanding of radioactivity should be a suitable tool to advance our knowledge of Universe, and consequent applications to get better living conditions. So, this paper deals with radioisotopes as suitable instruments for chemical analysis.
1. K Determination by 40K γ Rays Detection
40K primordial radioisotope has been extensively used in Mexico in measuring K concentration in foodstuff, since it is essential in the diet of vertebrates. The used method is a not-destructive one requiring to detect gamma rays being emitted by 40K (0.0118% of elementary K, 1.28 × 10⁹ years (half life) in a low background NaI (Tl) scintillation detector during several hours. Samples are conditioned in Marinelli containers, having enough weight as to fill them. Suitable time detection might be overnight. Specific total radioactivity R of elementary K is 31.19 Bq/gK is calculated according to the following equation:
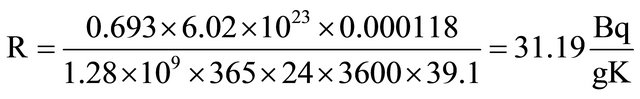 (1)
(1)
where:
Ln 2 = 0.693;
Avogadro’s number = 6.02 × 10²³ atoms;
40K isotopic abundance = 0.0118/100 nuclei;
40K Half Life = 1.28 ×109 × 365 × 24 × 3600 seconds;
K Atomic Weight = 39.1.
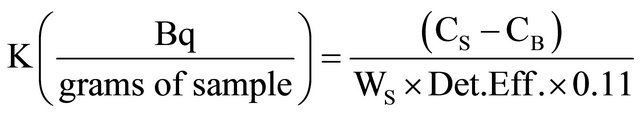
Detected F 40K radioactivity in any foodstuff, expressed in Bq/g sample, can be obtained by the following equation:
 (2)
(2)
where:
CS = Counts per second obtained from the sample;
CB = Counts per second obtained from the background;
WS = Foodstuff sample weight;
Det.Eff. = Detection Efficiency for 1461 keV γ rays in scintillation detector/100.
Branching ratio 40K decaying to .
.
Then, concentration of elementary K (%) in foodstuff samples is simply obtained by the following equation:
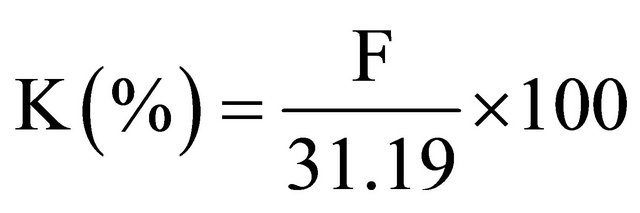 [1] (3)
The execution of that procedure started as early as 1998 [2]. The use of a Marinelli container in a specially shielded low-background detector (Figure 1), instead of a common plastic container, has improved detection efficiency by almost five times (from 0.58% to 2.86%).
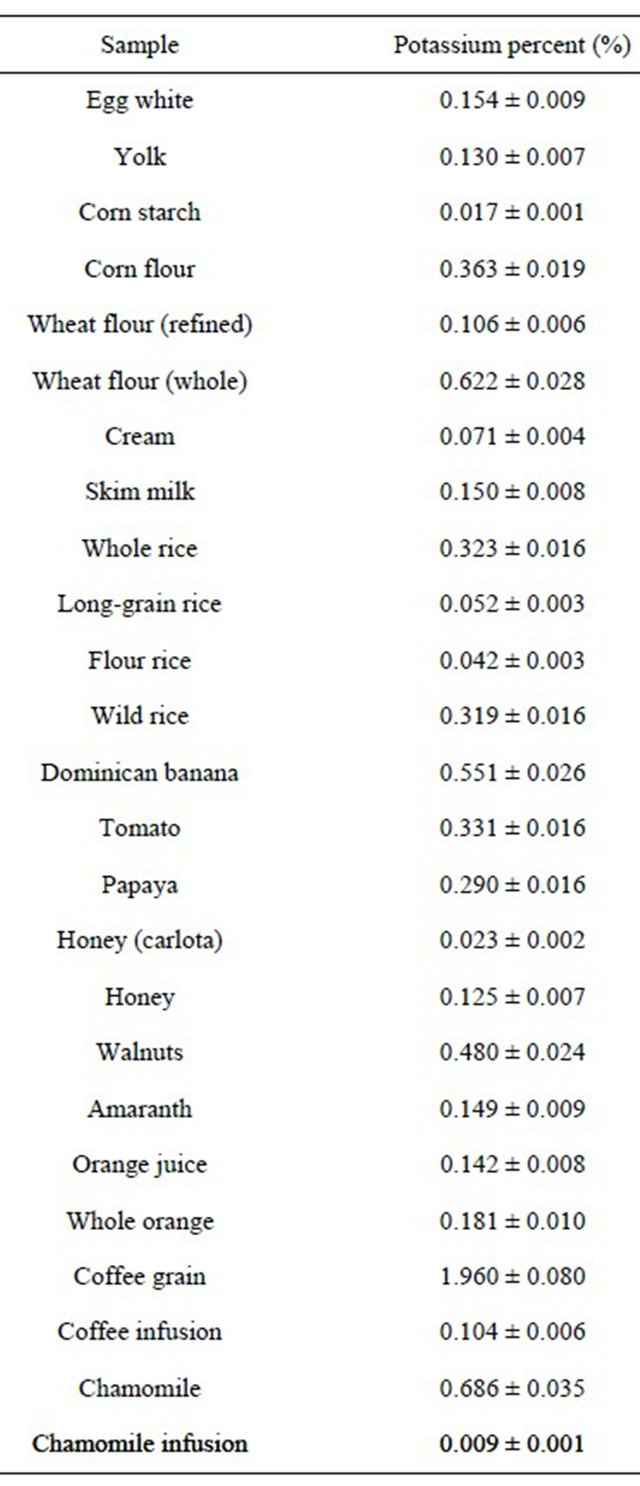
Table 1 shows K concentration in several foodstuff samples being obtained by γ rays detection emitted by 40K [3,4].
Validation of analytical method provides the basis for testing reliability of obtained results in a given uncertainty range. Potassium activity is related to 40K, a natural radioisotope emitting β− and γ rays. A sample activity emitting typical potassium γ rays energy can be linearly related to its whole potassium quantity. Shown data are aimed to validate potassium quantification method in a
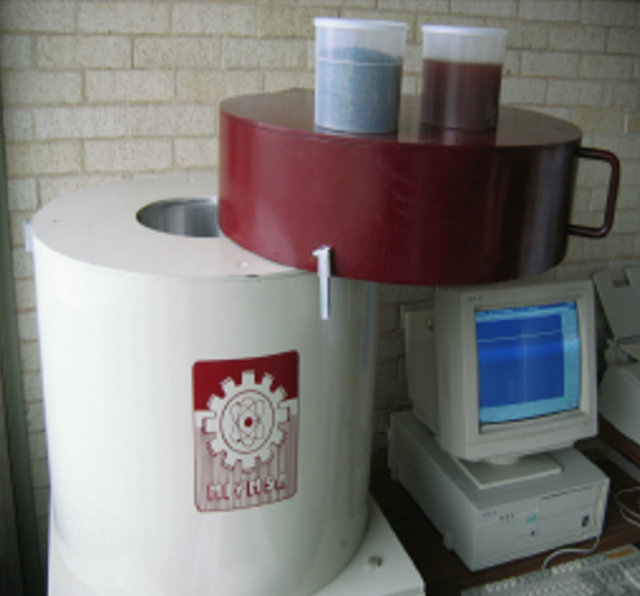
Figure 1. Low background scintillation detector and Marinelli containers.
Table 1. K concentration in several foodstuff samples.
sample by γ rays spectrometry and plotting calibration curves by measuring potassium chloride and calcium carbonate solid mixtures [5].
The method consists of measuring γ activity with 1461 keV energy, the typical gamma ray being emitted when 40K nucleus is converted to 40Ar atom by electronic capture. Natural-potassium specific activity is 31.19 Bq/g having 11% probability due to the electronic-capture process and 89% probability by β− decaying. By relating a sample activity to potassium specific activity, the potassium quantity in sample can be calculated.
Sample’s gamma spectrum was obtained by means of a NaI (Tl) scintillation equipment, 3" × 3" well type Bicron, Labtech trademark, being reinforced by a low background and lead-bottomed strong shield, Mymsa trademark, being distributed by Medidores Industriales y Médicos, S. A. de C. V. in Mexico. The equipment is PC-controlled by the radioactive-detection Maestro Program (Maestro Program ACERPOWER 5200MCB 1997), being distributed by EG ORTEC 533N (500 mL). Cylindrical Marinelli Beaker containers having a 500 mL ringshaped space to contain the sample were used. They are made of food-value grade polypropylene.
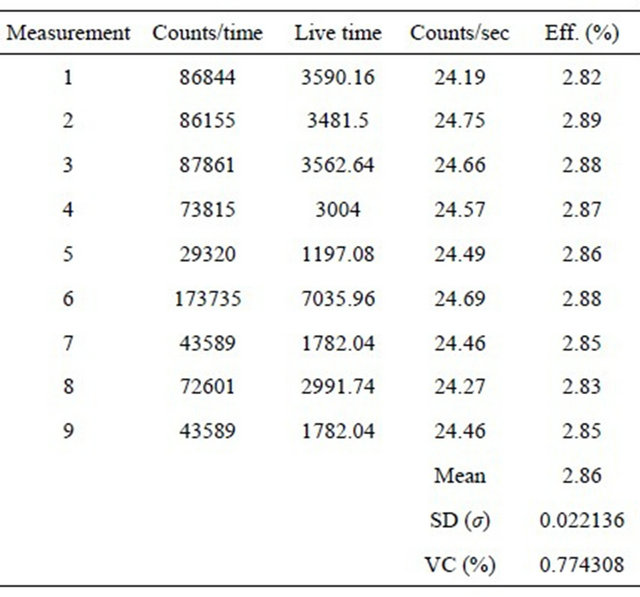
Equipment’s counting efficiency was carefully controlled since the related parameter is considered as constant in validating the method (Table 2).
1.1. Validation
Obtained results for linearity, precision, specificity, exactness, sensitivity, detection limits, quantification, and uncertainty tests were as follow:
1.2. Specificity
Gamma rays energy being emitted by sample radionu-
Table 2. Counting efficiency in different days.
clide can be identified by both the proposed method and used equipment. In 40K electronic-capture decaying, the emitted gamma ray energy is 1461 keV. A radioisotope emitting γ rays at close energy’s range is 228Ac, (1459.2 keV) [6]. Since these nuclei are relatively scarce in organic natural samples, their interfering effects with 40K are not considered [7].
1.3. Calibration Curves
Calibration curves were obtained by obtaining gamma spectrum from calcium carbonate and potassium chloride solid mixtures, and by testing five potassium concentration levels in the samples [8,9]. In standardizing the samples, the following procedure was executed: samples were made with KCl and CaCO3 even quantities and they got mixed. Then pure CaCO3 being equal to the former mixture total weight was added and mixed, to get a K concentration 1/4 in the mixture, and so on, by getting the wanted diluted K concentrations. To keep proportion in both the mixture and potassium concentration, and to calculate KCI and CaCO3 used quantities, the following algorithm is proposed:
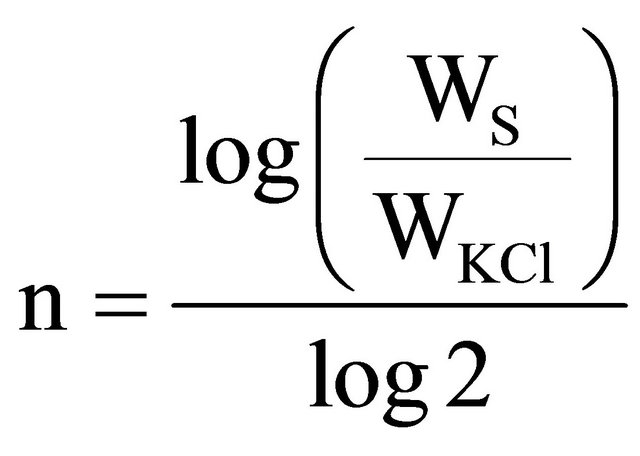 (4)
(4)
where: Ws is the sample’s total weight, WKCl is the potassium chloride’s weight, and n is the number for repeated cycle to obtain the wanted concentrations. Sample’s total weight was in the range from 160 g to 190 g.
1.4. Linearity
In that test, the equation relating the independent variable (potassium concentration) to the dependent one (accumulated counts) should be linear. The obtained result by the used equipment is as follows:
 (5)
(5)
 (6)
(6)
 (7)
(7)
 (8)
(8)
By substituting the equations above, we obtain the following one:
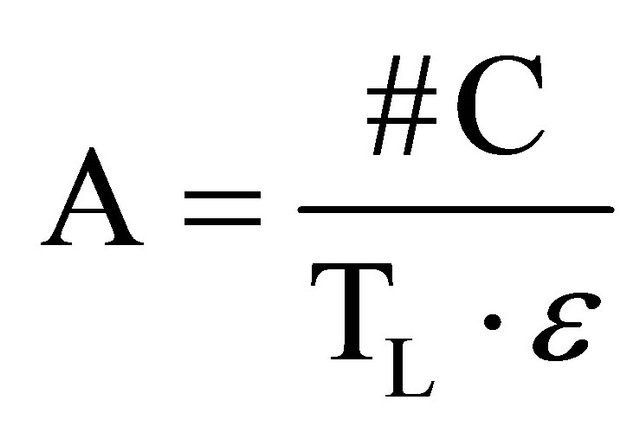
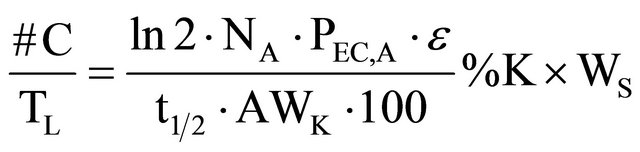 (9)
(9)
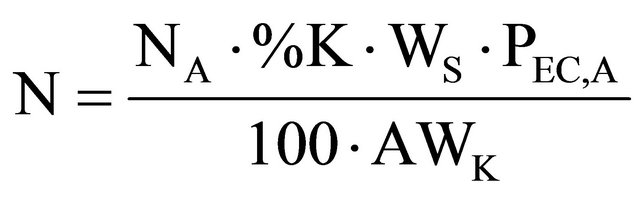
where: #C stands for the number of accumulated counts, TL for real-time seconds counting, NA for Avogadro’s number, PEC,A for both isotopic abundance multiplication (0.000118) and electronic capture probability (0.11), ε for equipment’s counting efficiency,  for average life-time period in seconds, AWK for potassium atomic weight, %K for sample’s average potassium content, and Ws for the sample’s total weight.
  stands for the dependent variable (y), while %K·WS stands for the independent one (x).
The following Tables 3 and 4, and Figure 2, show the results for one of the three data series:
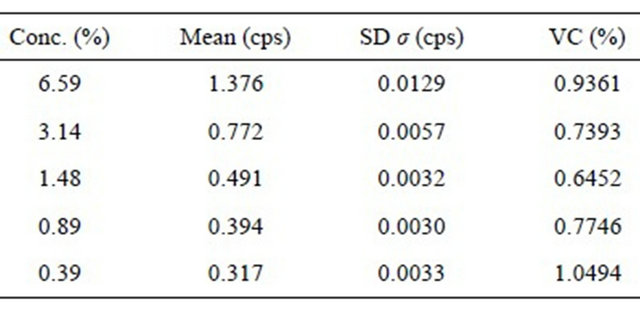
1.5. Precision
Each of the samples was analyzed three times during various days by different analysts. The variation coefficient should not exceed 3% [10]. Table 5, as it is shown, none of the results exceed 3% for variation coefficient.
1.6. Exactness
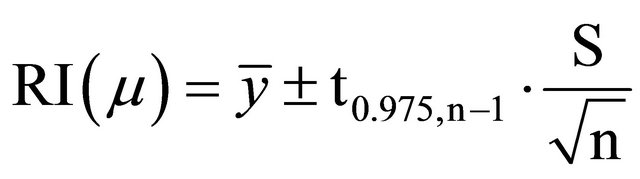
Five concentration values were obtained and compared to the assumed concentration. The standard criterion is that the relying interval (RI) of the obtained differences as percentages between obtained and assumed data should include the 100% value. To calculate the relying interval, the following formula was used [11]:
 (10)
(10)
where:  is the mean of different percentages between obtained and assumed values, t0.975,n−1 is the Student’s t-distribution with 97.5% confidence for five data, and their value in the corresponding table is 0.776. S is the variance and n is the number of data. So, the calculated relying interval is 98.951% - 104.482%, which includes 100% value.
1.7. Sensitivity
Sensitivity of the method is related to the straight-line slope relating to both of the variables. The straight-line
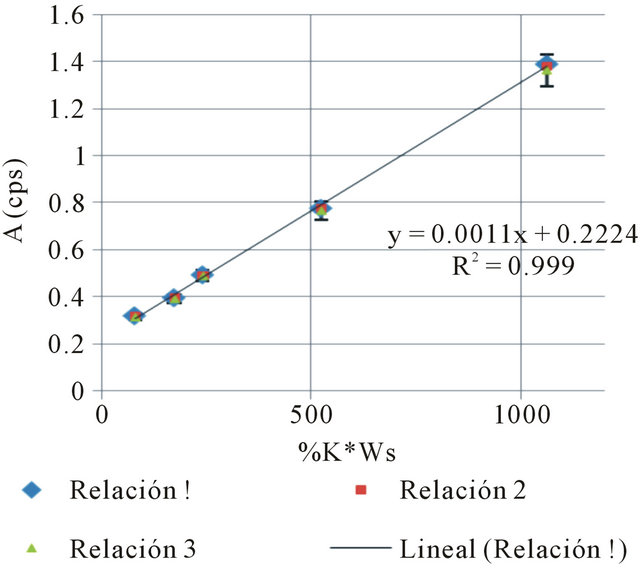
Figure 2. Calibration curve 1.
Table 3. Measurement of five calcium carbonate and potassium chloride mixtures.
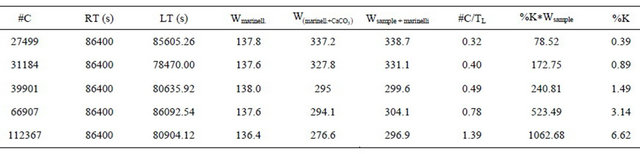
Table 4. Results of three calibration curves. Straight line equation: Y = 0.0011X + 0.22.
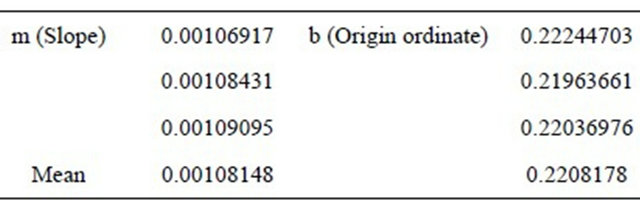
Table 5. Mean measure, several days.
slope varies according to the counting units. The smallest slope stands for per-second counting units, while the bigger one stands for per-day counting units [12,13] Figure 3.
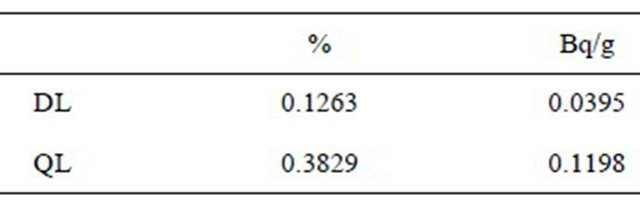
1.8. Detection and Quantification Limits
In order to calculate these limits, the following formula was used [9]:
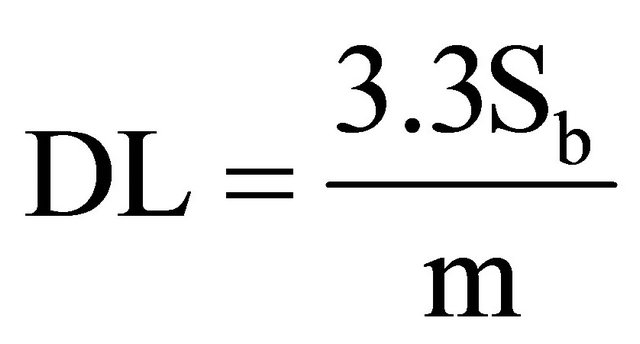 (11)
(11)
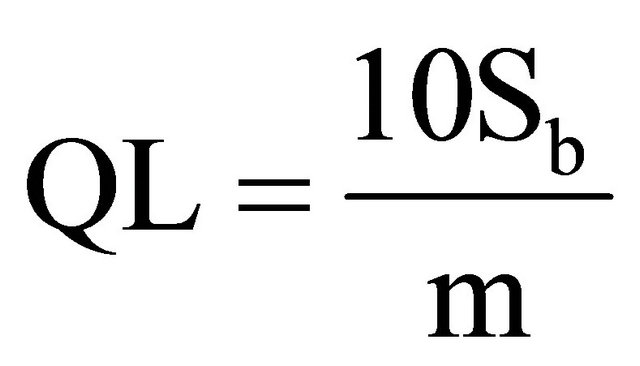 (12)
(12)
where: DL is Detection Limit, Sb is variance of blanks, m is the slope of right line. For calculating Sb, 13 blanks were measured to obtain 0.226 cps in average, and 0.031 for variance. The average blank measurement is similar to the origin ordinate in the calibration curves. The calculated slope for calibration curves is m. The obtained values are as follow in Table 6.
1.9. Uncertainty Associated to the Regression
In calculating uncertainty associated to the regression, the following formula should be used:
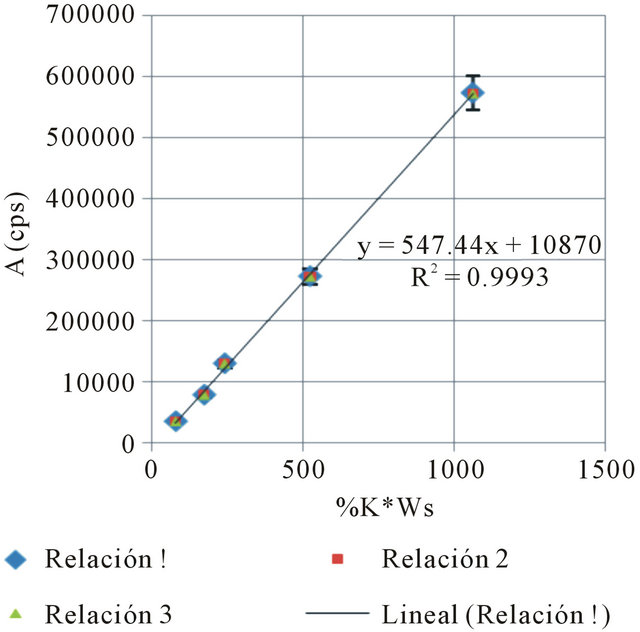
Figure 3. Calibration curves in counts per day.
Table 6. Detection and Quantification Limits of K concentration (%) and 40K specific activity (Bq/g) in samples.
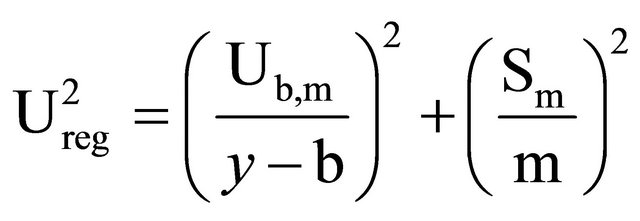 (13)
(13)
where Ub,m is:
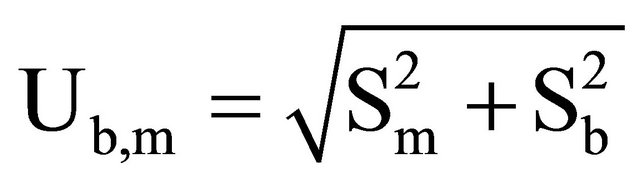 (14)
(14)
Ureg stands for uncertainty associated to the regression, Sm for slope m standard deviation m, Sb for the origin ordinate standard deviation, m for the slope value, b for the origin ordinate value, and “y” is the measurement value (equipment response in cps).
Given the linear correlation coefficients being obtained from larger-than 0.98 linear regressions, we are able to conclude that the used method is linear for the interval of analyzed concentrations, from 0.39% to 6.59. 40K gamma ray energy is just comparable to actinium 228. Given the relative abundance of both radioisotopes, we are able to hold that the method is specific for potassium. Exactness tests results were positive, which means that the method is exact enough. The method is precise because none of the variation coefficients was larger than 3%. The detection limit for the method is 0.13% of natural potassium, being equivalent to total 40K 0.04 Bq/g. The quantification limit for the tested method is 0.38% of natural potassium, being equivalent to total 40K 0.12 Bq/g. Method sensitiveness is a function of the maximum time period for measurement. For longer counting time, method is more sensitive even.
It must be added that every element with a primordial radioisotope in its isotopic composition, such as Rb, with 87Rb (27.86% isotopic abundance, 4.88 × 10¹⁰ years half life, β− emitter, 0.282 Mev maximum energy), can be evaluated by the same procedure (specific activity 883 Bq/g), which should be useful to classify Rb minerals, where the concentration of element with the radioactive isotope in it might be obtained as a percentage, by β− liquid scintillation detection from mineral solution.
2. Activation Analysis
If this quantitative-analysis method, based on natural radioisotopes detection, is useful for treating elements having one primordial radioisotope in its composition, activation analysis is still the first option to simultaneously evaluate several elements in one sample, as well as to reach detection limits (10−6 to 10−9 g), for elements having greater thermal neutron capture cross section, large isotopic abundance and suitable radiochemical separations performing. So, it is possible to calculate the number of counts that must be accumulated in a practicable detection time, as a function of background counts, in order to get the minimum statistical variation:
 [12] (15)
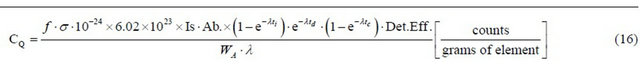
In the same way, it is also useful to establish the counts per gram of some determined element in a sample, irradiated and detected under particular conditions (please see Equation (16) below).
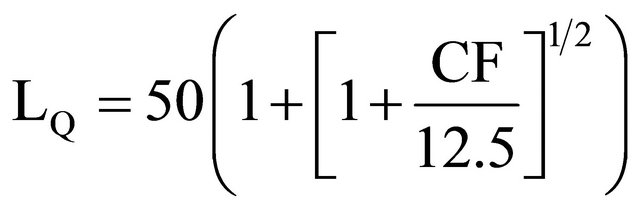
And, of course, it is also useful to establish the possible minimum concentration of element Mm to be measured under these particular conditions:
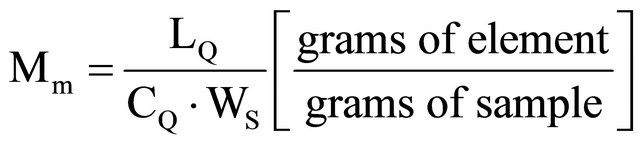 (17)
(17)
where:
LQ = necessary minimum net counts, accumulated for quantitative determination of one specific radioisotopeobtained by irradiation of the element to be determined, with statistical error < 10%;
CF = background counts, expressed as total counts minus net counts, in the energy region of our peak, in the γ rays spectra;
CQ = counts per gram of element obtained in specific irradiation and counting conditions (c/g);
f = neutron flux (n/cm2·s);
σ × 10−24 = nuclear reaction cross section (cm2);
6.02 × 1023 = Avogadro’s number;
IS·Ab. = isotopic abundance of target/100;
ti = irradiation time;
td = decaying time after irradiation;
tc = counting time;
λ = decay constant of radioisotope obtained;
WA = element atomic weight (g);
WS = Sample weight (g);
Det.Eff. = detection Efficiency for γ rays with determined energy detected/100.
This sort of analysis is used to measure the tiny masses of elements, from 10−6 to 10−9 g, corresponding to concentrations from μg/g (ppm) to ng/g (ppb), whose sensitivities are reached as a function of cross section and isotopic abundance of the isotope converted to radioactive by a nuclear reaction, as well as the flux of particles used for samples irradiation, commonly thermal neutrons (n/cm2·s). Neutron activation analysis has had great development during the last 50 years, with great variety of applications in many fields of science and technology, including a great evolution in techniques for improved sensitivity, precision and accuracy. In this context, if it were necessary in the beginning to irradiate a standard sample of known mass of the elements to determine, at exactly the same conditions than problem sample with unknown masses to be measured, in order to compare both induced radio activities, at present it is used the so called K0 method, in which a software is fed with all variables in the activation equation (f, σ, isotopic abundance, atomic weight, sample weight and irradiation, decaying and counting times), to obtain directly the trace concentrations in a sample of determined elements. Radiochemical separations have always presented a problem in managing radioactive material when separating the measuring elements from the rest of the sample in order to isolate their specific radioactivity of those elements of our interest by using non-radioactive carriers of same elements, and in this way to get better sensitivity and precision, since the background represented by the rest is eliminated. In this context, a mean thermal-neutron transparent filter is used to retain traces. That filter is
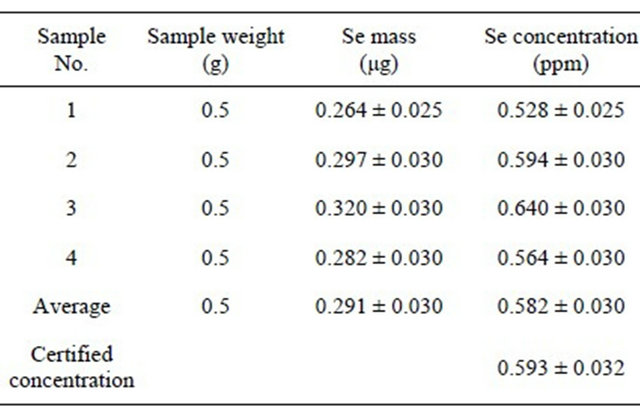
the activated carbon, whose impurities might be considered as a background for blank samples, where traces can be concentrated before irradiation, and then irradiate 50 mg activated carbon filters with the traces retained therein, after filtration of elements solution at characteristic pH values. It has been successfully used for Se, Co and I traces in organic samples with filtration efficiencies of 97% - 99%, but its efficiency for other elements remains an open research subject. Table 7 shows both traces concentration in activated carbon and masses of elements being present in 50 mg of filter, i.e. the blank sample being obtained by Instrumental Neutron Activation Analysis (INAA). Tables 8 and 9 show, for example, results obtained to evaluate Se concentration in four samples of white clover fodder and sea lettuce, Reference Materials in the European-Community [14].
3. Isotopic Dilution Analysis
Another type of analysis in which radioisotopes seem to be essential is isotopic dilution analysis. It makes possible to measure volumes difficult to determine, or compounds whose similarity among them makes quantitative
Table 7. Trace elements concentration in activated carbon (Merck No. 2186) determined by INAA: f = 5 × 10¹³ n·cm−2·s−1; ti = 1 m and 24 h; td = variable; tc = variable.
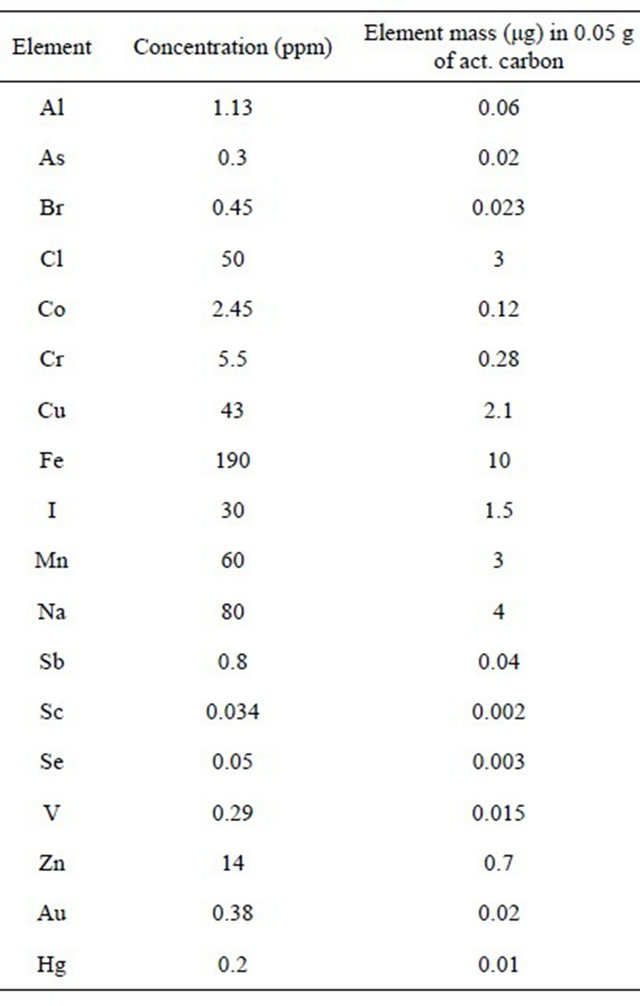
Table 8. Selenium concentration determined by 77mSe (t1/2 = 17.5 s) in a set of four samples of white clover (fodder), issued from the reference bureau of the european community.
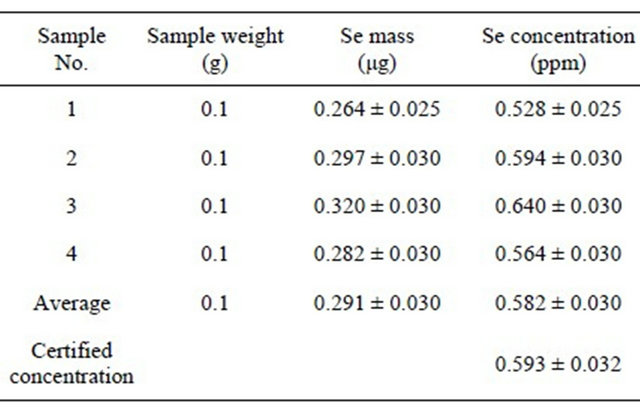
Table 9. Selenium concentration determined by 77mSe in a set of 4 samples of standard reference material Ulva lactuca (Sea Lettuce) (dietary complement) issued from the reference bureau of the european community.
separation difficult. Examples of the first case are blood in living organisms and water reservoirs; examples of the second one are isomers like amino acids. The usual principle is adding a soluble compound to the liquid or mixture to measure (a), being labeled with a suitable radioisotope at a known specific activity (S1). Added volume or mass multiplied by specific activity is the total activity added to system (aS1). Then, volume or mass to be measured should dilute the added volume or mass (X + a), whose specific activity (S2) can be determined by separating a small part of the whole mixture. Then, total activity after and before dilution must be equal, so the following equation can be established:
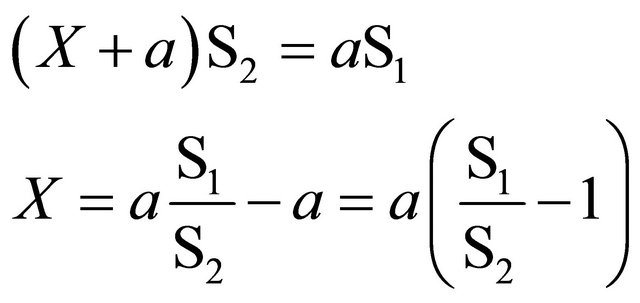 (18)
(18)
where:
X = volume or mass to be measured;
a = volume or mass added to X;
S1 = specific activity of a (counts/time units-volume or mass added);
S2 = specific activity of (x + a) (counts/time unitsvolume or mass fraction recovered).
As an example in which option for complicated clinical states is absent, the blood volume of a patient can be evaluated by isotopic dilution analysis:
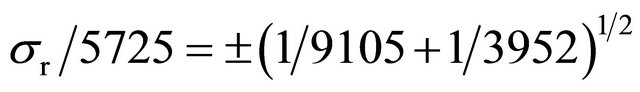
10 mL of physiological serum are labeled with 99mTc (t1/2 = 6 hours, X rays emitter, 140 keV, and 99mTc specific activity equal to 9105 cpm/20 μL, eluted from a 99Mo-99mTc generator. The 10 mL labeled solution is intravenously injected to the patient and after 10 minutes, 5 mL of blood are extracted and detected, yielding 3952 cpm. The volume of circulating blood, as well as the statistical error implied in this calculation, is wanted:
Specific activity of 99mTc labeled solution injected: 9105 × 1000/20 = 455,258 cpm/mL;
Specific activity of 99mTc in blood extracted: 3925/5 = 790 cpm/mL;
Isotopic dilution equation: (Vx + 10) × 790 = 10 × 455250;
Blood volume, Vx = 10 × 455250/790 − 10 = 5725 mL.
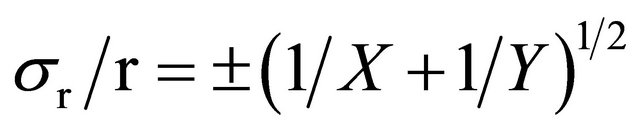
Statistical error for two counts (X, Y), either multiplied or divided to obtain a result (r) is:
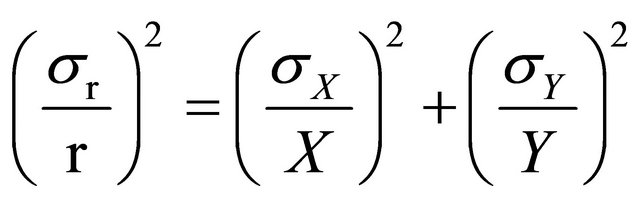 (19)
(19)
where:
σr = standard deviation result;
r = final result obtained;
σX = standard deviation of first counting;
X = counts of first counting;
σY = standard deviation of second counting;
Y = counts of second counting.
If it is admitted that counting standard deviation is approximately equal to its square root, 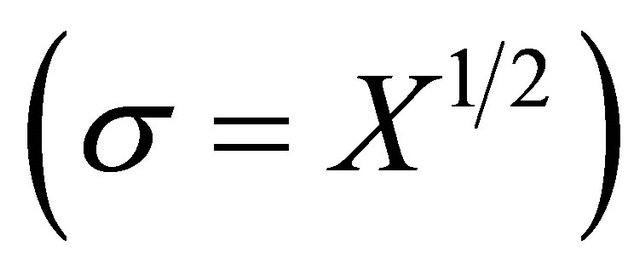 , then the above equation may be greatly simplified:
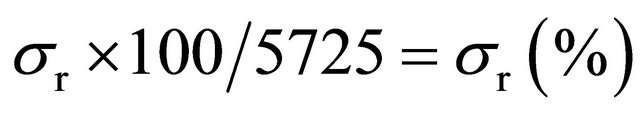 (Standard deviation as percentage)
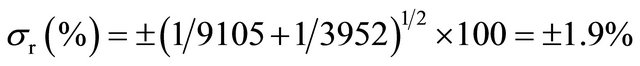 (1σ, 68.3% of results in Gaussian distribution).
Since only two radioactive detections have been performed with statistical variation, the rest of figures are constant.
The measurement of volumes at greater proportion can be done by using a combination of activation and isotopic dilution analysis. By instance, in measuring the volume of an underground lake (natural aquifer called “cenote”) at Yucatan Peninsula in Mexico. So, 1 mL of water is taken to be irradiated with thermal neutrons at the same time and identical conditions that 1 ml of a standard solution prepared by diluting 100 mg of NaCl in 1 L of distilled water. Afterwards, 10 kg of NaCl are dispersed all over the surface of the aquifer, and 24 hours later another 1 mL sample is taken to be irradiated at identical previous conditions. Irradiation time is one minute with a thermal neutron flux equal to 1012 neutrons/cm2·s. Sample one, plain lake water (background), yields 4280 cp2m of 24Na (γ emitter, 1369 keV, t1/2 = 14.95 hours, obtained by 23Na(n,γ)24Na, σ23Na = 0.53 barns, 100% isotopic abundance). Sample two (standard), yields 10100 cp2m, and sample three (water sample from lake, after NaCl addition), yields 9337 cp2m. So, what is the water volume in this “cenote”?
4280 cp2m/mL represents the background due to natural Na present in lake water.
10100 cp2m represents the standard solution obtained by diluting 100 mg of NaCl in 1000 mL of distilled water (3.93 × 10⁻⁵ gNa/mL).
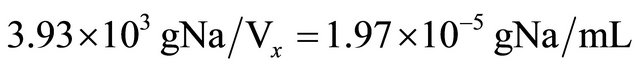
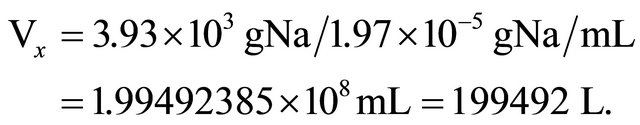
9337 cp2m represents 10 kg of NaCl (3.93 kg of Na) diluted in the unknown volume Vx, plus background.
So: 9337 − 4280 = 5057 cp2m (correction by background).
10100 cp2m/mL represents the standard concentration equal to 3.93 × 10⁻⁵ gNa/mL.
So: Na concentration in lake (CNa), after addition of 10 kg NaCl is:
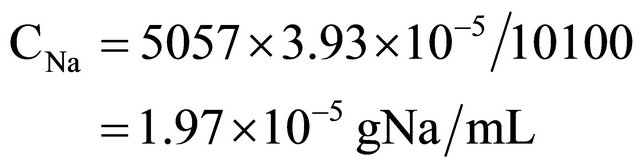
Therefore:
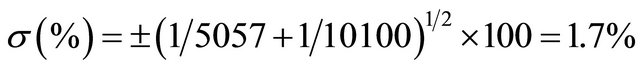
(1σ, 68.3% of results in Gaussian distribution).
4. Conclusions
1) This paper describes the method to measure K concentration percentages range by detecting γ radiation from natural radioisotope 40K. Foodstuff stands for most interesting samples. A validation of the method is also included, according to Mexican law.
2) Activation Analysis has been considered too. In spite of great development during the last 60 years, that analysis shows some research subjects still, without mentioning its usefulness as a tool of analysis in many research fields.
3) Isotopic dilution analysis is also the best approach for almost indiscernible volume measurements, as well as for similar chemical configuration solids, whose almost identical chemistry is an obstacle for quantitative separations. At the present time, the number of its applications is still growing up.
As a general conclusion, we can say that as soon as radioisotopes are quite necessary to perform some sort of chemical analysis, numerous examples of applied science in which radioisotopes are strongly contributing to the development of matter knowledge abound.
REFERENCES
- J. M. Navarrete, J. Campos, T. Martínez and L. Cabrera, “Determination of K Traces in Foodstuffs by Natural 40K Radiation,” Journal of Radioanalytical and Nuclear Chemistry, Vol. 265, No. 1, 2005, pp. 133-135. doi:10.1007/s10967-005-0797-3
- B. Hoeling, D. Reed and P. B. Spiegel, “Going Bananas in the Radiation Laboratory,” American Journal of Physics, Vol. 67 No. 5, 1999, pp. 440-442. doi:10.1119/1.19281
- P. Lizárraga, “Determinación de la Concentración de K en Alimentos Mediante la Detección de las Radiaciones Emitidas por el 40K,” Tesis Profesional, Facultad de Química, UNAM, 2006.
- J. M. Navarrete, T. Martínez, L. Cabrera, P. Lizárraga, M. A. Zúñiga and M. Camacho, “Potassium Concentration in Four Basic Diet Products (Milk, Eggs, Wheat and Corn),” Journal of Life Sciences, Vol. 5, No. 8, 2011, pp. 614- 617.
- A. Fernández, T. Martínez, M. Navarrete and M. A. Zúñiga, “Validation of the Quantification Method for Potassium by Means of 40K γ Radiation,” INCS News, Vol. 9, No. 3, 2012, pp. 4-8.
- N. Lavi, F. Groppi and Z. B. Alfassi, “On the Measurement of 40K in Natural and Synthetic Materials by the Method of High Resolution γ Ray Spectrometry,” Radiation Measurements, Vol. 38, No. 2, 2004, pp. 139-143. doi:10.1016/j.radmeas.2003.11.005
- T. Martínez, M. Navarrete, L. Cabrera, F. Juárez, F. Ramos and K. Vázquez, “40K Activities and K Concentrations in Tobacco Samples of Mexican Cigarettes,” Journal of Radioanalytical and Nuclear Chemistry, Vol. 273, No. 3, 2007, pp. 569-572. doi:10.1007/s10967-007-0911-9
- N. Lavi and Z. Alfassi, “Development and Application of Marinelli Beaker Standards for Monitoring Radioactivity in Dairy-Products by γ-Ray Spectrometry,” Radiation Protection Dosimetry, Vol. 61, No. 6, 2004, pp. 1437- 1441.
- N. Lavi and Z. Alfassi, “Development of Marinelli Beaker Standards Containing Thorium Oxide and Application for Measurements of Radioactive Environmental Samples,” Radiation Measurements, Vol. 39, No. 1, 2005, pp. 15-19. doi:10.1016/j.radmeas.2004.04.009
- A. García, E. Soberón, N. Cortés, R. Rodríguez, J. Herrera and A. Alcántara, “Métodos Analíticos, Guía de Validación,” Colegio Nacional de Químico Farmacéuticos Biólogos de México, México, 2002.
- NMX-Z-109-1992, “Términos Generales y sus Definiciones Referentes a la Normalización y Actividades Conexas,” Diario Oficial de la Federación, México, 1992.
- “Métodos Analíticos Adecuados a su Propósito, Guía de Laboratorio Para Validación de Métodos y Tópicos Relacionados,” EURACHEM, Traducción Libre del CENAM, 1998.
- L. A. Currie, “Limits for Qualitative Detection and Quantitative Determination. Application to Radiochemistry,” Analytical Chemistry, Vol. 40, No. 3, 1968, pp. 586-593. doi:10.1021/ac60259a007
- J. M. Navarrete, L. C. Longoria, M. T. Martinez and L. Cabrera, “Determination of Co, Se and I by NAA in Foodstuff by Pre-Concentration of Traces,” Journal of Radioanalytical and Nuclear Chemistry, Vol. 271, No. 3, 2007, pp. 599-601. doi:10.1007/s10967-007-0313-z