Journal of Cosmetics, Dermatological Sciences and Applications
Vol. 2 No. 4 (2012) , Article ID: 25852 , 11 pages DOI:10.4236/jcdsa.2012.24046
A Consensus Modeling Approach for the Determination of Stratum Corneum Thickness Using In-Vivo Confocal Raman Spectroscopy
![]()
1Advanced Measurement and Data Modeling, Unilever Research & Development, Trumbull, USA; 2Clinical Science, Unilever Research & Development, Trumbull, USA.
Email: †thomas.m.hancewicz@unilever.com
Received August 23rd, 2012; revised September 25th, 2012; accepted October 5th, 2012
Keywords: In-Vivo Raman Spectroscopy; Confocal Raman Spectroscopy; Reflectance Confocal Microscopy; Stratum Corneum Thickness
ABSTRACT
The measurement of stratum corneum (SC) thickness from in-vivo Raman water concentration depth profiles is gaining in popularity and appeal due to the availability and ease of use of in-vivo confocal Raman measurement systems. The foundation of these measurements relies on high-quality confocal Raman spectroscopy of skin and the robust numerical analysis of water profiles, which allow for accurate determination of SC thickness. These measurements are useful for studying intrinsic skin hydration profiles at different body sites and for determining hydration properties of skin related to topically applied materials. While the use of high-quality in-vivo Raman instrumentation has become routine and its use for SC thickness measurement widely reported, there is lack of agreement as to the best method of computing SC thickness values from Raman water profiles. Several methods have been proposed and are currently in use for such computations, but none of these methods has been critically evaluated. The work reported in this paper describes a new method for the determination of stratum corneum thickness from in-vivo confocal Raman water profiles. The method represents a consensus approach to the problem, which was found necessary to apply in order to properly model and quantify the large diversity of water profile types encountered in typical in-vivo Raman water measurement. The methodology is evaluated for performance using three criteria: 1) frequency of minimum fitting error on modeling to a standard numerical function; 2) frequency of minimum model error for consensus vs. individual SC thickness values; and 3) correlation with reflectance confocal microscopy (RCM) values for SC thickness. The correlation study shows this approach to be a reasonable replacement for the more tedious and time-consuming RCM method with R2 = 0.68 and RMS error = 3.7 microns over the three body sites tested (cheek, forearm and leg).
1. Introduction
As the outermost layer of skin, stratum corneum (SC) functions as a barrier to water loss and as a barrier to exogenous chemical penetration. SC water content is known to reflect skin health and is related to changes in elasticity, flexibility, surface morphology, and sensory feelings [1-5]. Numerous studies have been carried out to measure SC water content with most methods limited to in-vitro techniques and destructive methods [6,7]. In recent years, there has been an increased interest in the measurement of SC thickness due to its impact on skin barrier function and permeability [8-11]. Tomita et al. have reported that as SC hydration and flexibility decreases, SC thickness correspondingly increases for subjects with severe congenital ichthyosis [3]. Sato et al.
reported a decrease in SC thickness and reduction in surface roughness with increased water content [4]. These results suggest that good skin health is associated with thinner SC.
An expected mode of action of moisturizers is to hold water in the SC. Moisturizers not only prevent and treat dry skin, but also protect sensitive skin, improve skin tone and texture, and mask imperfections [12-15]. In order to compare the hydration effect of moisturizers, water content change needs to be measured. One must also measure the SC thickness if the intent is to compare water content in different regions of the SC. A single technique that can measure both water content and SC thickness would be of great value as a clinical measurement device. In-vivo confocal Raman spectroscopy (CRS) has evolved as a single clinical measurement device capable of making both measurements based on the spectra of skin with depth into the SC before and after treatments [11,16-20]. Although capable of providing SC thickness values, a consistent, reliable, SC thickness measurement from CRS has not emerged and of those methods that have been proposed, there is no agreement on best practices and no direct correlation with an established SC measurement method.
Caspers et al. published the first paper showing the in-vivo SC water content profile measured using CRS. Wu et al. showed good validation of water content measurement between CRS and Karl Fischer method [21]. Boncheva et al. also showed correlation between CRS and skin conductance related to water content measurement [22]. As optical coherence tomography (OCT) has been widely used for measurement of epidermal thickness [23-27], Crowthers et al. published a validation study for SC thickness measurement between CRS and OCT [19]. However, the results showed correlation only for thick SC body sites (palm) and no correlation within the thin SC regions of the forearm, cheek, and leg. Here we describe results based on an improved SC thickness measurement of skin from CRS (Hancewicz et al.1, unpublished results, 2009). Our results show good correlation between SC thickness measurement for CRS and RCM in the SC thickness region from ~10 µm to 30 µm for forearm, cheek, and leg. We discuss details of our systematic clinical study and results from our improved method for the determination of SC thickness calculation of CRS water profiles.
Accurate modeling of in-vivo Raman water profiles is a key first step in the determination of SC thickness from the profiles. However to do this in real life situations the method(s) used need to be able to cope with the natural variation in water profiles measured at any local skin area. An example of this natural variation is shown in Figure 1 for a typical collection of forearm water profiles for normal (right plot) and dry skin (left plot). An additional consideration is the natural variation in skin thickness at different body sites. SC thickness from cheek, forearm and leg are different and represent an additional source of variation in the water profiles. This further complicates the overall shape characteristics. The SC thickness calculation is dependent on the nature of the water profile because the point of curvature inflection of the profile is used to estimate the bottom of the SC.
A number of methods for modeling the profiles have been described in the literature [17-19,28]. However, these are based on a number of different methodologies. Seig and Crowther et al. used a standard Weibull sigmoid function to model the mean Raman water profile and used a simple gradient threshold method to determine inflection point of the curve [19]. Egawa et al. proposed using the actual mean water profile and the minimum of the 1st derivative of the profile as the inflection point of the curve [18]. Van der Pol proposed linear segmentation of the water profile into two sections corresponding to SC and epidermis with the depth determined as the point of intersection corresponding to the junction between SC and dermal-epidermal junction (DEJ) [28]. These methods have been developed based on an “idealized” water depth profile and the authors do not report any testing for their robustness to take into account this natural variation described above. We also observe that all of which rely on a deterministic “single point of view” approach to the solution.
It is our contention that using a single method on the
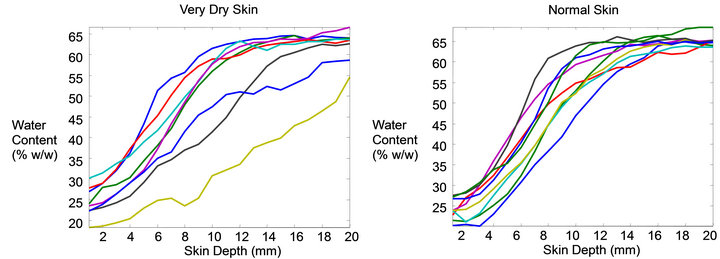
Figure 1. Typical CRS water profiles for dry forearm skin (left) and normal forearm skin (right). Dry skin shows much larger variation than normal skin.
huge variation observed in the real profiles that this is unlikely to yield the best solution for all data. For example the single sigmoid approach suggested by Seig and Crowther assumes all water profiles have the same degree of curvature, slope, symmetry, and inflection and therefore can be described in a simple way. This is clearly not the case as the profiles in Figure 1 show. Figure 2 shows the modeled data from the real data shown in Figure 1. Certainly the variation is quite large and suggests a complexity that should be handled with a diverse solution rather than a narrowly defined one. No single inflection method will be equally suited for all profiles since the radius of curvature at the inflection can be small or large, depending on the actual thickness— sharp for cheek and broad for leg.
These are the most significant methods published in the literature. While there are other methods suggested by different authors, all have the same limitation: a single method modeling approach to all water profile types. One of the deficiencies in each of these published works is that no effort has been made to establish error estimates for the modeling procedure or uncertainty values for SC thickness determination. The assumption is that each method is sufficient for both modeling and SC determination without showing how well the methods work. The issues highlighted above are what will address in this paper.
To do this we propose an approach to modeling in-vivo Raman water profiles that achieves the intended aim through the application of a number of different models for each individual profile and a number of different methods of calculating the associated SC thickness. The most likely solution is then chosen based on a distribution of solutions, which then represents the least error solution. In other word, rather than model the data using a single deterministic approach, we propose generating a number of likely solutions from which the most likely solution is computed.
2. Clinical Study—Experimental
SC Thickness Validation Study
A clinical study was conducted in order to provide the necessary Raman spectra used to compute water profile data for determined the distribution of SC thickness values and also to collect the corresponding reflectance confocal images needed to determine absolute SC thickness. The study was conducted on eleven Caucasian, fair skin, female panelists. Informed consent was obtained from all the panelists. There were eight test sites per panelist (one test site on each side of the left/right cheek and forearm and two test sites on each leg (left/right). Each test site was marked using a 2 inch × 2 inch template and CRS and RCM data acquired from the same marked region. Panelists were acclimatized for 25 minutes in a controlled temperature (70 F) and humidity (40% RH) room prior to data collection under the same ambient conditions. Raman data collection was followed with RCM data collection. For each panelist and for each anatomic body site, approximately ten CRS water profiles and up to 4 RCM three-dimensional stacks of images were collected. Each stack is comprised of an image from the SC surface at 2 micron intervals into the skin to a depth of approximately 42 microns. Some of the CRS measurements could not be obtained for all panelists because of excessively dry and/or tanned skin, and so some panelists ended up with less than ten measurements. The mean SC thickness values derived from the CRS and RCM data for each panelist by body site were used for the correlation calculation.
3. Materials and Methods
3.1. In-Vivo Raman Data
The in-vivo Raman water profiles need to be representative of the local spot on the skin being measured. However there is a large variation in the nature of individual
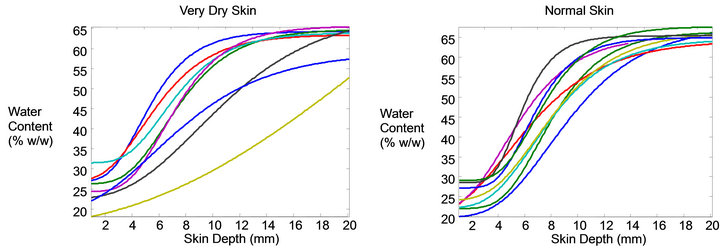
Figure 2. Modeled water profiles corresponding to those from Figure 1. The vertical lines indicate the SC thickness corresponding to the body site.
Raman profiles even when collected in close proximity to each other. This means that a sufficient number of profiles must be collected for each site being measured so the normal range of variation is captured. In normal skin this variation tends to be relatively small with the general profile appearing similar for all sampled profiles (Figure 1 right). The variation from dry skin however can become excessively large (Figure 1 left). It is clear from inspection of these individual Raman water profiles that a wide range of curve characteristics is represented in the ordinary collection of skin water profiles. The modeled profiles of the true curves from Figure 1 are shown in Figure 2 and represent a good approximation of the actual profiles as determined from the modeling process described in Section 3.2. In this paper data is presented for cheek, forearm, and leg, each of which has a different mean SC thickness. Typical mean water profiles are shown in Figure 3 for each of the three body sites.
3.2. Modeling Water Profiles and Calculating SC Thickness
Modeling of Raman water profiles is a matter of fitting a theoretical curve to the existing water profile. This is the same premise as proposed by Seig and Crowther [19], and generally speaking the method proposed here follows the same idea. What is new in our method is that a range of models are applied to each profile and the precise nature of representation of the data used for the modeling. Although this may sound like a small difference, in practice it is a more robust way to represent the data. That is while most authors choose to do the modeling using the mean representation of the water profile, here instead each individual profile is used for modeling and then a mean representation is generated from fitted data through a statistical filtering process. This is an important point because representation of each measurement by a simple mean profile can have the adverse effect of averaging out useful variation. We contend the best approach is to retain information from all individuals and rely on the statistical distribution of results to provide the most sensitive means of computing the result.
There are three different steps needed to generate the final modeled profiles and from them, determine the SC thickness:
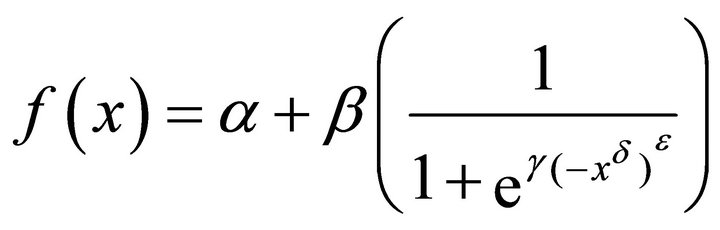
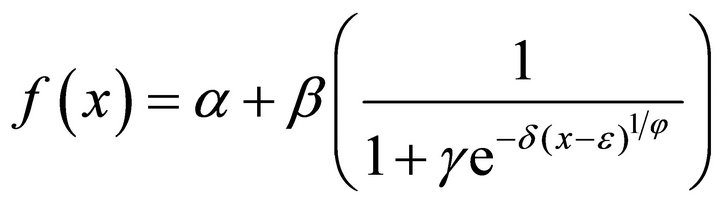
1) Model water profiles using the different sigmoid functions, five were used: modified logistic, RichardsGompertz, Weibull, Gompertz, and Richards. An in depth descriptions of these functions are beyond the scope of this paper and the reader should refer to Yin et al. for descriptions of the characteristics of each function [29]. However the form of each sigmoid function used to model water profiles is given in Equations (1)-(5) below:
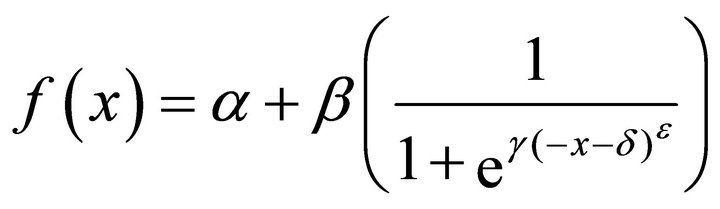 modified logistic (1)
 Richards-Gompertz (2)
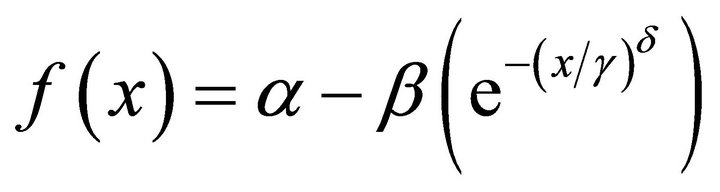 Weibull (3)
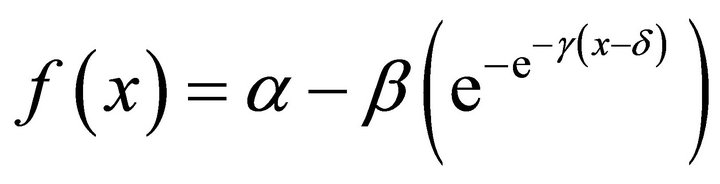 Gompertz (4)
 Richards (5)
Each water profile is modeled with each function using the Nelder-Mead non-linear optimization algorithm within Matlab [30]. Thus, each of up to five adjustable
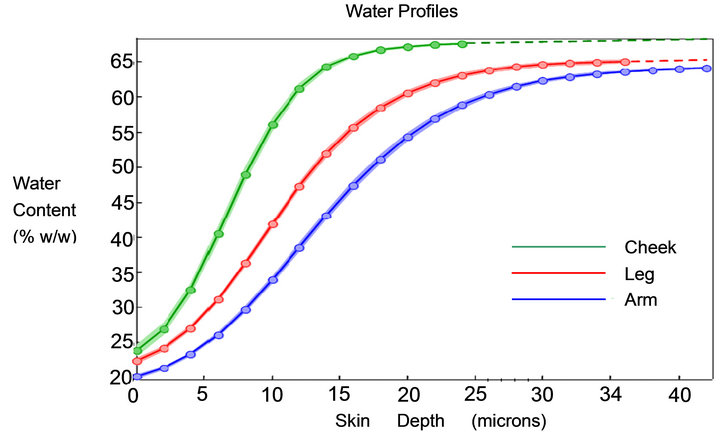
Figure 3. Water profiles from CRS plotted with standard error cloud from cheek, forearm and leg. The dashed curves are the extrapolation of modeled data.
parameters is simultaneously fitted to each function in a least-squares sense. The adjustable parameters α, β, γ, δ, ε, and φ determine the offset, slope, curvature, symmetry, and sharpness of the S-character of the function, which in turn determine the characteristics of each fitted curve.
2) Calculate inflection of the sigmoid function, three different algorithms are used. Since the curvature, slope, and symmetry characteristics for each of the five fitting function varies according to the γ, δ, ε, and φ, the numerical solution to the selection of inflection point representing the bottom of the SC has to be determined to accommodate the different nature of the curves. Therefore three different methods were employed that give a range of solutions. This allows the final trimming of the SC thickness values to encompass those values that are extreme relative to the mean value. Figure 4 shows a graphical representation of the three inflection calculations. The depth position of the bottom of the stratum corneum and therefore the stratum corneum thickness is determined using the three different numerical differentiation methods shown which are applied directly to the sigmoid fitted water profiles: minimum value of the 1st derivative, maximum of the minor node of the 5th derivative, and the maximum of the 1st derivative of the log. Additional inflection selection algorithms could be chosen but the three used here span the range of the types of data acquired under most normal measurements of skin.
3) Each of these methods produces a biased value that must be corrected empirically or through standardization to another SC thickness measurement. Initial calculations showed that the bias correction should be approximately 0.75 based on empirical evaluation of the profiles themselves from historical data. In this work it was observed and corrected through calibration. The bias correction is a simple multiplier which is applied to the actual SC thickness values. The source of the bias is not known and is something that should be studied in the future so it can be added into the modeling process. Once the correction is applied, the consensus of data profiles from models with the best fit to the applied functions is averaged for the final result. The selection of best profiles and most likely SC values is computed from the trimmed mean of SC thickness values for 90% of the SC thickness distribution.
We have chosen to model each individual water profile and then generate the mean profile after the modeling and trimming of individuals. There are a number of reasons for taking this approach, however before expanding on these reason it should be emphasized that the mean of the fitted profiles is not identical to the fitted profile of the mean. In choosing to model data from the mean expression rather than the other way round the subtle aspects of the water profiles are removed, or averaged out, an additional motivation for taking this approach is one of sensitivity. It is unclear at this point how large a difference in the adjustable parameters is required to have a significant influence on the final SC thickness calculation. Therefore, until this aspect of the SC thickness modeling has been thoroughly studied, it is beneficial to retain small differences resulting from the modeling process. Therefore the mean must be computed after the trimming process and not before. The importance of this goes to the procedural aspect of the analysis to determine the most robust way to analyze the data.
3.3. Correlation to Confocal Reflectance Microscopy
For Raman SC thickness value to be fully accepted a realistic evaluation of the uncertainty in the value needs to be obtained. In order to do this a reference method that would serve as a “gold standard” for comparison needs to be chosen. The method used here is based on reflectance confocal microscopy (RCM). This method was developed by Huzaira and is considered to be one of the best methods for determining SC thickness [31]. The basic idea of the Huzaira method is to look down through the
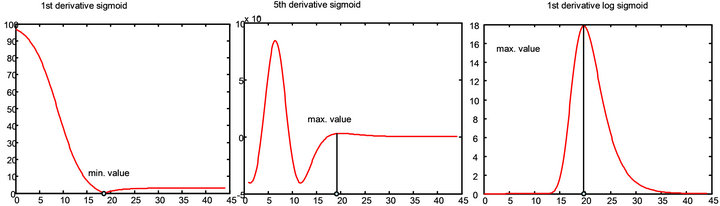
Figure 4. Graphical examples of the three inflection point determination methods used to calculate SC thickness: 1st derivative, 5th derivative, and 1st derivative of the log.
stack of z-depth x-y images starting from the top of the SC (Figure 5 left) until the Granular layer is visually recognized (Figure 5 right). Figure 5 shows examples of what the visible features of skin look like. The difference in the z-direction between these two images is the SC thickness.
3.4. Instrumentation and Data Processing
In-vivo confocal Raman spectrometer (Model 3510 SkinAnalyzer, River DiagnosticsTM, Rotterdam, Netherlands) was used for all Raman measurements. The 671 nm laser configuration was used for the high wavenumber region measurement (2500 - 4000 cm–1) for all water measurements.
In-vivo reflectance confocal microscopy (RCM) was performed using a Vivascope 1500+ microscopy system (Lucid, Rochester, NY) equipped with a 785 nm near-IR laser diode for illumination and a raster system for scanning across the field of view.
The Raman data was processed using software developed by the authors, which in principal follows the method described by Puppels et al. [32,33]. This software was used instead of the in-vivo Raman instrument soft-ware in order to compensate for a number of features in the data that potentially interfere with computation of the water profiles such as baseline spectral distortion, excessive spectral noise, interfering background artifacts and a non-linear baseline. RCM data was analyzed as described in the “Correlation to confocal reflectance microscopy” section above. All data processing was done in Matlab Version 7.4.0.287 (The MathWorks, Inc., Natick, MA USA).
4. Results and Discussion
4.1. Distribution of Water Profile Shape and SC Thickness by Body Site
The first objective of study was to test the validity of our assertion that the Raman consensus method was a better method of fitting and modeling SC thickness than the existing single algorithm approaches. Since the premise is that a number of fitting algorithms are needed to best model that data, then it’s clear that one of the ways to make this determination is through measuring the frequency with which each model provides the best fit to the profiles. The result is a chart of frequency of best fit for each of the five modeling methods. Additionally, this can be done from both a global perspective and a local skin-site perspective in order to provide information about best models for different skin sites (and thickness). The results of this analysis are shown in the plots in Figure 6.
The plots in Figure 6 show that, in fact, there is a distribution of functions that produce the best model fit for different Raman water profiles. This is true when viewed from either a global skin site independent view as seen from the top plot in the figure, or seen from a local skin site specific point of view as shown in the bottom three figures. There is some indication from the frequencies of the distribution that some particular types of sigmoid functions generally perform better than others. The Richards-Gompertz sigmoid provides the best overall fit

Figure 5. RCM images of skin from the volar forearm. (Left Image) Stratum corneum is characterized by a highly reflective, textured surface. The diffuse ring around the outside of the image is a reflection from the stabilizing window. (Right Image) The cells in the granular layer become clearly visible at imaging depths just beneath the SC. The left image is 16 microns below the surface image shown in right image.
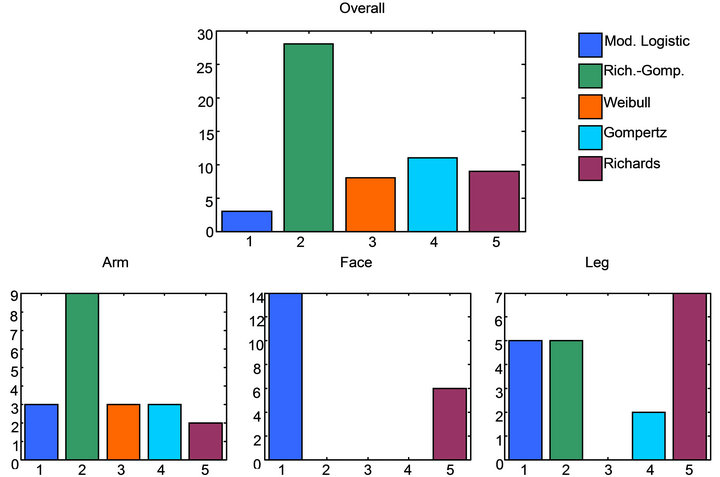
Figure 6. Bar charts showing the frequency of the different modeling functions with the least model error by individual body site and over all body sites. The method with the highest frequency indicated best model. The charts show that no single function will model all profiles in an optimal way. A number of profiles are needed to capture the diversity of the profile shapes.
of the data and the best fit for forearm data, while the Richards and modified logistics sigmoid provides the best fitting for the leg and cheek data respectively. However it is also clear that no single function provides the best fitting solution for all of the data. This is the most important point! If any single sigmoid was always the best function for fitting the data then all four plots in Figure 5 would have a single bar of the same color. This is not the case because a distribution of solutions is needed for different profiles for different site types. This supports the hypothesis that a distribution of solutions is required, not a single solution.
A second objective of the study was to evaluate the overall modeling methods for SC thickness. This constitutes both the fitting of the Raman water profiles and the inflection point computation. This was done by comparing the absolute SC thickness values for each individual sigmoid model compared to the final Raman consensus method results. The assumption is that the consensus method provides the expectation results and represents the best estimate of the true SC thickness values. This assumption was tested and verified by the results from Study-2 which is described in the next section. The Raman consensus SC thickness results and the individual function SC thickness results were computed and the root mean squared error (RMSE) computed for each. The functions exhibiting the minimum mean SC thickness RMSE are considered the best solution. Figure 6 shows the results of the minimum mean RMSE for overall global results and individual skin site results.
The results shown in Figure 7 show that, like the fitting functions, a distribution of models is needed to obtain the best results for SC thickness values including fitting sigmoid and SC thickness algorithm method results. Unlike the sigmoid fitting data, the best SC thickness determination method is the modified logistics sigmoid for all but the face data for which the Richards sigmoid was optimal. However, clearly the best solutions are not as clear-cut in this data compared to that for the fitting data. The RMSE values for the best results are in general very close to one or more of the other models for each plot. This just serves to emphasize the point that no one sigmoid function, or combination of sigmoid function and SC modeling method is optimum, and that a distribution of fitting functions and SC modeling methods are required to capture the inherent diversity in the water profile data to provide the best solution.
4.2. Correlation between Raman and RCM Derived SC Thickness
The second aspect of the study was to determine how the Raman consensus method compared to the SC thickness calculated using the standard referee method by Huzaira [31]. The data was collected and tabulated according to the methods already described. Corresponding SC thickness
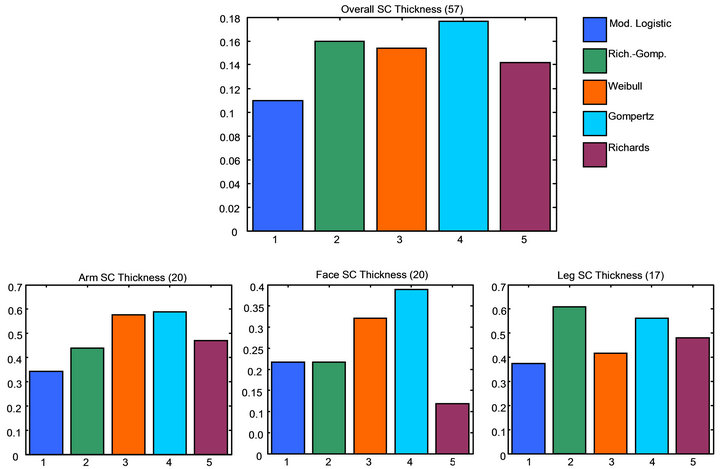
Figure 7. Bar charts showing the RMS error for SC thickness calculation for different modeling functions by individual body site and over all body sites. A smaller value means the SC thickness values were closer to the consensus result. This is an indication of which individual functions produced a result nearest to the expected result. Numbers inside () indicate number of subjects.
data was generated for all subjects for each site and for each measurement method. The data was then compared using linear regression modeling. Predictions statistics were computed using a leave-one-out cross validation (LOO-CV) where models are built after removing one sample and then predicting the sample left out with that model. This is done for all samples. RMSE values were computed based on the LOO-CV analysis. The final model was computed and the mean regression bias computed for all data.
As mentioned previously in this paper, the Raman SC thickness method is biased and requires a linear correction to the computed values. Initially the empirical correction value was estimated to be 0.75. The actual bias computed from the regression model was found to be 0.83, which suggested that the empirical bias correction estimated from the initial data was reasonable given the measurement error. The results of the linear regression are shown in Figure 8.
The regression results were calculated over all body sites and showed an R2 = 0.68 and RMSE of CV of 3.7 μm. While this is a reasonably good correlation and demonstrates that the two methods are reasonably equivalent, the error in the measurement suggests that only large difference in skin thickness > 3 - 4 μm could be measured reliably. What this means is that the method would be useful for comparing skin with large differences in SC thickness but the sensitivity of the measurement would be compromised. Small changes would not be seen by this method as being statistically significant.
Our analysis also computed the mean SC thickness according to skin site. Table 1 shows that after bias correction, the results of the SC thickness between the two methods are comparable, and within the standard error of the method. While correlation for individual skin site is not computed, inspection of the regression plot shows that the correlation is good for the thicker skin sites (leg and forearm) but poor for cheek. This is the expected results given the difficulty in measuring the cheek and that fact that the cheek is the thinness skin site
5. Conclusion
The work described in this paper shows that the new consensus Raman SC water profile fitting method combined with different SC thickness modeling methods

Figure 8. Linear regression correlation plot for SC thickness comparing RCM and CRS The plot shows good correlation between the two methods across the three body sites measured (R2 = 0.68). Error in the SC thickness determination for the CRS method is RMSE = 3.7 μm.
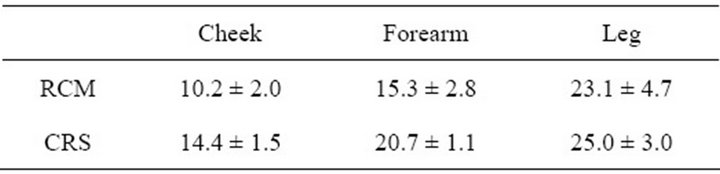
Table 1. Comparison of the mean SC thickness with corresponding standard errors for reflectance confocal method and confocal Raman method. Values are averaged over all three body sites (arm, leg, cheek).
provides a basis for an improved algorithm for stratum corneum thickness determination from in-vivo confocal Raman microspectroscopy water profiles. The results show conclusively that a consensus method for computing SC thickness from Raman water profiles is required for the best solution for normal water profile data. We have also shown that there are real differences in requirements for modeling different body sites, all of which require a combination of fitting functions. Our studies show that that this new methodology exhibits good correlation with the accepted standard method of Huzaira using reflectance confocal microscopy. The main deficiency we found is that the uncertainty in the new method was larger than one would like to see because it compromises the sensitivity in the measurement. One way to improve the measurement reliability would be through rigorous modeling of the data and better statistical design of the studies. Future work will also focus on improving the methodology through a rigorous approach to statistical aspects of the data analysis using a probabilistic representation of the numerical solution.
6. Acknowlegements
The authors would like to thank Dr. Paul Pudney of Unilever Research Colworth for his useful comments and suggestions during editing of this paper.
REFERENCES
- C. H. Watkinson, A. Moore and P. Coan, “Water Modulation of Stratum Corneum Chymotryptic Enzyme Activity and Desquamation,” Archives of Dermatological Research, Vol. 293, No. 9, 2001, pp. 470-476. doi:10.1007/s004030100257
- L. Gerhardt, A. Lenz, N. Spencer, T. Münzer and S. Derler, “Skin-Textile Friction and Skin Elasticity in Young and Aged Persons,” Skin Research and Technology, Vol. 15, No. 3, 2009, pp. 288-298. doi:10.1111/j.1600-0846.2009.00363.x
- Y. Tomita, M. Akiyama and H. Shimizu, “Stratum Corneum Hydration and Flexibility Are Useful Parameters to Indicate Clinical Severity of Congenital Ichthyosis,” Experimental Dermatology, Vol. 14, 2005, pp. 619- 624. doi:10.1111/j.0906-6705.2005.00341.x
- J. Sato, M. Yanai, T. Hirao and M. Denda, “Water Content and Thickness of the Stratum Corneum Contribute to Skin Surface Morphology,” Archives of Dermatological Research, Vol. 292, No. 8, 2000, pp. 412-417. doi:10.1007/s004030000143
- M. Egawa and T. Kajikawa, “Changes in the Depth Profile of Water in the Stratum Corneum Treated with Water,” Skin Research and Technology, Vol. 15, 2009, pp. 242-249. doi:10.1111/j.1600-0846.2009.00362.x
- I. Blank, J. Moloney, A. Emslie and I. Simon, “The Diffusion of Water across the Stratum Corenum as a Function of Its Water Content,” Journal of Investigative Dermatology, Vol. 82, 1984, pp. 188-194. doi:10.1111/1523-1747.ep12259835
- J. Bouwstra, A. de Graaff, G. Gooris, J. Nijsse and J. Wiechers, “Water Distribution and Related Morphology in Human Stratum Corneum at Different Hydration Levels,” Journal of Investigative Dermatology, Vol. 120, 2003, pp. 750-758. doi:10.1046/j.1523-1747.2003.12128.x
- K. Holbrook and G. Odland, “Regional Differences in the Thickness (Cell Layers) of the Human Stratum Corneum: An Ultrastructural Analysis,” Journal of Investigative Dermatology, Vol. 62, 1974, pp. 415-422. doi:10.1111/1523-1747.ep12701670
- Y. Kalia, F. Pirot and R. Guy, “Homogeneous Transport in a Heterogeneous Membrane: Water Diffusion across Human Stratum Corneum in Vivo,” Biophysical Journal, Vol. 71, No. 5, 1996, pp. 2692-2700. doi:10.1016/S0006-3495(96)79460-2
- F. Pirot, Y. Kalia, A. Stinchcomb, G. Keating, A. Bunge and R. Guy, “Characterization of the Permeability Barrier of Human Skin in Vivo,” Proceedings of the National Academy of Sciences of the USA, Vol. 94, No. 4, 1997, pp. 1562-1567. doi:10.1073/pnas.94.4.1562
- J. Nikolovski, G. Stamatas, N. Kollias and B. Wiegand, “Barrier Function and Water-Holding and Transport Properties of Infant Stratum Corneum Are Different from Adult and Continue to Develop through the First Year of Life,” Journal of Investigative Dermatology, Vol. 128, 2008, pp. 1728-1736. doi:10.1038/sj.jid.5701239
- K. Miyamoto, H. Takiwaki, G. Hillebrand and S. Arase, “Utilization of a High-Resolution Digital Imaging System for the Objective and Quantitative Assessment of Hyperpigmented Spots on the Face,” Skin Research and Technology, Vol. 8, 2002, pp. 73-77. doi:10.1034/j.1600-0846.2001.80202.x
- J. Leyden and A. Rawlings, “Cosmetic Science and Technology Series Volume 25: Skin Moisturization,” Marcel Dekker, Inc., New York, 2002.
- J. Rim, S. Jo, J. Park, B. Park and J. Y. Ji, “Electrical Measurement of Moisturizing Effect on Skin Hydration and Barrier Function in Psoriasis Patients,” Clinical Experimental Dermatology, Vol. 30, 2005, pp. 409-413. doi:10.1111/j.1365-2230.2005.01773.x
- J. Nebus, F. Costes, W. Wallo and E. Kurtz, “Clinical Improvements in Skin Tone and Texture Using a Facial Moisturizer with a Combination of Total Soy and SPF30 UVA/UVB Protection,” Journal of the American Academy of Dermatology, Vol. 54, 2006.
- P. Caspers, G. Lucassen and G. Puppels, “Combined in Vivo Confocal Raman Spectroscopy and Confocal Microscopy of Human Skin,” Biophysical Journal, Vol. 85, 2003, pp. 572-580. doi:10.1016/S0006-3495(03)74501-9
- M. Egawa and H. Tagami, “Comparison of the Depth Profiles of Water and Water-Binding Substances in the Stratum Corneum Determined in Vivo by Raman Spectroscopy between the Cheek and Volar Forearm Skin: Effects of Age, Seasonal Changes and Artificial Forced Hydration,” British Journal of Dermatology, Vol. 158, 2008, pp. 251-260. doi:10.1111/j.1365-2133.2007.08311.x
- M. Egawa, T. Hirao and M. Takahashi, “In-Vivo Estimation of Stratum Corneum Thickness from Water Concentration Profiles Obtained with Raman Spectroscopy,” Acta Dermato Venereologica, Vol. 87, No. 1, 2007, pp. 4-8. doi:10.2340/00015555-0183
- J. Crowther, A. Sieg, P. Blenkiron, C. Marcott, P. Matts, J. Kaczvinsky and A. Rawlings, “Measuring the Effects of Topical Moisturizers on Changes in Stratum Corneum Thickness, Water Gradients and Hydration in Vivo,” British Journal of Dermatology, Vol. 59, 2008, pp. 567-577.
- S. Bielfeldt, V. Schoder, U. Ely, A. van der Pol, J. de Sterke and K. Wilhelm, “Assessment of Human Stratum Corneum Thickness and Its Barrier Properties by in-Vivo Confocal Raman Spectroscopy,” IFSCC Magazine, Vol. 12, 2009, pp. 1-8.
- J. Wu and T. Polefka, “Confocal Raman Microspectroscopy of Stratum Corneum: A Pre-Clinical Validation Study,” International Journal of Cosmetic Science, Vol. 30, 2008, pp. 47-56. doi:10.1111/j.1468-2494.2008.00428.x
- M. Boncheva, J. de Sterke, P. Caspers and G. Puppels, “Depth Profiling of Stratum Corneum Hydration in Vivo: A Comparison between Conductance and Confocal Raman Spectroscopic Measurements,” Experimental Dermatology, Vol. 18, No. 10, 2009, pp. 870-876. doi:10.1111/j.1600-0625.2009.00868.x
- H. Mogensen, H. Morsy, L. Thrane and G. Jemec, “Morphology and Epidermal Thickness of Normal Skin Imaged by Optical Coherence Tomography,” Clincal and Laboratory Studies, Vol. 217, No. 1, 2008, pp. 14-20.
- J. Weissman, T. Hancewicz and P. Kaplan, “Optical Coherence Tomography of Skin for Measurement of Epidermal Thickness by Shapelet-Based Image Analysis,” Optics Express, Vol. 12, No. 23, 2004, pp. 5760-5769. doi:10.1364/OPEX.12.005760
- S. Nouveau-Richard, M. Monot, P. Bastien and O. De Lacharriere, “In Vivo Epdiermal Thickness Measurement: Ultrasound vs Confocal Imaging,” Skin Research and Technology, Vol. 10, No. 2, 2004, pp. 136-140. doi:10.1111/j.1600-0846.2004.00067.x
- T. Gambichler, R. Matip, G. Moussa, P. Altmeyer and K. Hoffmann, “In Vivo Data of Epidermal Thickness Evaluated by Optical Coherence Tomography: Effects of Age, Gender, Skin Type, and Anatomic Site,” Journal of Dermatological Science, Vol. 44, No. 3, 2006, pp. 145-152. doi:10.1016/j.jdermsci.2006.09.008
- M. Mogensen, B. Nurnberg, J. Forman, J. Thomsen, L. Thrane and G. Jemec, “In Vivo Thickness Measurement of Basal Cell Carcinoma and Actinic Keratosis with Optical Coherence Tomography and 20-MHz Ultrasound,” British Journal of Dermatology, Vol. 1, 2009, pp. 1-7.
- A. van der Pol, J. de Sterke and P. Caspers, “Modeling and Interpretation of Water Concentration Gradients in the Stratum Corneum as Measured by Confocal Raman Microspectroscopy,” Journal of Cosmetic Science, Vol. 29, No. 3, 2007, p. 235.
- X. Yin, J. Goudriaan, E. A. Lantinga, J. Vos and H. J. Spiertz, “A Flexible Sigmoid Function of Determinate Growth,” Annals of Botany, Vol. 91, No. 3, 2003, pp. 361-371. doi:10.1093/aob/mcg029
- J. A. Nelder and R. Mead, “A Simplex Method for Function Minimization,” Computer Journal, Vol. 7, No. 4, 1965, pp. 308-313. doi:10.1093/comjnl/7.4.308
- M. Huzaira, F. Ruis, M. Rajadhyaksha, R. Anderson and S. González, “Topographic Variation in Normal Skin, as Viewed by in Vivo Reflectance Confocal Microscopy,” Journal of Investigative Dermatology, Vol. 116, 2001, pp. 846-852. doi:10.1046/j.0022-202x.2001.01337.x
- P. Caspers, G. Lucassen, E. Carter, H. Bruining and G. Puppels, “In Vivo Confocal Raman Microspectroscopy of the Skin: Noninvasive Determination of Molecular Concentration Profiles,” Journal of Investigative Dermatology, Vol. 116, 2001, pp. 434-442. doi:10.1046/j.1523-1747.2001.01258.x
- P. Caspers, G. Lucassen, H. Bruining and G. Puppels, “Automated Depth-Scanning Confocal Raman Microspectrometer for Rapid in Vivo Determination of Water Concentration Profiles in Human Skin,” Journal of Raman Spectroscopy, Vol. 31, No. 8-9, 2000, pp. 813-818. doi:10.1002/1097-4555(200008/09)31:8/9<813::AID-JRS573>3.0.CO;2-7
NOTES
*Current address: Perkin-Elmer, Chicago, USA;
#Current address: Jesse M. Weissman Consulting Inc., New York, USA
†Corresponding author.

1Hancewicz et al., an improved method for SC thickness determination using in-vivo Raman spectroscopy, Unilever R&D, Trumbull, 2009.