American Journal of Operations Research
Vol. 2 No. 4 (2012) , Article ID: 25141 , 6 pages DOI:10.4236/ajor.2012.24055
A Type of Combination Forecasting Method Based on Time Series Method and PLS*
1School of Management, University of Science and Technology of China, Hefei, China
2School of Business, Anhui University, Hefei, China
Email: ustcji@163.com
Received June 17, 2012; revised July 15, 2012; accepted July 30, 2012
Keywords: PLS; Time Series Method; Combination Forecast Method; Sales Forecasts
ABSTRACT
This paper depends on the panel data of Anhui province and its 17 cities’ cigarette sales. First we established three single forecasting models (Holter-Wintel Season product model, Time series model decomposing model and Partial least square regression model), after getting the predicted value of cigarette sales from these single models, we then employ the combination forecasting method based on Time Series method and PLS to predict the province and its 17 cities’ cigarette sales of the next year. The results show that the accuracy of prediction is good which could provide a reliable reference to cigarette sales forecasting in Anhui province and its 17 cities.
1. Introduction
Although research on the cigarette market in developed countries is already quite mature, but there is few related research on the domestic market. Mao (2003) used the survey data obtained in eight cities and 16 counties to analyze the influence of income level, age, cigarette prices on cigarette consumption; he also estimated the residents’ consumption demand of cigarettes of our national [1]. Xu X., Hu T. and Keeler T. (1998) all used annual data from 1978 to 1992 to analyze the demand for cigarettes of Chinese residents, they have found out the price elasticity range of cigarette consumption demand in China [2]. Chinese Center for Disease Control and Prevention (CDC) launched a special investigation in the country’s 30 provinces (municipalities) from March to July in 1996, they analyzed the relationship between gender, age, income level, age, educational background, smoking history, smoking cessation and the cigarette consumption.
To specific prediction methods, as cigarette sales have overall trend volatility and seasonal volatility at the same time, thus its prediction belongs to double trend forecasting. Against the overall trend volatility, Xi H. (2007) studied domestic cigarettes consumption by factor analysis and prospect forecasting; Duan L. D. (2007) studied the different demand for tobacco category of different income of consumers, he studied from the point of consumer’s structure and consumption characteristics; Peter M. L., John S. A., William H. D. [3] and Mao [1] also carried out similar studies. Bai Y, Liang Y. L. and Chen X. S. (2007) used the Theil-Batten demand model to analyze the impact of household consumption expenditure, cigarette prices and regional differences on demand for cigarettes in China [4,5]. Against the seasonal volatility, there are few current studies, for example Sheng H. and Zhou P. used extension clustering prediction method to predict the cigarette sales of a region in Yun’nan province.
In addition, factors that influence cigarette sales in China is various and complicated, prediction research scholars, public health experts and economists mostly use the traditional multivariate statistical methods, when these methods are used in the actual modeling, they will encounter multicollinearity between the various influencing factors, and short data series, and other issues, this will largely affected the accuracy of the prediction model [6,7]. As PLS not only can solve the existence of multiple correlation problems in the multiple regression independent variable system, but also can create the regression model when the sample size is less than the number of variables. Therefore, in recent studies, It has gradually been accepted and has been applied, for example, Li W. and Chen H. W. (2009) used PLS to analyze the cigarette consumption data and the main economic factors that influence cigarette consumption in Zhangzhou city, the results show that the fitting effect of the model and the accuracy of prediction is good [8].
Single forecasting models all have their own characteristics, advantages and disadvantages, when employing any one of them alone, we can only use a certain point of the effective information. Furthermore, single model will also be affected by the model’s set conditions and other factors, therefore, when in predictions, it often demonstrates that the range of information sources is not enough, and the forecasting accuracy is difficult to meet the requirement [9]. The choice of a forecasting method should consider the prediction object, forecasting range, as well as the data and other factors, so we can comprehensively use the advantages of the single prediction method. In this case, the importance of the combination forecasting method has been put on the agenda. Based on the above discussions, this paper considers the characteristics of double trend (long-term trend factors and seasonal factors for cigarette sales), historical sales data and other main factors that affect cigarette sales. Then based on Anhui province and its 17 cities’ cigarette sales panel data, first we established three single forecasting models (PLS, Holter-Winter season product model, time series decomposition model), after getting the predicted value of these single models, we then employ the combination forecasting method to predict the province and its 17 cities’ cigarette sales of the next year, so as to further improve the prediction accuracy.
2. The Principle of PLS
Partial Least Square (PLS) analysis is a new type of multivariate statistical data analysis methods which is extracted from the application field, it was proposed by S. Wold and C. Albano (1983) [10]. This analysis method is mainly applied to linear regression modeling between multi-dependent variables and multi-independent variables, and it can effectively solve many complex problems that an ordinary multiple linear regression cannot solve. S. Wold [11] and Höskuldsson [12] pointed out that it not only can solve the existence of multiple correlation problems in the multiple regression independent variable system, but also can create the regression model when the sample size is less than the number of variables. The PLS regression method is a improvement of the Principal Component Regression (PCR) analysis method, in the process of extracting component, PLS not only takes the information of the independent variables into account, but also incorporates the information of the dependent variables, it also overcomes the adverse effects of multicollinearity in system modeling, and leading to a more reliable analysis results.
Because this research mainly talks about the prediction of cigarette sales, involving only one dependent variable (cigarette sales), it is necessary to introduce the regression method of single dependent variable of PLS. Given that the dependent variable is Y and P numbers of independent variables form the independent variables set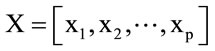 , first, PLS regression method extracts t1 from the matrix, it is required that it should carry the variation information in X as far as possible, it should also have a great relevance to Y. If the regression equation has reached a satisfactory accuracy, then the algorithm terminates. Otherwise, using the residual information that X has been explained by t2 and the residual information that Y has been explained by t1 to do the second round of component extraction, so back and forth, until you can reach a satisfactory statistical accuracy. Assuming that we finally extract m components from X, they are t1, t2, ··· , tm, then PLS will establish the regression between Y and t1, t2, ··· , tm, finally expressed as a regression equation of Y on the original variable X.
3. Empirical Study
3.1. Data Collection
We obtained Anhui province and its 17 cities’ actual cigarette annual sales data and monthly sales data (January 2004 to August 2011) from Anhui province’s Tobacco Monopoly Bureau (company). Before 2004, the tobacco system’s information management is not well organized, sales data was manual recorded and incomplete, and some data is lost, so the previous data is not used in this study.
To do monthly cigarette sales forecasting, we use a sample of data from January 2004 to December 2010, namely 7 years, a total of 84 samples, and we also use the data from January 2004 to August 2011 to do comparative analysis.
In the process of using PLS, it will involve many complex factors that affect the sales of cigarettes, in view of authoritative and the availability of data, this research selects the indicators from “Anhui Statistical Yearbook” [13], cities statistical yearbook and bulletins. The indicators which we select are specific shown in Table 1.
3.2. Data Processing
To Holter-Winter season product model and time series decomposition method, we use EViews6.0 [14] for data processing. To PLS combined model, this study use SPSS16.0 and SIMCA-P12.0 for data processing.
3.2.1. The Forecasting Results of Single Prediction Models
Considering that the forecasting steps of a single prediction model are too many, in view of the reasons of space, in this paper, we give the finally prediction effect fitting figure or other core steps of the three single prediction models.
By calculating, the annual forecasting absolute error range of Holter-Winter season product model is between –13223.389 to 827.463, the mean relative error is –0.27%, range between –0.75% to –0.05%, from the Figure 1 we can also make an intuitive judgment that the forecasting results are satisfactory, namely the prediction accuracy of Holter-Winter seasonal product model is good.
By calculating, the annual forecasting absolute error range of time series decomposition model is between –14479.355 to 3763.287, the mean relative error is –0.393%, range from –0.853% to 0.202%. From the Figure 2 we can see that the forecasting results is satisfactory, namely the prediction accuracy of Holter-Winter seasonal product model is good.
Table 2 is the correlation matrix of Anhui province’s cigarette sales and its influencing factors, in Table 2, we can see that there is a high degree of correlation between the cigarette sales and the influencing factors, and there is also a high degree of linear correlation among the influencing factors, further prove that using PLS for combination forecasting is necessary.
By calculating, the annual forecasting absolute error range of PLS is between –7589.495 to 7140.018, the mean relative error is 0.00039%, range from –0.1943% to 0.1708%. From the Figure 3 we can see that the forecasting results is satisfactory, namely the prediction accuracy of PLS is good.
We can see from the above figure that the data points
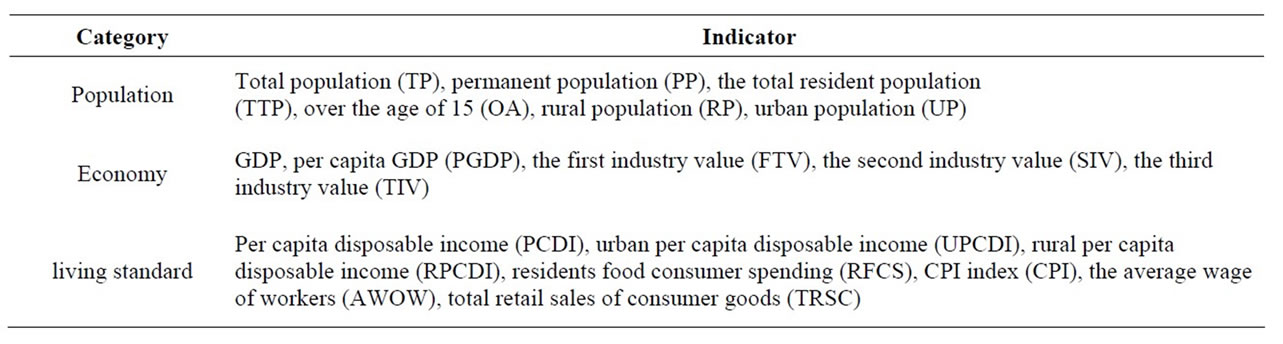
Table 1. Influence factors indicators selection.
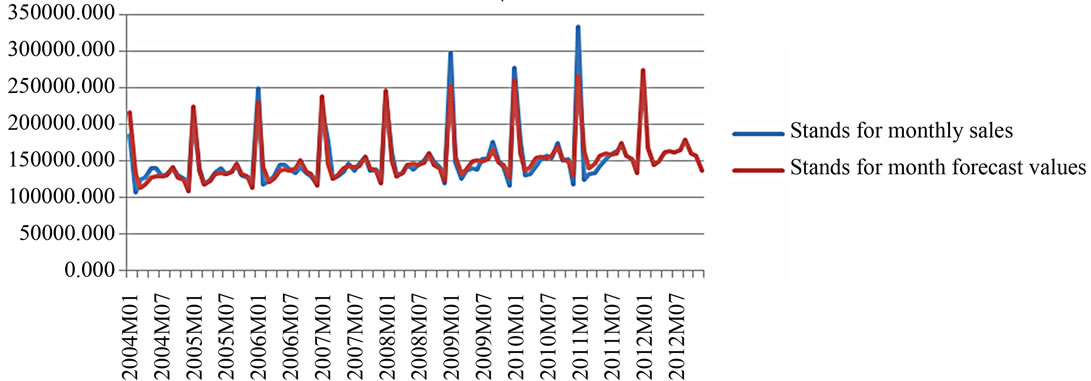
Figure 1. The fitting effect figure of Holter-Winter season product model.
Figure 2. The fitting effect figure of time series decomposition model.
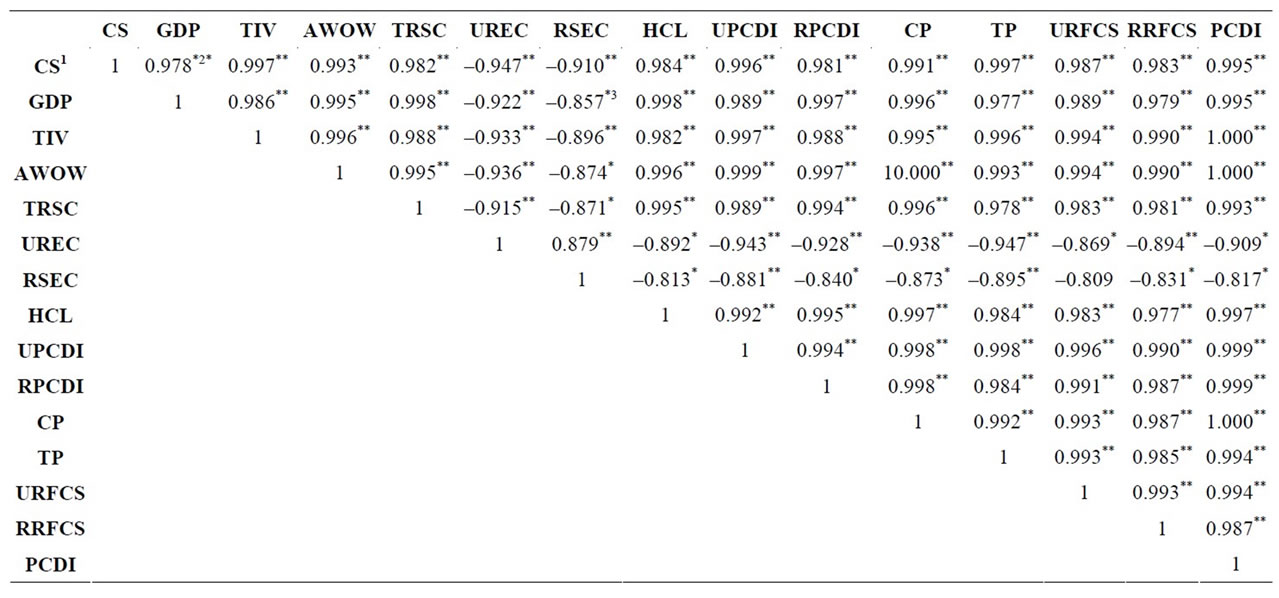
Table 2. The correlation matrix of the influencing factors.
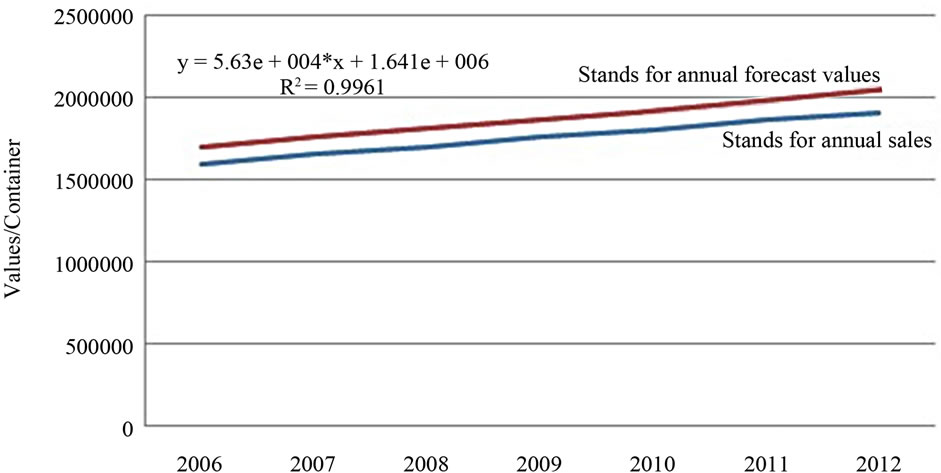
Figure 3. Regression analysis of original and observation value.
constituted by predicted values and the original observation values are distributed near the diagonal of the regression graph, further calculation shows that the regression coefficient of original observations and predicted values is 0.9961, this indicates that the difference between predicted values and original values is small, the fitting results is good, further demonstrates that the effect of using this model to analyze Anhui province’s cigarette consumption demand is very good, it can greatly improve the prediction accuracy of the cigarette sales of the coming year.
3.2.2. Comparing between the Prediction Results of the Three Single Prediction Models
We use Anhui Province Tobacco Company’s sales data from 2004-01 to 2011-08 as the researching object of this study, first we established three single forecasting models to predict the province and its 17 cities’ cigarette sales of the next year. We then employ the combination forecasting method to predict the province’s cigarette sales of the next year, so as to further improve the prediction accuracy. At last, we select the most accurate model’s predicted value as the reference point (three single models, one combination model), we chose two standard deviations (SD) as the floating range, then we can get the cigarette sales forecasting range, forecasting results are shown Table 3.
In order to compare the prediction accuracy of the three single prediction models, we use forecast absolute error sum of squares as the index to measure the prediction accuracy of the model, prediction error sum of squares is an good indicator of the prediction accuracy, the comparison results of prediction accuracy of the three single forecasting models are shown in Table 4. From the comparison results we can see that compared whit the single forecasting models, the prediction accuracy of the combination model (CM) is higher, PLS’s prediction accuracy is close to the combination model, but the time series decomposing model and the Holter-Winter season product model’s accuracy is relatively poor. Thus, the combination prediction method proposed in this study can effectively use the advantages of the single prediction model, it has a practical significance to raise the accuracy of cigarette prediction.
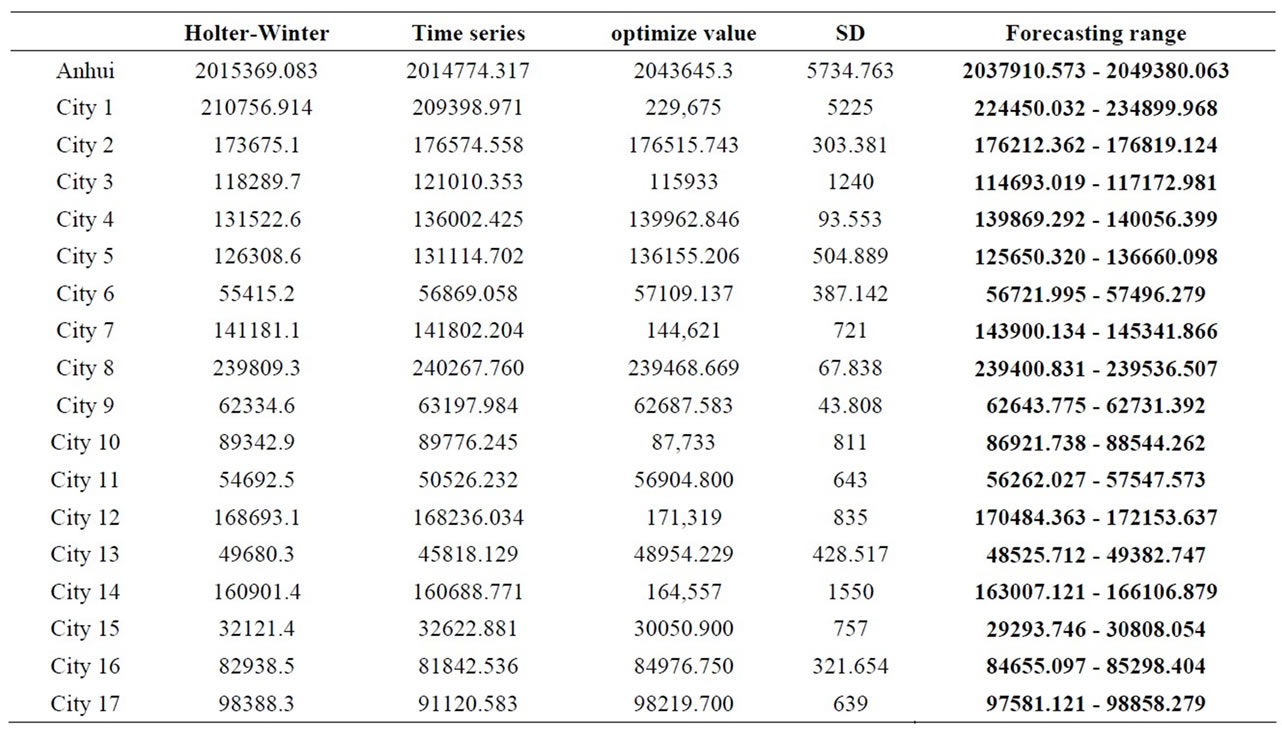
Table 3. The predicting outcomes of this four models.
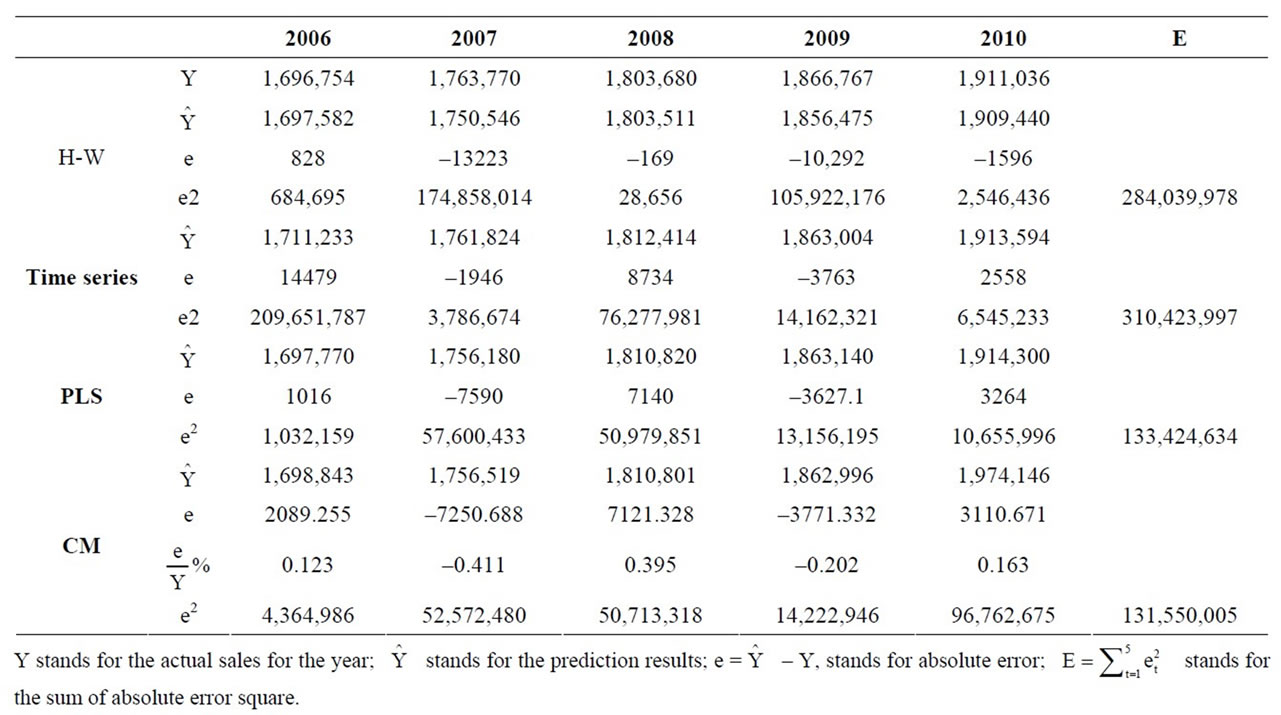
Table 4. The comparing of this four models.4
4. Conclusions
In this study, we overview the combination forecasting methods and models, on the basis of summing up the achievements of previous studies, this paper presents a new combination forecasting method based on PLS and time series method, and we use it to predict the cigarette sales of Anhui province in 2012. The results here show that, the fitting index between prediction results and actual sales of each single prediction model is good. Comparing with the single prediction model, the prediction accuracy of the combination forecasting model is improved obviously, shows that this method can effectively integrated the information of single forecasting methods, and it is effective and feasible.
Through this study, we can see that the prediction accuracy of either single or combination model has reached a high level, Beside this, it should be noted that the expected cigarette sales given in this study is only a reference value, When faced with actual sales tasks, we cannot rely on it completely but should incorporate historical sales information and the expected economic growth of Anhui province to develop an appropriate and reasonable sales target or scheduler.
REFERENCES
- Z.-Z. Mao, G.-H. Yang, J.-M. Ma, S. Jon and C. Marion, “Adults’ Demand of Cigarettes and its Influencing Factors in China,” Soft Science of Health, Vol. 17, No. 2, 2003, pp. 19-23.
- X. Xu, T. Hu and T. Keeler, “Optimal Cigarette Taxation: Theory and Estimation,” Working Paper, University of California at Berkeley, Berkeley, 1998, pp. 2-15.
- P. M. L, J. S. Akin, W. H. Dow, et a1., “Is Cigarette Smoking in Poorer Nations Highly Sensitive to Price,” Journal of Health Economics, Vol. 23, No. 1, 2004, pp. 173-189. doi:10.1016/j.jhealeco.2003.09.004
- Y.-L. Bai, Y.-L. Wu and X.-S. Cheng, “An Analysis of Cigarette Demand in China (I)—Current Status and Model Building,” Acta Tabacaria Sinica, Vol. 13, No. 3, 2007, pp. 6-10.
- Y.-L. Bai, Y.-L. Wu and X.-S. Cheng, “An Analysis of Cigarette Demand in China (II)—Demonstration Analysis and Conclusion,” Acta Tabacaria Sinica, Vol. 13, No. 4, 2007, pp. 55-59.
- Z.-Y. Hu, J.-J. Wang and C.-Q. Ma, “Empirical Analysis of Impact Factors of Electricity Power Consumption in Hunan Province Based on PLS,” Systems Engineering, Vol. 24, No. 9, 2006, pp. 98-102.
- H.-W. Wang, Z.-B. Wu and J. Meng, “The Linear and Nonlinear Method of Partial Least-Square Regression,” National Defence Industry Press, Beijing, 2006.
- W. Li, H.-W. Chen, J.-H. Zhou, B.-D. Zhao, Y.-Y. Zhang, H.-Q. Yang, S.-P. Zheng and J. Liu, “Study on the Situation of Cigarettes Consumption and its Main Affecting Economic Indexes in China—A Case Study on Zhangzhou in Fujian,” Journal of Fujian Agriculture and Forestry University (Philosophy and Social Sciences), Vol. 12, No. 4, 2009, pp. 46-49.
- Z. Xiao and W. Wu, “The Application of Combining Forecasting Based on PSO-PLS to GDP,” Journal of Management Science, Vol. 21, No. 3, 2008, pp. 115-122.
- S. Wold, C. Albano and M. Dun, “Pattern Regression Finding and Using Regularities in Multivariate Data,” Analysis Applied Science Publication, London, 1983.
- S. Wold, C. Albano and M. Dun, “Modelling Data Tables by Principal Component and PLS: Class Patterns and Quantitative Predictive Relations,” Analysis, Vol. 12, No. 10, 1984, pp. 477-485.
- A. Höskuldsson, “A PLS Regression Methods,” Journal of Chemometrics, Vol. 2, No. 3, 1988, pp. 211-228. doi:10.1002/cem.1180020306
- National Bureau of Statistics of China, “China Statistics Yearbook 2010,” China Statistics Press, Beijing, 2011.
- D.-H. Yi, “Data Analysis and EViews Application,” China Renmin University Press, Beijing, 2008.
NOTES
*This paper is founded by the youth science fund projects of the national natural science foundation, No. 70802058. And the national innovation research group projects of national natural science foundation, No. 70821001.
1CS is Cigarette sales, UREC is Urban residents Engel’s coefficient, RSEC is Rural residents Engel’s coefficient, HCL is Household consumption level, CP is Cigarette prices. The meaning of other capital letters please see in the Table 1.
2**In confidence (double measure) of 0.01, the correlation is significant.
3*In confidence (double measure) of 0.05, the correlation is significant.
4In view of the reasons of space, this paper just chose the nearly five years’ data to compare.