Journal of Crystallization Process and Technology
Vol.1 No.2(2011), Article ID:6552,8 pages DOI:10.4236/jcpt.2011.12004
Structural, Optical, Electrical and Thermal Characterizations of Pure and L-Alanine Doped Ammonium Dihydrogen Phosphate Crystals
![]()
Department of Physics, Bangladesh University of Engineering and Technology, Dhaka, Bangladesh.
E-mail: ferdousis@yahoo.com, *jpodder@phy.buet.ac.bd
Received June 17, 2011; revised July 15, 2011; accepted July 23, 2011.
Keywords: Amino Acid, Solution Growth, Decomposition, Electrical Conductivity, Optical Transmission
ABSTRACT
Pure ammonium diyidrogen phosphate and L-alanine doped ammonium diyidrogen phosphate crystals were grown from aqueous solutions by natural evaporation process. The grown crystals are characterized by Fourier Transform Infrared spectroscopy, Energy Dispersive X-ray, UV-visible spectroscopy and differential thermal analysis. Crystal structure has been studied by powder X-ray diffraction. Pure and doped crystals both possessed tetragonal structure. The optical transparency is found to increase with the increase of doping concentration in the grown crystals and band gap energies of all crystals have been calculated at their cut off frequencies. It is found that the optical band gap increases with doping concentrations. D.C. electrical conductivity of grown crystals along the growth axis was carried out at temperatures ranging from 35 - 140˚C by the conventional two-probe method. The conductivity of the crystals increases with temperature and also increases with the L-alanine concentration. The decomposition temperatures and weight loss have been estimated from the Thermo Gravimetric Analysis and Differential Thermal Analysis and hardness was found from the Vicker’s microhardness measurement.
1. Introduction
Ammonium dihydrogen phosphate (NH4H2PO4) is an inorganic, piezoelectric, antiferro-electric and nonlinear optical material. It is well known for its diverse uses as electro-optic modulator, harmonic generators and parametric generators [1]. In the last decade the numerous applications of the nonlinear optical (NLO) crystals have been discussed in the field of science and technology [2-7]. But recent interest is focused on the development of the properties of the new semi organic (NLO) materials. Semi organic materials posses the advantage of both organic and inorganic materials in terms of high thermal and mechanical stability as well as broad optical frequency range, higher SHG (second harmonic generation) and high damage threshold [8-10]. Amino acid family crystals are playing an important role in the field of non-linear optical organic molecular crystal. Among them L-alanine (LA), with chemical formula (CH3CHNH2COOH) is the smallest, naturally occurring chiral amino acid with a non-reactive hydrophobic methyl group (-CH3) as a side chain. LA has the zwitterionic form (+NH3-C2H4-COO-) both in crystal and in aqueous solution over a wide range of pH, which favors crystal hardness for device application [9]. It belongs to the orthorhombic crystal system and the unit cell parameters are; a = 6.320 Å, b = 12.343 Å, c = 5.784 Å, α = β = γ = 90˚. Recently, several new complexes incorporating the amino acid L-alanine have been crystallized and their structural, optical and thermal properties have also been investigated [11-14]. The growth of pure L-alanine crystals was reported [15] and found higher damage threshold than Potassium dihydrogen phosphate (KDP). Many reasonable studies have been carried out on pure ADP crystals [16-20]. The effect of additives as amino acid on growth, habit modification and different structures of ADP crystals have been studied [21,22]. It was also reported that the addition of some of the amino acids as dopant enhances the nonlinear optical and piezoelectric properties of inorganic materials [22,23]. So L-alanine doped inorganic material like ADP will be of special interest as a fundamental building block to develop many complex crystals with improved NLO properties.
In this paper the effect of L-alanine as impurity on the growth of ADP by slow evaporation method at room temperature was studied (concentration ranging was from 3000 - 10000 ppm) i.e., 0.3 - 1.0 mol% on the growth of ADP. The grown crystals were characterized by FT-IR, EDX, XRD, D.C. electrical and TGA/DTA analysis and Vicker’s microhardness and compared all these results with pure ADP crystal.
2. Experimental
2.1. Solubility Study
The solubility of pure ADP and L-alanine doped ADP in double distilled water was determined in the temperature range 30 - 50˚C insteps of 5˚C using a constant temperature bath of accuracy ±0.01˚C. 500 mL of the saturated solution of pure ADP salt was prepared gravimetrically at 30˚C. This solution was stirred well for six hours constantly using magnetic stirrer and then filtered using Whatman filter paper. This solution was taken in five different beakers of 100 mL and L-alanine was added to each of the four beakers as 0.3 mol%, 0.5 mol%, 0.7 mol% and 1 mol%. After making supersaturated solution of ADP, 5 mL of the solution was pipetted out and poured into a 10 mL beaker of known weight. The solvent was completely evaporated by warming the solution at 50˚C. The amount of the salt present in 5 mL of the solution was measured by subtracting the empty beaker’s weight. From this the amount of the salt present in 100 mL of the solution was found out. In the same way, the amount of the salt dissolved in 100 mL at 35, 40, 45 and 50˚C was determined. Figure 2 shows the solubility curves of pure ADP and LA doped ADP salt. It is observed that the solubility of pure and doped ADP in water increases as the temperature increases and decreases with increasing doping concentration. From this solubility data it can be stated that the ADP material has positive temperature coefficient.
2.2. Crystal Growth
The pure ADP and L-alanine (AR grade) doped ADP crystals were grown using a good quality seed crystal at room temperature by solvent evaporation method. For the preparation of seed crystals, saturated solution of ADP was prepared first and then kept in a petri dish covered with a perforated polyethylene and allowed to grow seed crystals within 4 - 5 days. The pH of the different concentration of L-alanine solutions was ranged from 3.57 to 4.12. The purity of the crystals was improved by successive recrystallization process. The growth period takes 25 - 30 days for bigger size. The grown crystals were found colorless and transparent. The molecular structure of ADP crystal is shown in Figures 1 and 7 shows the photographs of pure and doped ADP crystals.
2.3. Characterization
FT-IR spectrum was recorded by KBr pellet technique using a Shimadzu FT-IR-8900 spectrometer in the wave number range 400 - 4000 cm–1. EDX patterns were recorded using JEOL-6360 Scanning Electron Microscope. Powder X-ray diffraction pattern was recorded using a Philips X pert PRO X-ray diffractometer with CuKα (λ = 1.5418 Å) radiation. The optical properties of the grown crystal were studied using Shimadzu UV-1601 visible spectrometer in the wavelength region from 200 to 1100 nm. Crystals with high transparency and defect-free with the dimensions of 8 mm × 6 mm × 2 mm were cut into a rectangular size. The DC conductivity measurements were carried out using the conventional two-probe method at various temperatures ranging from 35 to140˚C. The field is applied perpendicular to caxis. V icker’s
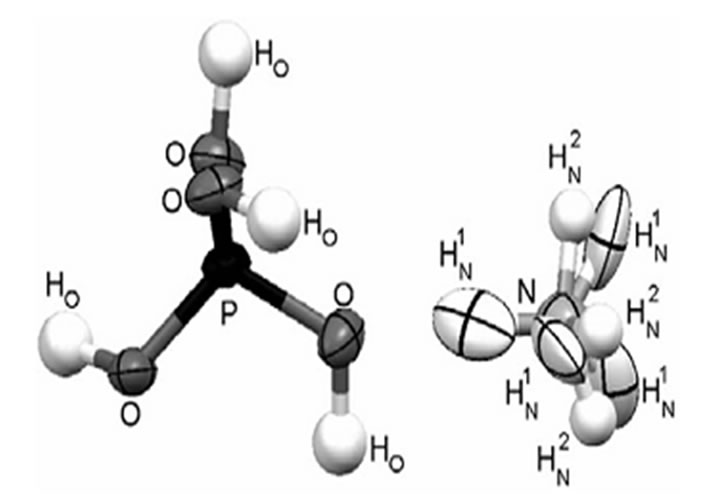
Figure 1. Picture of ADP molecule.
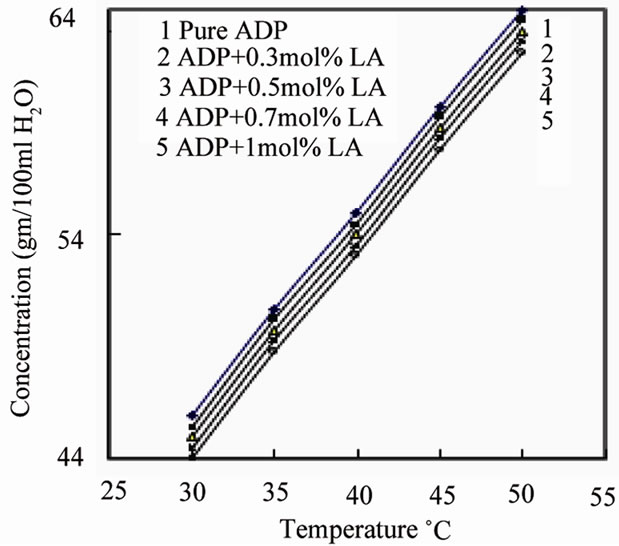
Figure 2. Solubility curve of pure and L-alanine doped ADP.
hardness number of pure and doped crystals was studied using the HMV-2T, Shimadzu, Japan. Thermal analysis was conducted on pure and doped crystals using simultaneous thermo gravimetric (TG), differential thermal analysis (DTA) and differential thermal gradient (DTG) using thermal analyzer (model no.TG/DTA-6300) from 40˚C to 800˚C at the heating rate of 15˚C/min in nitrogen atmosphere.
3. Results and Discussion
3.1. FT-IR Spectroscopy Study
L-arginine monohydrochloride (LAHCl) and L-alanine (LA) with ADP crystals were studied by FT-IR by Dhanaraj [21]. The authors confirmed the interaction between ADP and organic amino acids by shifting the peak positions of P-O-H and PO vibrations compared to pure ADP. In this paper the FT-IR spectra of pure ADP and L-alanine doped ADP crystals are shown in Figure 3. In the FT-IR spectrum of pure ADP the O-H stretching vibration of water happened at 3100 cm–1, P-O-H stretching at 1100 cm–1, N-H stretching of ammonia at 2850 cm–1 and the PO4 vibrations give their peaks at 545.8 and 405 cm–1. The FT-IR spectra of L-alanine (0.3, 0.5, 0.7 and 1 mol%) doped ADP crystals showed that the peak positions have been moved from lower to higher wavenumber due to the presence of L-alanine into ADP. For example, the PO4 vibration of the parent is shifted from 405 to 415 cm–1. Similarly the P-O-H vibrations at 1100 and 925 cm–1 of the parent are shifted to 1125 and 975 cm–1, which confirmed the presence of L-alanine on the lattice of ADP crystals. Table 1 shows the vibrational frequencies corresponding to band assignments.
3.2 Energy Dispersive X-ray analysis
In order to confirm the presence of the elements of Lalanine into pure ADP crystals, the sample of grown crystals were subjected to Energy Dispersive X-ray analysis using JEOL-6360 Scanning Electron Microscope. Figure 4 shows the EDX result of pure ADP and L-alanine doped ADP crystals. Elements are identified and presented as atomic%.
3.3 Powder X-ray Diffraction
The powder XRD study was conducted to verify the single phase nature of the samples. Figure 5 shows the powder XRD patterns of pure and L-alanine doped ADP crystals. Well defined Bragg peaks are obtained at specific 2θ angles indicating that crystals are ordered. The ‘d’ spacing and hkl values for prominent peaks in the spectrum were identified and compared with ICDD (International Centre for Diffraction Data) data. Using
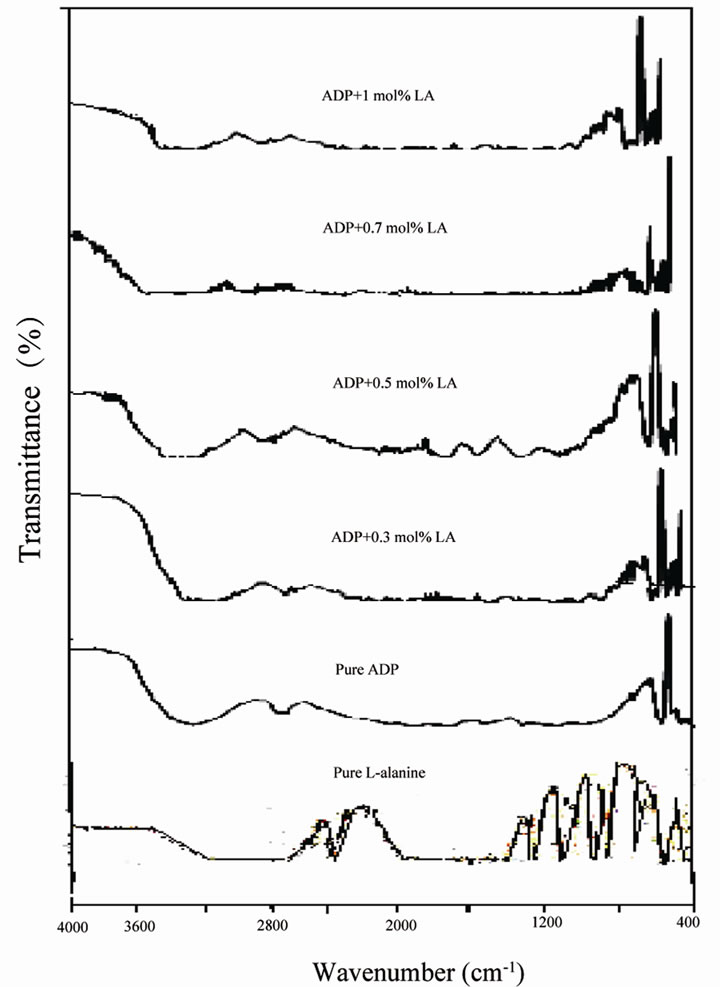
Figure 3. FTIR spectra of as grown crystals.
tetragonal crystallographic equation, lattice parameter values are calculated and listed in Table 2. This suggests that the crystals retain almost the single phase structure and exhibit very slight variation in the unit cell parameters on doping of L-alanine. The variation in the intensities of various diffraction patterns on changing the concentration of doping was observed.
3.4 UV-Vis Study
The UV-Vis optical transmission spectra of pure and L-alanine doped ADP crystals are shown in Figure 6. It is clear from the figure that the percentage of optical transmission increases with the increase of concentration of L-alanine in ADP crystals. All of them have sufficient transmission in the entire visible and near IR region. The percentage of optical transmission and the UV transparency cut-off limits data are tabulated in Table 2. The UV transparency cut-off limits decreases with the doping concentration. Similar results have been obtained in the case of L-alanine doped KDP [23] and also lithium doped L-alanine crystals [24].
Absorption in the near ultraviolet region arises from electronic transitions associated within the sample. Using the formula Eg = hc/λ, the band gap energies were found to be from 3.65 eV to 4.77 eV. where h is the Planck’s
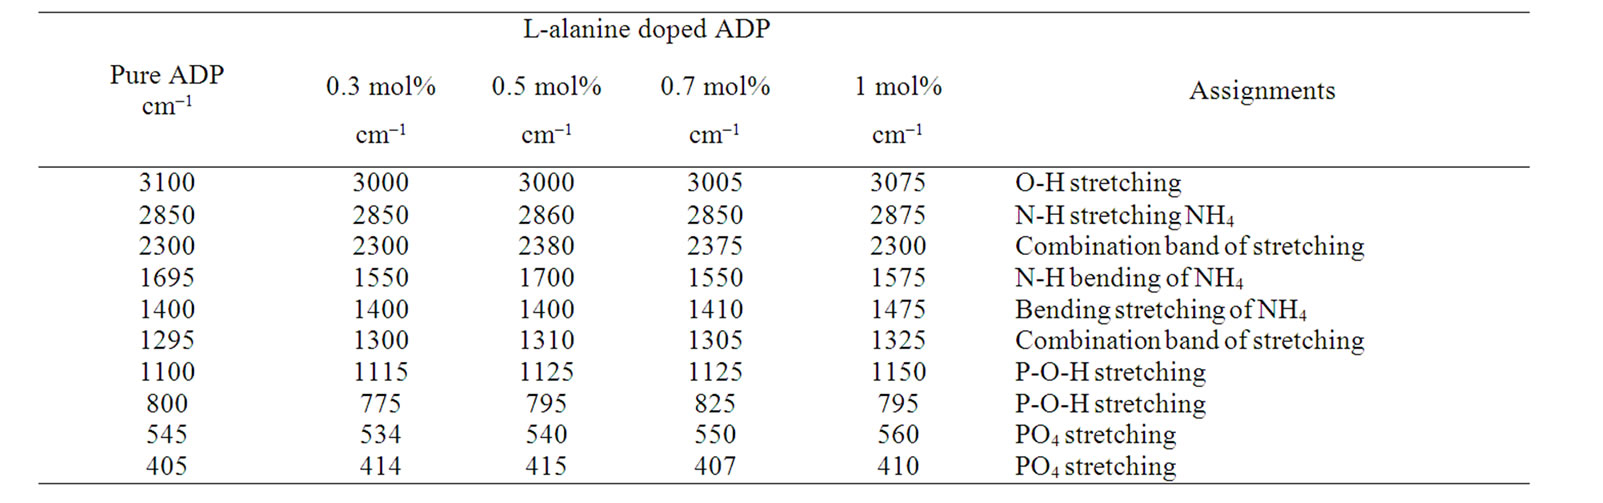
Table 1. Vibrational frequencies for pure ADP and LA doped ADP crystals.
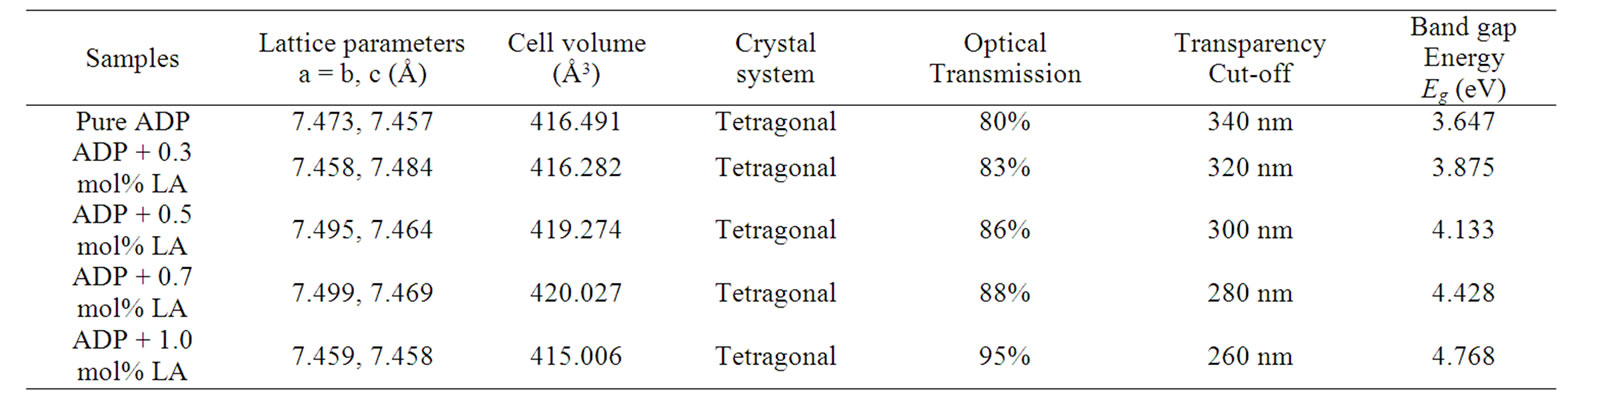
Table 2. Results of lattice parameters, optical transparency, and band gap energy.
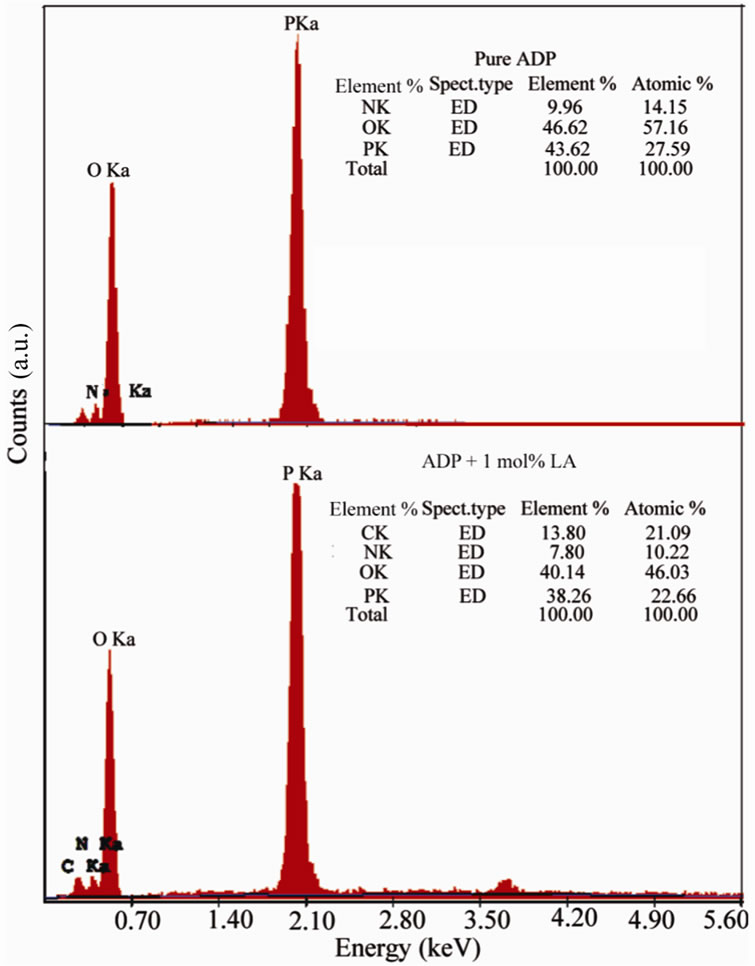
Figure 4. EDX spectra of pure and LA doped ADP crystals.
constant and c is the velocity of light. Hence, it could be concluded that the L-alanine doping play a key role in improving the optical quality of ADP crystals. This is the most desirable property of materials possessing NLO activity.
3.5 D.C. Conductivity
A graph of DC conductivity vs. temperature of pure and L-alanine doped ADP crystals is plotted in Figure 8. It is found that conductivity increases exponentially with temperature and also with L-alanine concentrations. Similar result has been obtained in case of urea doped ADP [16]. Conductivity is found in the order of 10–6 mho/m. At low temperature region, conductivity is expected due to the presence of weakly attached impurities and vacancies in the crystal lattice. At high temperature region, the attached water molecule is lost and fracture is developed and conductivity is caused mainly for intrinsic defects. The doping ions of LA may occupy some interstitial positions and create defects. Due to these defects, the conductivity of doped ADP crystals may increase.
3.6 Micro Hardness
Hardness test is useful to find the mechanical hardness of the crystal and to estimate the threshold mechanical stress. Vicker’s hardness measurement of pure ADP and
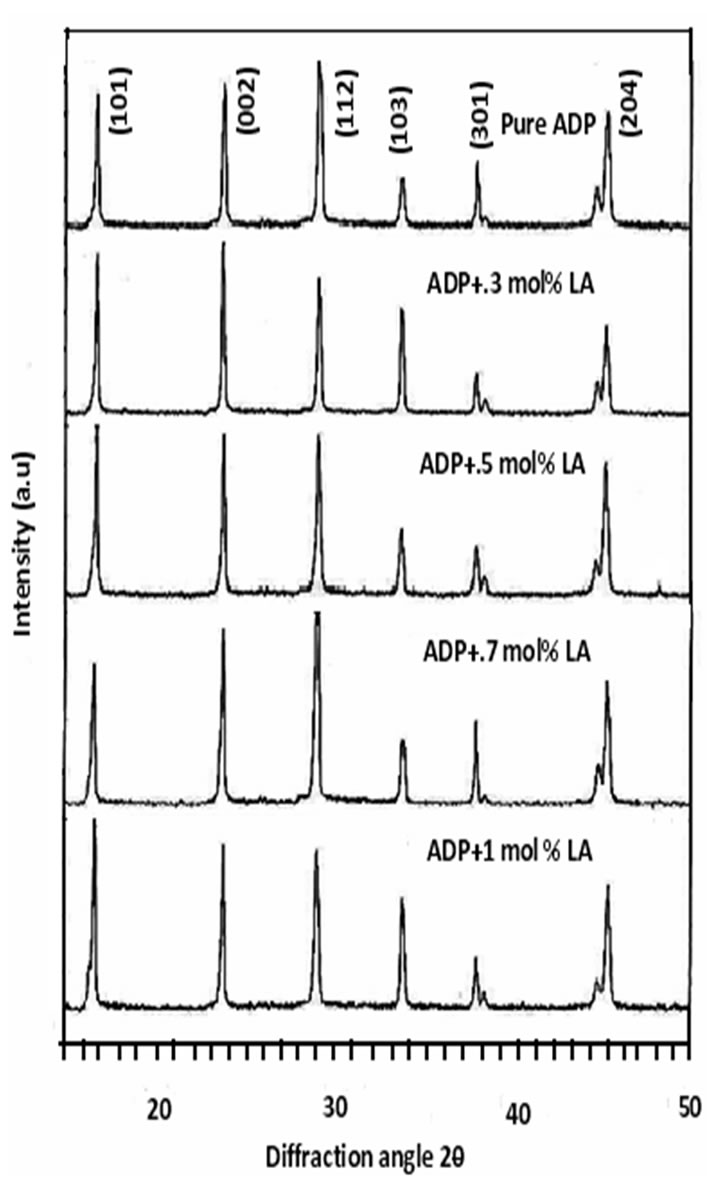
Figure 5. Power XRD pattern of pure and LA doped ADP crystals.
L-alanine doped ADP crystals was taken by varying applied loads 25 g, 50 g and 100 g for indentation time of 7 s. The hardness value of pure ADP and LA doped ADP crystals were found to decrease with the applied loads
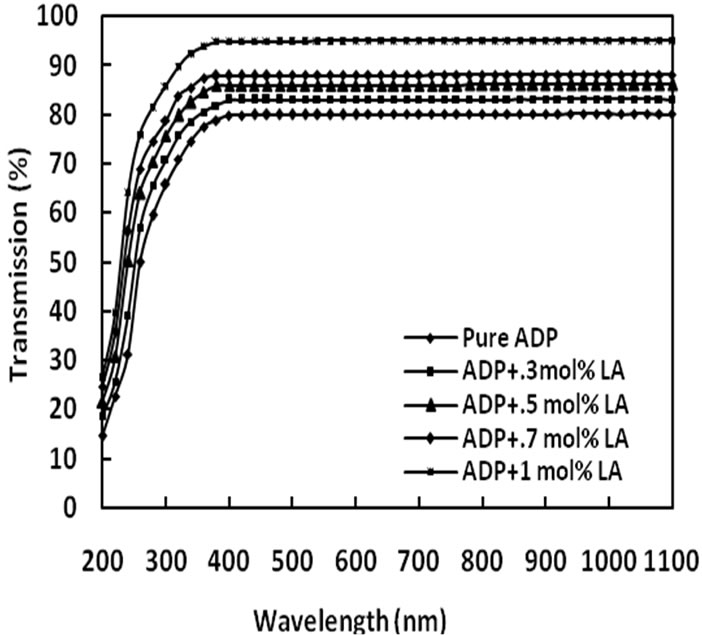
Figure 6. Transmittance spectra of pure and LA doped ADP crystals.
shown in Figure 9. The hardness values were calculated using the formula: Hv = [1.8544 × P]/D2 kg·mm–2.
Where Hv is the Vicker’s hardness number, P is the indenter load in kg and D is the diagonal length of the impure pression in mm. In the present study, the hardness of the ADP crystal is higher than L-alanine doped ADP crystals. This is because of the incorporation of the L-alanine (+NH3, COO-) ions into superficial crystal lattice and forming defect centers which generate weak lattice stresses on the surface. This result is comparable with the reported values [21,24].
3.7 Thermal Study
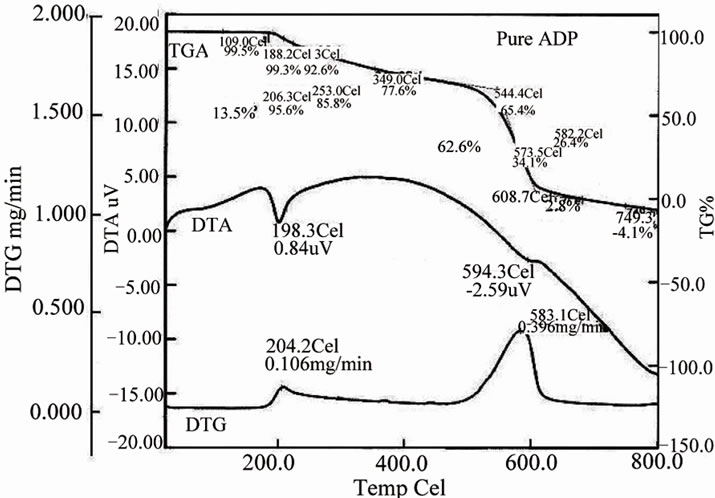
The effect of L-alanine doping on thermal stability of ADP crystals is studied from the simultaneous TG, DTA and DTG curves shown in the Figure 11. In order to study the influence of dopant on the thermal stability of ADP, the temperature corresponding to the first stage of
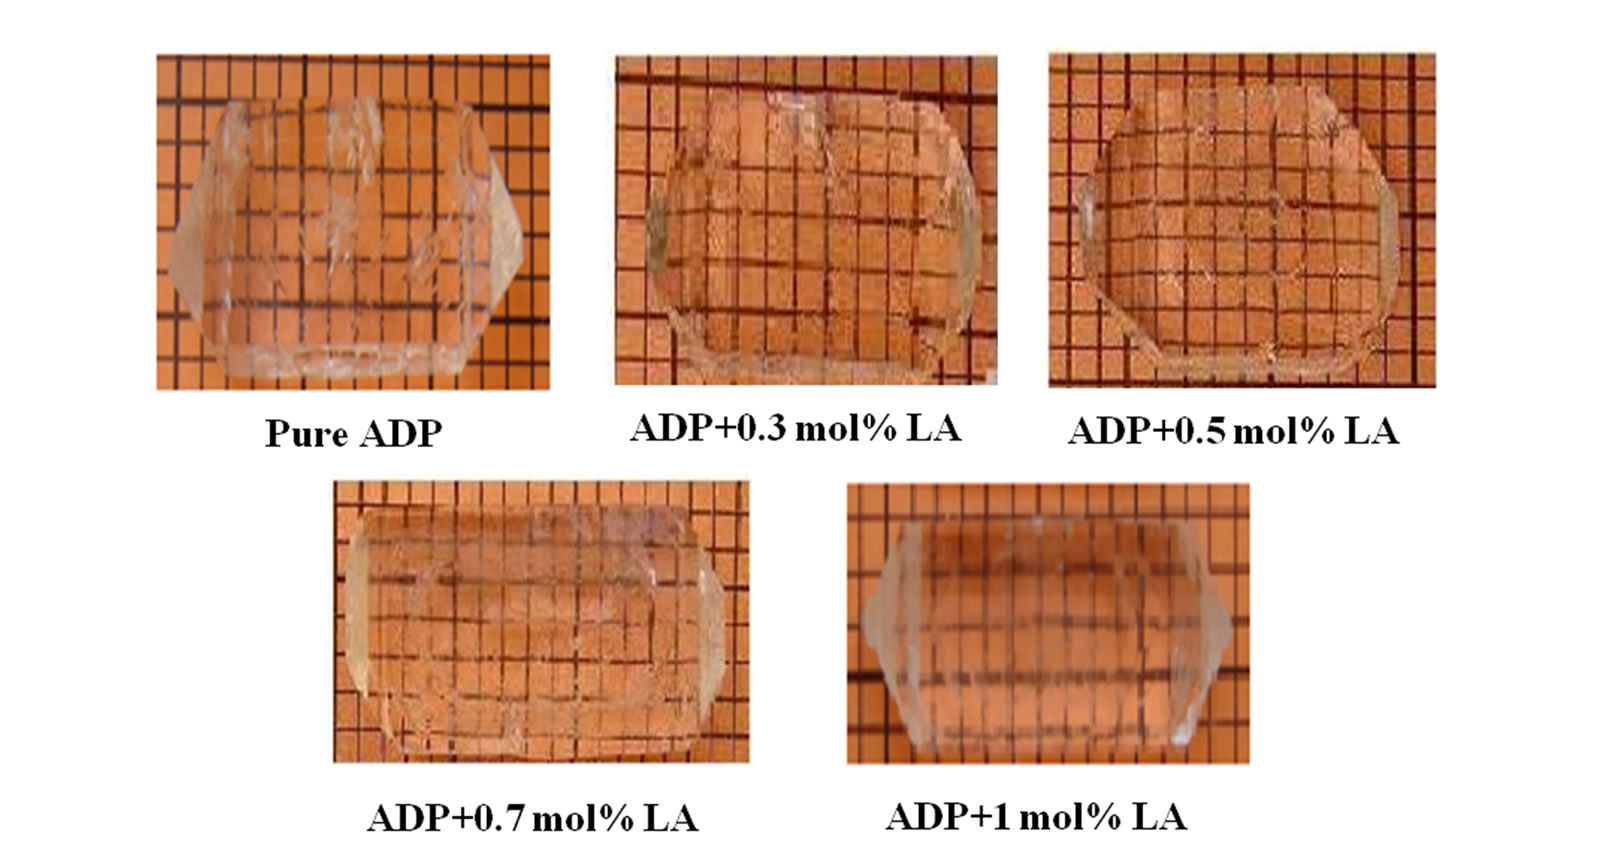
Figure 7. Photographs of as grown crystals.
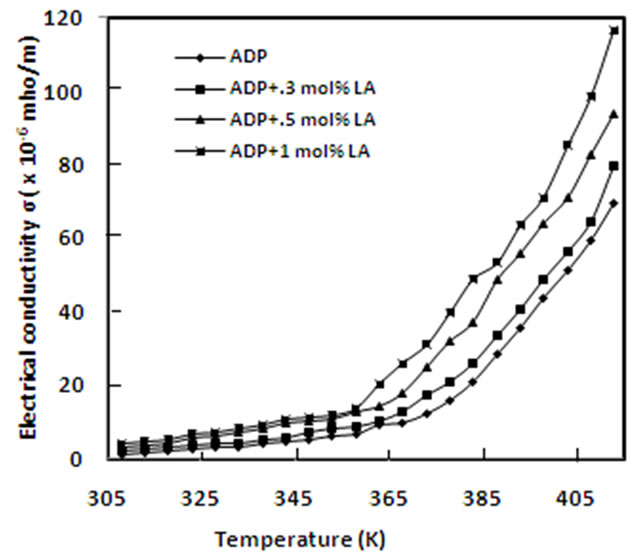
Figure 8. Electrical conductivity versus temperature for pure and doped ADP crystals
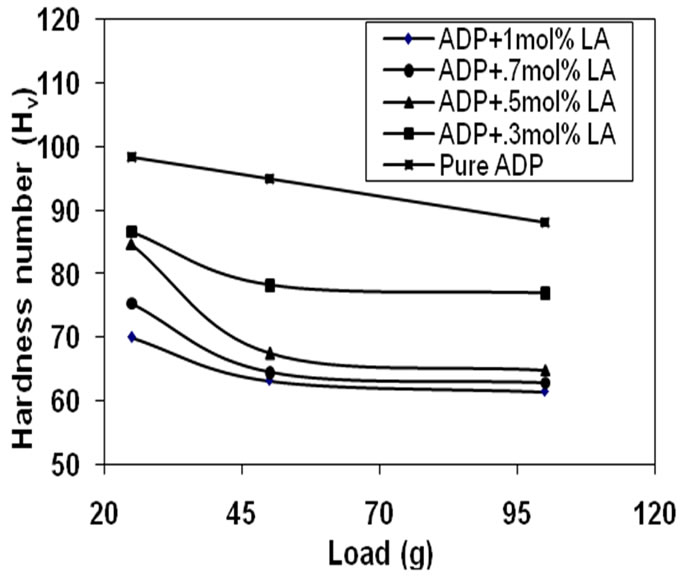
Figure 9. Hardness curves of pure and LA doped ADP crystals.
decomposition is taken into account for comparison. In Figure 10(a), the DTA curve shows an endothermic peak at 198.3˚C for the pure ADP and in Figure 10(b), the endothermic peaks of the DTA curves for L-alanine doped ADP crystals is 208.9˚C. These endothermic peaks correspond to the decomposition temperature of the crystals. The TGA curve exhibited negligible weight loss in the region 40˚C to 200˚C as shown in the Figure10. The decomposition of pure ADP crystal begins at 188.2˚C and terminates at 608.7˚C. The weight loss observed from TGA graph for pure ADP in the temperature range 188.2˚C to 544.4˚C is 13.5%. But for ADP + 1 mol% LA crystal the decomposition starts at 202.1˚C and ends at 694.8˚C. The weight loss observed from TGA graph for ADP + 1 mol% LA crystal is 9.9%. From this analysis we can see from the TGA/DTA analysis that on
 (a)
(a) (b)
(b)
Figure 10. DTA spectra for (a) pure ADP and (b) LA doped ADP crystals.
increasing the concentration of L-alanine the hydration process starts later and the crystal becomes anhydrous higher than the pure ADP crystal because L-alanine be comes unstable at lower temperature. These results reveal that the L-alanine has entered as an impurity into ADP crystals. The similar results have obtained for L-alanine doped KDP [23] and L-arginine doped in KDP [26].
4. Conclusions
The effect of amino acid (L-alanine) impurity on the growth of ADP from supersaturated solutions has been investigated experimentally by measuring optical transmission, functional groups, DC electrical conductivity, hardness and decomposition temperatures. The presence of amino acid impurity in ADP solution was found to increase the optical transmission, electrical conductivity with temperature and decomposition temperature. This phenomenon may be attributed due to zwitterionic nature of L-alanine molecule (+NH3-C2H4-COO–). The enhancement of optical transmission of L-alanine doped ADP crystals highlights their prospects of application as NLO materials. Further studies viz., frequency response of the dielectric constant, tanδ, and temperature dependant resistivity and activation energy are in progress and to be reported soon.
5. Acknowledgement
The authors are thankful to Dr. Dilip Kumar Saha, CSOfor XRD measurements and Mr. Harinarayan Das, SO and Md. Al-Mamun, SO, Atomic Energy Centre, Dhaka, Bangladesh, for EDX measurements.
6. References
[1] S. R. Marder, B. G. Tiemann, J. W. Perry, et al., “Materials for non-linear optics chemical perspectives,” American Chemical Society, Washington, 1991, p. 280.
[2] H. M. Muncheryan, “Lasers and Opto-electronics Devices,” Hemisphere Pub. Co, New York, 1991.
[3] Y. R. Shen, “The Principles of the Nonlinear Optics,” Wiley, New York, 1984.
[4] P. Meystrey and M. Sargent, “Elements of Quantum Optics,” Springe-Verlag, Berlin, 1991.
[5] J.-I. Sakai, “Phase Conjugate Optics,” McGraw Hill, Inc., New York, London, 1992.
[6] P. Ramasamy and P. S. Raghavan, “Crystal Growth Processes and Methods,” KRU Publications, Kumbakonam, 1999.
[7] P. S. Raghavan and P. Ramasamy, “Recent Trends in Cyrstal Growth,” Pinsa 68, New Delhi, 2002, p. 235.
[8] L. F. Warren, “New development in semiorganic nonlinear optical crystals,” In: R. E. Allred, R. J. Martinez and W. D. Wischmann, Eds., Electronic Materials, The proceedings of the Fourth International SAMPE Electronics Conference, Vol. 4, June 12-14, 1990, Covina, pp. 388-396.
[9] J. F. Nicoud and R. J. Twieg, “Design and synthesis of organic molecular compounds for efficienty second harmonic generation,” In: D. S. Chemla and J. Zyss, Eds., Nonlinear Optical Properties of Organic Molecules and Crystals, Academic, Orlando, 1986, Vol. 1.
[10] A. Jayarama and S. M. Dharmaprakash, “Structural Distortion in Thiourea-mixed ADP Crystals,” Applied Surface Science, Vol. 253, No. 2, 15 November 2006, pp. 944-949. doi:10.1016/j.apsusc.2006.01.051
[11] J. D. Bernal, “The Crystal Structure of the Natural Amino Acids and Related Compounds,” Zeitschrift für Kristallographie, Vol. 78, 1931, pp. 363-369. Uwww.Shodhganga.inflibnet.ac.in/bitstream/10603/41/14/references
[12] H. J. Simpson Jr. and R. E. Marsh, “The Crystal Structure of L-Alanine,” Acta Crystallographica, Vol. 20, Part 4, April 1966, pp. 550-555. doi:10.1107/S0365110X66001221
[13] R. Destro, R. E. Marsh and R. Bianchi, “A Low Temperature (23K) Study of L-Alanine,” The Journal of Physical Chemistry, Vol. 92, 1988, pp. 966-973. doi:10.1021/j100315a022
[14] L. Misoguti, A. T. Varela, F. D. Nunes, V. S. Bagnato, F. E. A. Melo, J. Mendes Filho and S. C. Zilio, “Optical Properties of L-Alanine Organic Crystals,” Optical Materials, Vol. 6, 1996, pp. 147-152. doi:10.1016/0925-3467(96)00032-8
[15] N. Vijayan, S. Rajasekaran, G. Bhagavannarayana, R. R. Babu, R. Gopalakrishnan, M. Palanichamy and P. Ramasamy, “Growth and Characterization of Nonlinear Optical Amino Acid Single Crystal: L-Alanine,” Crystal Growth & Design, vol. 6, no. 11, 2006, pp. 2441-2445.doi:10.1021/cg049594y
[16] A. Anne Assencia and C. Mahadevan, “D.C. Electrical Conductivity Measurements on ADP Single Crystals Added with Simple Organic Compounds,” Bulletin of Material Science, vol. 28, no. 5, 2005, pp. 415-418. doi:10.1021/cg049594y
[17] D. l. Xu and D. f. Xue, “Chemical Bond Analysis of the Crystal Growth of KDP and ADP,” Journal of Crystal Growth, Vol. 286, no. 1, 1 January 2006, pp. 108- 113. doi:10.1016/j.jcrysgro.2005.09.040
[18] N. P. Rajesh, V. Kannan, P. S. Raghavan, P. Ramasamy and C. W. Lan, “Nucleation studies and crystal growth of (NH4)H2PO4 doped with thiourea in supersaturated aqueous solutions,” Materials Chemistry and Physics, Vol. 76, no. 2, 15 August 2002, pp. 181-186. doi:10.1016/j.jcrysgro.2005.09.040
[19] J. W. Mullin and A. Amatavivadhana, “Growth Kinetics of Ammonium and Potassium Dihydrogen Phosphate Crystals,” Journal of Applied Chemistry, Vol. 17, no. 5, May 1967, pp. 151-156. doi:10.1002/jctb.5010170508
[20] P. Rajesh and P. Ramasamy, “A Study on Optical, Thermal, Mechanical, Dielectric, Piezoelectric and NLO Properties of Unidirectional Ammonium Chloride Added Ammonium Dihydrogen Phosphate Crystal,” Materials Letters, Vol. 63, no. 26, 2009, pp. 2260-2262. doi:10.1016/j.matlet.2009.07.018
[21] P. V. Dhanaraj, G. Bhagavannarayana and N. P. Rajesh, “Effect of Amino Acid Additives on Crystal Growth Parameters and Properties of Ammonium Dihydrogen Orthophosphate Crystals,” Materials Chemistry and Physics, Vol. 112, no. 2, 2008, pp. 490-495. doi:10.1016/j.matchemphys.2008.06.003
[22] M. Meena and C. K. Mahadevan, “Growth and Electrical Characterization of L-Arginine Added KDP and ADP Single Crystals,” Crystal Research and Technology, 43, no. 2, 2008, pp. 166-172. doi:10.1002/crat.200711064
[23] K. D. Parikh, D. J. Dave, B. B. Parekh and M. J. Joshi, “Growth and Characterization of L-Alanine Doped KDP Crystals,” Crystal Research and Technology, Vol. 45, no. 603, 2010, pp. 1-8.
[24] B. Suresh Kumar, M. R. Sudarsana Kumar and K. Bajendra Babu, “Growth and Characterization of pure and Lithium Doped L-Alanine Single Crystals for NLO Devices,” Crystal Research and Technology, vol. 43, no. 7, 2008, pp. 745-750.doi:10.1002/crat.200711064
[25] M. Priya, C. M. Padma, T. H. Freead, C. Mahadevan and C. Balasingh, “Electrical Conductivity Measurements on Gel Grown KDP Crystals Added with Urea and Thiourea,” Bulletin of Material Science, vol. 24, no. 5, 2001, pp. 511-514. doi:10.1007/BF02706723
[26] K. D. Parikh, D. J. Dave, B. B. Parekh and M. J. Joshi, “Thermal, FT-IR and SHG Efficiency Studies of L-Arginine Doped KDP Crystals,” Bulletin of Material Science, vol. 30, no. 2, 2007, pp. 105-112. doi:10.1007/s12034-007-0019-4