Journal of Analytical Sciences, Methods and Instrumentation
Vol.2 No.1(2012), Article ID:17812,8 pages DOI:10.4236/jasmi.2012.21002
A Simple Approach for Evaluating Total MicroRNA Extraction from Mouse Brain Tissues
![]()
1Department of Chemistry and Biochemistry, University of North Carolina at Greensboro, Greensboro, USA; 2Molecular Neurogenetics Unit, Department of Neurology, Massachusetts General Hospital, Harvard Medical School, Boston, USA; 3Department of Nanoscience, Joint School of Nanoscience and Nanoengineering, Greensboro, USA.
Email: *prof.chiu@gmail.com
Received January 5th, 2012; revised January 31st, 2012; accepted February 4th, 2012
Keywords: MicroRNA; Extraction; Tissue
ABSTRACT
For the analysis of microRNA, a common approach is to first extract microRNA from cellular samples prior to any specific microRNA detection. Thus, it is important to determine the quality and yield of extracted microRNA. In this study, solid-phase extraction was used to isolate small RNA (<200 nt), which included microRNA, from mouse brain tissues. By using standard UV absorbance measurements, the amount of small RNA in the extracted RNA samples was determined. To determine the presence of microRNA, each RNA sample was analyzed by PAGE with SYBR® Green II staining. Testing for contamination of any small DNA fragments, RNase and cellular peptides or proteins were systematically carried out. By scanning the gel image obtained from PAGE analysis, the average percentage of total microRNA (19 - 25 nt) in the extracted RNA samples was determined to be equal to 2.3% ± 0.5%. The yield of total microRNA was calculated to be ~0.5 ng of microRNA per milligram of frozen mouse brain tissue. In comparison to other methods that require the use of expensive specialized instrumentation, the approach of combining the standard UV absorbance and PAGE analysis represents a simple and viable method for evaluating the quality and yield of microRNA extraction from tissue samples.
1. Introduction
The regulation of cellular gene expression by the mechanism of RNA interference (RNAi) was first reported over a decade ago [1]. The RNAi process involves small double-stranded RNA fragments (~21 nt) called small interfering RNAs (siRNA) that may present in cells due to a transgene, transposon, or viral infection [1,2]. The sense strand of siRNA is removed and the antisense strand binds to a complementary portion of mRNA, destroying the mRNA and stopping protein translation [3,4]. siRNA can be chemically synthesized and injected into living cells, thus RNAi has become an extremely important tool for biomedical research; and may yield new treatments for genetic and related diseases. RNAi also provides a method of defense against viruses and foreign nucleic acids within cells [3].
In a similar pathway, RNAi can be initiated by small RNA that are encoded by genes within an organism [3,4]. Long hairpin RNA, thousands of nucleotides long, called primary microRNA (pri-miRNA) are transcribed from a gene. The pri-miRNA are cleaved into smaller ~70 nt hairpin RNA by an enzyme known as Drosha [4]. The resulting precursor microRNA (pre-miRNA) are exported into the cytoplasm and cleaved by another enzyme known as Dicer, into double-stranded microRNA (miRNA), which are 19 - 25 nt in length [3,4]. One strand of the miRNA duplex is degraded, and the other strand-known as mature miRNA—is then incorporated into a ribonucleoprotein complex, binds to a complementary portion of mRNA, and inhibits protein synthesis [3,4].
Abnormal levels of miRNA play a role in the initiation of cancer and its metastasis, thus miRNA are potential targets for cancer diagnosis and treatments. As a result, miRNA profiling may serve as a new tool for the diagnosis of cancers [5]. The peculiar expression of miRNA has been also tied to other diseases such as heart disease, diabetes, and neurological disorders in humans [6].
Typically, mature miRNA, as opposed to their precursors, are the targets of analysis. For any in vitro methodologies, the extraction of total RNA from cellular samples is always the first step as shown in Figure 1. This is often accomplished by lysing the cells followed
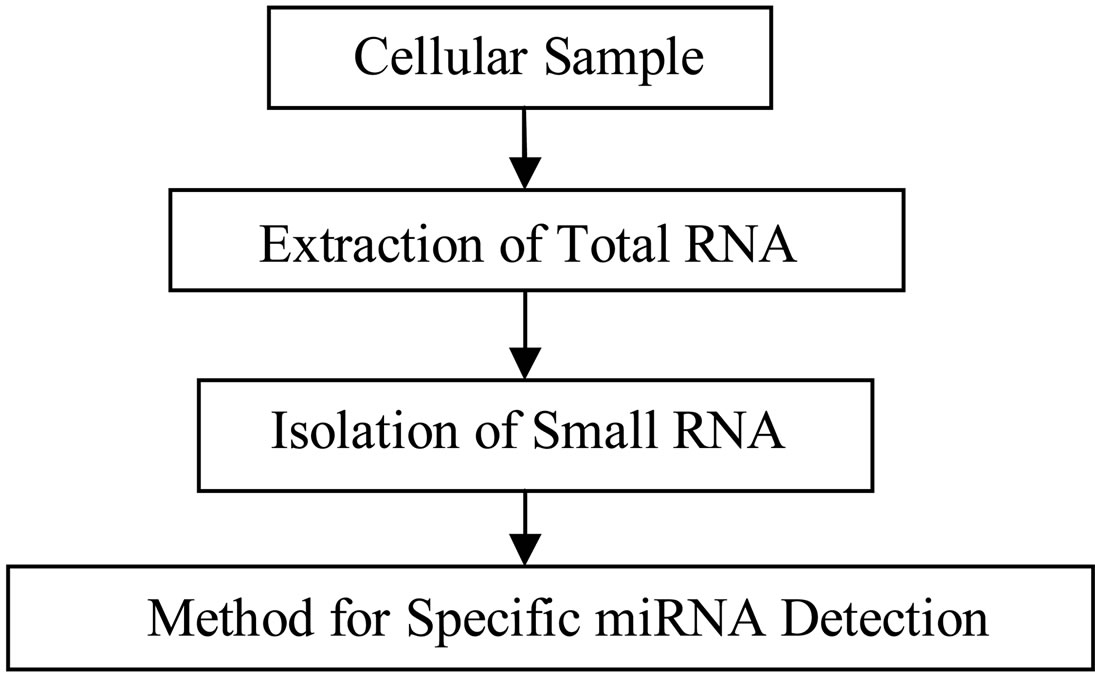
Figure 1. Flowchart of the most common experimental approach for measuring miRNA. Note the isolation of small RNA including miRNA is an optional procedure.
by an acidic phenol/chloroform extraction of total RNA [7,8]. Depending on the analytical method, the total RNA may need to be fractionated by separating the smaller RNA from larger RNA [7]. The size fractionation of total RNA can be accomplished using denaturing polyacrylamide gel electrophoresis (PAGE), or the flashPAGE miniaturized electrophoresis cell (Ambion, Austin, TX) [9,10]. To avoid the wait time from running the gel and the subsequent elution of miRNA from the gel, alternative methods that focus on removing larger RNA from the sample are available. These include the use of polyethylene glycol to selectively precipitate larger RNA, or passing the sample through a filter with a suitable molecular weight cutoff [9,11,12]. Both methods, however, cannot effectively remove the metal cations from the RNA samples which may otherwise interfere with subsequent procedures. Perhaps, for these reasons, all the commercial kits, such as mirVana™ miRNA Isolation Kit (Ambion, Austin, TX) or mirPremier™ microRNA Isolation Kit (Sigma-Aldrich, St. Louis, MO), have employed the approach of solid-phase extraction (SPE), which selectively enhance the binding of small RNA on a SPE column, thus allowing any unwanted materials including larger RNA to be removed prior to the elution of small RNAs from the column [7,13]. Thus, among the current methodologies, the use of SPE represents the most effective approach for miRNA extraction.
After the extraction of miRNA, the analysis of miRNA can be divided into two categories. The aim of the first category is to discover new miRNA. Since the RNA sequence is unknown, the traditional method that combines reverse transcription, cloning, sequencing, and database searching is commonly adopted [7,10,14]. The second category of miRNA analysis involves the measurements of known miRNA. In the past few years, the total number of reported miRNA has continued to grow. Currently, there are more than 700 mouse miRNA and over 1500 human miRNA that have already been identified [15]. For the detection of a specific known miRNA, all the existing methods exclusively rely on the use of nucleic acid probes or their modified formats. For example, the use of molecular beacons, locked nucleic acids (LNA), and peptide nucleic acids (PNA) have already been reported [16-18]. To achieve a specific recognition of a known miRNA, the nucleic acid probe whose sequence is complementary to the miRNA forms a hybrid with the targeted miRNA through Watson-Crick base pairing. By carrying out the process of hybridization between the probe and targeted miRNA on a solid surface (e.g. nitrocellulose membrane, or polystyrene microtiter plate), any unwanted non-specific binding of the probe can be easily removed by washing the surface with suitable buffer. To further improve the specificity as well as achieve a high sensitivity for the detection of the probe-miRNA hybrids, various reporting labels have been explored. These include both radioactive and nonradioactive labels (e.g. gold nanoparticles, ribozymes, or luciferase) [16,19]. For parallel measurements of multiple miRNA, microarrays and beadarray technology have been used in various methods [13,20].
Despite the advances in measuring new or reported miRNA, the success of any detection method is largely dependent on the outcome of initial miRNA extraction. The goal of this study is to establish a simple approach that combines standard UV absorbance and PAGE analysis for evaluating the quality and yield of total miRNA extraction from mouse brain tissues. Total miRNA is herein defined as the collection of all miRNA that coexist at the same time in a particular tissue or biological samples.
2. Materials and Methods
Prior to the experiments, each experimental setup including the bench area was decontaminated by using RNaseZap® (Ambion, Austin, TX) followed by rinsing with deionized autoclaved water. All procedures were carried out in RNase-free microcentrifuge tubes (Eppendorff Tubes, Brinkmann Instrument Inc., Westbury, NY) or else stated; and RNase-free pipet tips (Aerosol Resistant Tips, MβP® Molecular BioProducts, Fisher Scientific, Pittsburgh, PA) were used.
2.1. Testing Water for RNase Contamination
To ensure the supply of deionized autoclaved water used in this study was free of any RNase contamination, two samples (45 μL each) of water were tested for nuclease activity using an RNase detection kit (RNaseAlert QC System, Ambion, Austin, TX). Prior to the RNase assay, the water samples were deionized by using a water purification system (NANOpure Diamond, Barnstead, Thermo Scientific, Waltham, MA); and were autoclaved at 250˚F and 16 PSIG for 16 min. 45 µL of nuclease-free water was used as a negative control. Another 40 µL sample of nuclease-free water mixed with 5 µL RNase A was used as a positive control. 5 µL of 10× RNaseAlert buffer that contained a fluorescent-labeled RNase substrate was added to each sample and control. The nuclease-free water, RNase A, fluorescent substrate, and RNaseAlert buffer were all provided with the kit. All samples and controls were incubated for 45 min at 37˚C in a thermal cycler (DNA Engine Peltier Thermal Cycler, Bio-Rad, Hercules, CA). The fluorometric measurements were carried out with a microplate reader (Polarstar Optima, BMG Labtech, Durham, NC), using 490 nm and 520 nm as excitation and emission wavelengths, respectively. Each measurement was repeated twice.
2.2. Extraction and Isolation of miRNA
All miRNA samples were extracted from brain tissues, which were surgically removed from athymic nude mice and frozen immediately in dry ice as described by Wűrdinger et al. [21]. All animal experiments were carried out at the Massachusetts General Hospital (MGH), Boston, MA, and approved by the MGH Animal Review Committee. Prior to the miRNA extraction, the brain tissues were stored at –80˚C. The extraction and isolation of miRNA were performed by using a commercially available miRNA isolation kit (mirVana™ miRNA Isolation Kit, Ambion, Austin, TX). For determining the yield of miRNA per unit mass of frozen brain tissue, each tissue sample was initially weighed. Then, each tissue was homogenized using only a homogenizer (Ultra-Turrax SDT tissue homogenizer, Tekmar Company, Cincinnati, OH). The homogenization was carried out at 24,000 rpm for 2 min in bursts lasting ~30 sec. After that, each tissue sample was lysed according to the kit’s instruction. In brief, the total RNA was extracted from the lysate by an acidic mixture of phenol and chloroform. Then, two consecutive solid-phase extractions, in the presence of an increasing percentage of ethanol, were used to isolate small RNAs that were less than 200 nt from the total RNA. Any unwanted material was removed by washing the solid-phase extraction columns. 100 µL of pre-heated nuclease-free water (95˚C) was used to elute the small RNA from the column. The extracted RNA was stored at –80˚C.
2.3. UV Absorbance Measurements
The purity of extracted RNA (<200 nt) obtained with the isolation kit were determined by UV absorbance. In duplicate, 50 μL of each diluted sample was transferred to a UV transparent 96-microplate (Corning, Lowell, MA). All UV absorbance measurements were carried out by using the microplate reader at 260 nm and 280 nm. The purity of extracted RNA was determined by the ratio of absorbance at 260 nm:280 nm.
2.4. Denaturing Polyacrylamide Gel Electro-Phoresis (PAGE)
The extracted RNA samples were further characterized by denaturing PAGE. 15% polyacrylamide gels with 7 M urea were made according to the protocol in the isolation kit manual. After setting up the PAGE apparatus (MiniProtean 3 Electrophoresis Cell, Bio-Rad, Hercules, CA), the sample wells were cleaned by flushing with gel running buffer (1× TBE buffer, Ambion, Austin, TX). A pre-run was conducted at 120 V for 10 min. The RNA samples were diluted in deionized autoclaved water. After mixing the RNA sample with a gel loading buffer, which consisted of 4 M urea and 0.04% orange G (Sigma-Aldrich, St. Louis, MO). The samples were then denatured by using a thermal cycler at 95˚C for 5 min, and stored at 4 until loading onto the gel. Single-stranded RNA markers from New England Biolabs (Ipswich, MA) was used. The gel was run at 120 V for 3 hours and stained with SYBR® Green II (Sigma-Aldrich, St. Louis, MO) (1:10,000 in 1× TBE) or ethidium bromide (1 μg/mL in 1× TBE) for 30 min with shaking in the darkness. The gel stained with ethidium bromide was rinsed briefly with 1× TBE followed by destaining for 10 min in additional 1× TBE. After staining, the gel was imaged with a digital imaging system (Chemidoc XRS System Molecular Imager, Bio-Rad, Hercules, CA). The imaging system was equipped with transillumination at 302 nm, emission filter at 548 to 630 nm, and a CCD camera. Based on the approach of densitometry, the tools in the gel imager, Quantity One® software (Bio-Rad, Hercules, CA), were used to estimate the percentage of total miRNA in each extracted RNA sample. Specifically, a profile of fluorescent intensity versus migration time of each lane in the gel image was created. The data was exported to Microsoft Excel. From the exported data, specific segments in the profiles were selected that corresponded to miRNA (19 - 25 nt) and RNA markers. After that, the adjusted volume (i.e. average fluorescent intensity × area of selected region) of total miRNA and RNA markers were calculated separately. With the known amount of RNA markers that has been used, a relative quantitation of total miRNA was performed by using the ratio of adjusted volume between miRNA and RNA markers.
3. Results and Discussion
3.1. Qualitative Analysis of Extracted RNA Samples
As part of cellular regulation, different types of RNA molecules including miRNA are normally degraded by the enzymatic activity of ribonucleases (RNase). Among different organisms, there are more than fifteen different RNase reported in the literature, which are either sequence-independent or single-base specific RNase [22]. For most of the experimental work that involve RNA, RNase contamination represents one of the biggest technical difficulties. In this study, the presence of any RNase contamination during and/or after the miRNA extraction would adversely affect both quality and yield of miRNA. Unlike other enzymatic activities, most RNase cannot be deactivated by autoclaving. An alternative method to deactivate RNase is by adding RNase inhibitor(s) to RNA samples and/or their reaction mixtures [23]. The experimental procedure used in this study to extract miRNA from mouse brain tissues has involved multiple steps, in which several proprietary reagents from the isolation kit and other supplies were used. Thus, the approach of using RNase inhibitor was not a practical solution for this study. Furthermore, one of the most commonly used RNase inhibitors known as diethylpyrocarbonate (DEPC) can potentially react with RNA, and may interfere with the subsequent RNA analysis [23]. To avoid the use of expensive RNase-free and DEPCfree water offered by different vendors, the in-house deionized autoclaved water used in this study for diluting the RNA samples and the preparation of polyacrylamide gels was tested for RNase contamination. For testing the RNase activity in the deionized autoclaved water, an RNase assay that employed a dual-labeled fluorescent RNA oligonucleotide as a cleavable RNase substrate and a technique called fluorescence resonance energy transfer (FRET) was used [24]. In the presence of RNase contamination, the RNase substrate that has been added in the water being tested is digested. This results in the emission of fluorescence at 520 nm. In the case that the water being tested is RNase-free, no fluorescence would be observed. The fluorescent signals obtained from the deionized autoclaved water were nearly the same as the negative control (Supplementary Table 1). According to the manufacturer’s manual for the RNase assay, the differences in the fluorescent signals between the water samples and negative control were within the acceptable range. This indicated that the water samples being tested were RNase-free. The RNase assay was thereafter repeated for each lot of deionized autoclaved water used in this study.
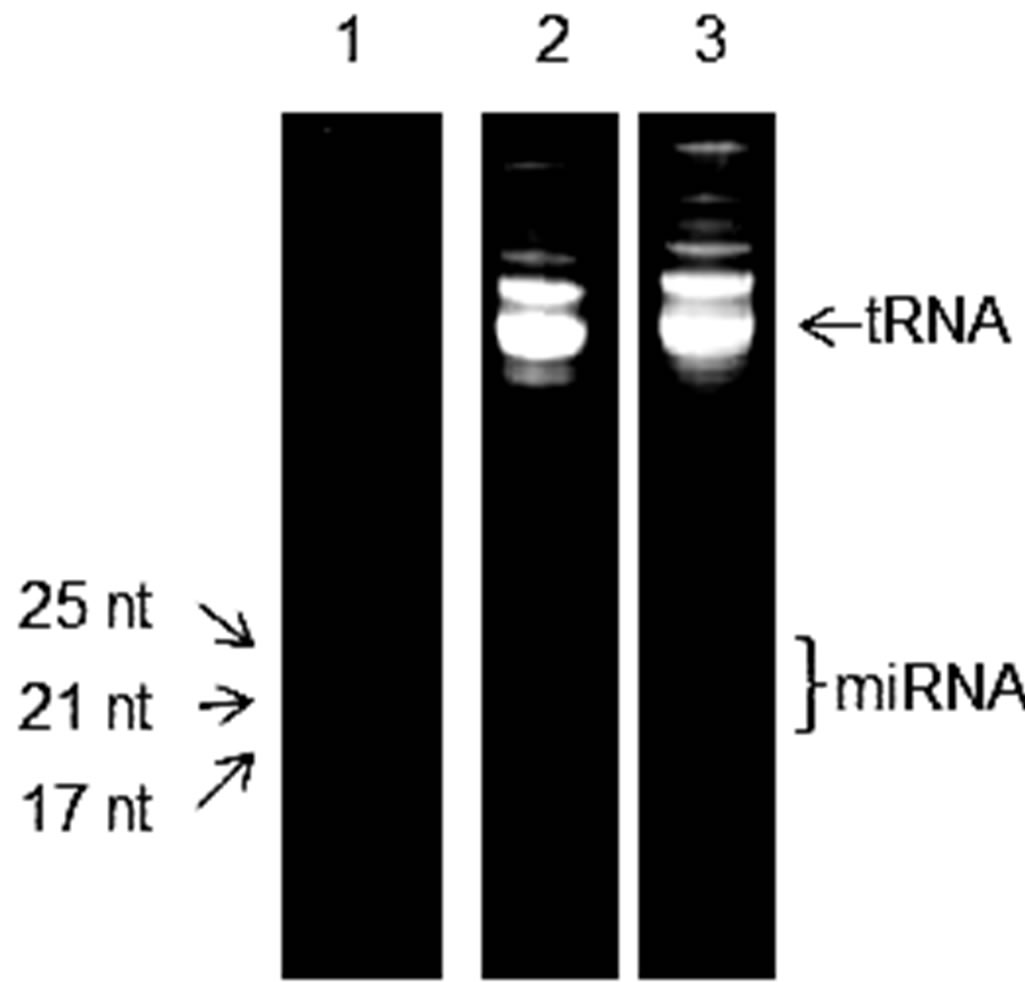
To isolate RNA from the lysate, acidic phenol/chloroform extraction was adopted by the selected isolation kit. During the acidic phenol/chloroform extraction, only RNA should be extracted into the upper aqueous phase. Whereas, cellular DNA and protein are partitioned in the lower organic phase and interphase, respectively. Although the method of phenol/chloroform extraction has become one of the most commonly used methods for nucleic acid research, its success depends on having the correct ratio of phenol to chloroform as well as the pH of the mixture. To ensure RNA is exclusively extracted from the lysate, a common practice is to measure the absorbance of extracted RNA samples at 260 nm and 280 nm. In general, a nucleic acid sample is considered to be pure or free from any peptide or protein contamination if the ratio of its absorbance at 260 nm:280 nm is around 2.0 [23]. Using this approach, the extracted RNA samples in this study were determined to be as pure as a reference standard, which was a synthetic HPLC-purified DNA oligonucleotide (data not shown). The UV absorbance measurements, however, could not confirm the presence of any miRNA in the extracted RNA samples. To determine whether there was any miRNA in the samples, denaturing polyacrylamide gel electrophoresis (PAGE) was adopted to separate various nucleic acid fragments by size. To avoid loading the PAGE gel with either too much or too little RNA sample, the amount of RNA in the samples ought to be determined prior to the PAGE analysis. For determining the concentration of RNA, a common practice is to use the absorbance of the sample at 260 nm and the average extinction coefficient of single-stranded RNA (0.027 (μg/mL)–1cm–1) can be used to calculate the RNA concentration. For one of the extracted RNA samples, the RNA concentration was determined to be equal to 280 μg/mL. Using the standard conditions for denaturing PAGE and ethidium bromide staining, the extracted RNA samples were analyzed. The results obtained from one of the extracted samples are shown in lane 2 of Figure 2(a), which is comparable to the pattern in a similar figure shown in the manual of the selected isolation kit [25]. Since the kit has been designed to isolate RNA that are smaller than 200 nt, tRNA and other larger RNA molecules were also observed in the gel image. According to the manual for the isolation kit, the results of miRNA extraction can be evaluated by UV absorbance measurements and PAGE analysis unless functional testing for a specific miRNA is required. Therefore, based on the above results, we conclude that the extraction of small RNA from mouse brain tissues was successful.
However, for any subsequent research work especially in the case of discovering new miRNA and the development of new methodology for studying or analyzing known miRNA, the absence of any band in lane 2 of Figure 2(a) that corresponds to miRNA (19 - 25 nt) may become a problem when negative results are obtained from an experiment that uses the extracted RNA sample. To further improve the evaluation of miRNA extraction, the more sensitive SYBR® Green II dye instead of ethidium bromide was used to stain the PAGE gel after the run was completed. Through optimizing the amount of RNA sample per lane, the incubation time for staining, and the exposure time for imaging the gel, the detection of miRNA became feasible. In lane 3 of Figure 2(a), a smear in the lower half of the gel image appeared when 6 μg of extracted RNA sample was stained with SYBR® Green II. With the same amount of RNA sample, the smear
 (a)
(a)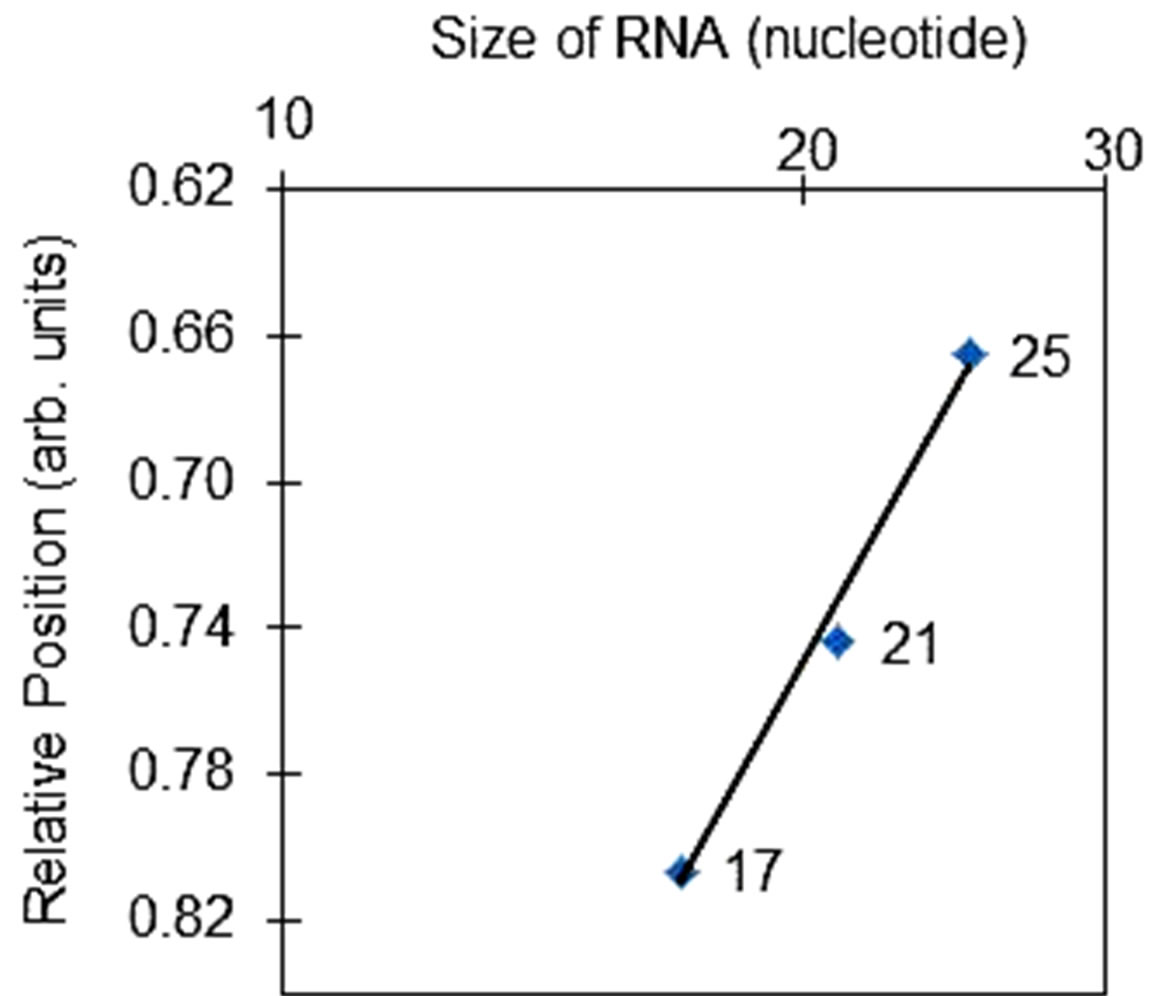 (b)
(b)
Figure 2. (a) Gel images of 15% denaturing polyacrylamide gel electrophoresis. In lane 1, single-stranded RNA markers were separated. The other two images corresponded to 6 μg of the same extracted RNA sample that was separately stained with either 1 µg/mL ethidium bromide (lane 2) or SYBR® Green II (lane 3). (b) Relationship between the size of RNA fragment and its electrophoretic mobility in denaturing polyacrylamide gel electrophoresis. The number of nucleotides in each of the single-stranded RNA markers is plotted against their relative positions in lane 1. The linearity of the plot has an R-squared value of 0.996.
that corresponded to miRNA and other smaller RNA fragments were, however, not detectable with ethidium bromide staining (lane 2). To investigate whether the smear was the result of partial degradation of larger RNA molecules in the sample, an aliquot of the extracted RNA sample was incubated at 37˚C for an hour before the PAGE analysis was carried out. In the case of any RNase contamination, most—if not all—of the larger RNA in the sample were expected to be degraded during the incubation step. The PAGE analysis of the incubated RNA sample showed the same pattern with identical intensity in the gel image (Supplementary Figure 1). Therefore, the smear in lane 3 of Figure 2(a) does not correspond to any RNA degradation that might result from RNase contamination during the cellular RNA were being extracted. Besides the binding to RNA, SYBR Green II dye could also bind to single-stranded DNA. To determine whether the smear in Figure 2(a) corresponds to any DNA fragments, an aliquot of the extracted RNA sample was digested with DNase I prior to the PAGE analysis. The results showed no change to the appearance of the smear (Supplementary Figure 2). Thus, the smear in Figure 2(b) does not correspond to the staining of any DNA fragment. In an attempt to further improve the quality of the gel image in Figure 2(a), as much as 10 μg of extracted RNA sample was used in the PAGE analysis. However, no distinct band within the lower half of the gel image was observed. This may represent the amount of different miRNA in the brain tissue are similar to each other. As an option in this study as well as the proposed method for evaluating miRNA extraction from tissue samples, the presence of specific microRNA were confirmed by using the real-time PCR method. (Supplementary Figure 3). Based on the outcomes of all the above studies, we conclude part of the smear in Figure 2(a) does correspond to miRNA.
3.2. Quantitative Analysis of Extracted RNA Samples
Although many assays for detecting specific miRNA have been developed and are readily available (e.g. TaqMan® assay), they are, however, not suitable for determining the amount of total miRNA or the yield of total miRNA extraction. In this study, total miRNA is defined as the collection of all miRNA that co-exist at the same time in a particular tissue or biological sample. In this study, the amount of total miRNA in the extracted RNA sample was estimated by scanning the gel image that was stained with SYBR® Green II dye (lane 3 of Figure 2(a)). To the best of our knowledge, mature miRNA is the only small non-coding RNA that has been reported in the literature falls within the range of 19 - 25 nt. In order to define the region in lane 3 that corresponded to total miRNA (19 - 25 nt), the relative position of three different single-stranded RNA markers in lane 1 of Figure 2(a) was plotted against the size of the RNA markers. As shown in Figure 2(b), within the narrow range of sizes (17 - 25 nt), there is a linear relationship between the size of RNA fragment and its relative position in the gel image. Thus, the relative positions that corresponded to total miRNA (19 - 25 nt) could be easily defined. Since the amount of each single-stranded RNA markers was known, plus the fluorescence intensity of SYBR® Green II-RNA complexes is directly proportional to the amount of RNA (Supplementary Figure 4), the relative amount of total miRNA could be calculated from the adjusted volume of the region in the gel image that corresponded to total miRNA. In this study, the adjusted volume of a selected region in the gel image is defined as the average fluorescence intensity within the region multiplied by the
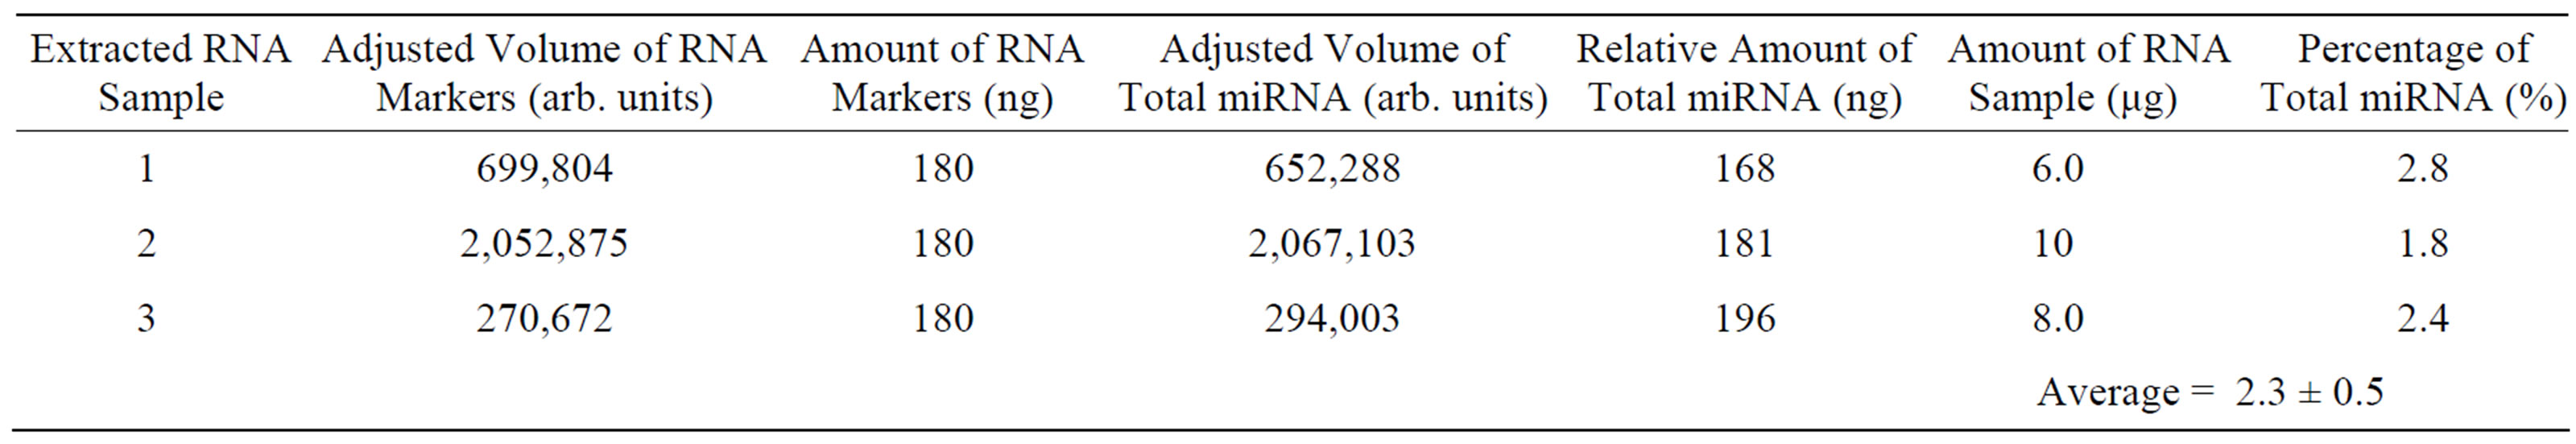
Table 1. Percentage of total microRNA in extracted RNA samples. Three different extracted RNA samples were ran in separate gels, and the same amount of single-stranded RNA markers was loaded in the gels.
area of the region. The relative amount of total miRNA was calculated by using the ratio of adjusted volumes between total miRNA and RNA markers. The results obtained from three different experiments or images are shown in Table 1. The average percentage of total miRNA in the extracted RNA samples was determined to be 2.3% ± 0.5% (n = 3).
To determine the yield of miRNA extraction from mouse brain tissues using the selected isolation method, the weight of brain tissues being used for miRNA extraction was measured. Using the relative amount of total miRNA in Table 1, the approximate yield of miRNA extraction from frozen mouse brain tissues was calculated and was equal to ~0.5 ng of total miRNA per mg of frozen mouse brain tissue. The results of the above quantitative analysis are useful information for determining how much cellular materials are required for future miRNA studies. To the best of our knowledge, this is the first time the average percentage of total miRNA and the yield of total miRNA extraction from mouse brain tissues have been determined.
4. Conclusion
With the initial testing of in-house deionized autoclaved water for RNase contamination, the water used in this study was determined to be as pure as the commercially available RNase-free water. For long-term study, this result represents a potential saving by eliminating the cost of purchasing expensive RNase-free water. As shown in Figure 1, it is important to ensure that the highest quality and yield are achieved from the extraction of cellular miRNA prior to any in vitro detection of specific miRNA. Among various methods for isolating and purifying miRNA, the method of solid phase extraction was selected in this study. To evaluate the outcome of miRNA extraction from mouse brain tissues, the standard UV absorption and PAGE analysis were used. The UV measurements have shown the extracted RNA samples were free from any protein contamination. From the PAGE analysis with ethidium bromide staining, a similar pattern of bands in the gel image as shown in the isolation kit manual was obtained. In order to view the band missing from the gel image that corresponds to miRNA, the more sensitive SYBR® Green II dye instead of ethidium bromide was used to stain the PAGE gel. Through optimizing the amount of RNA sample per lane, the incubation time for staining, and the exposure time for imaging the gel, a region that corresponds to miRNA became detectable in the gel image. With the improvement on PAGE analysis, it has allowed the average percentage of total miRNA in the extracted RNA samples (2.3% ± 0.5%) to be determined. In this study, total miRNA is defined as the collection of all miRNA that co-exist at the same time in a particular tissue or biological sample. Furthermore, the yield of miRNA extraction from the frozen mouse brain tissues (~0.5 ng of total miRNA per mg of brain tissue) was also determined. To the best of our knowledge, this is the first time the average percentage of total miRNA and the yield of total miRNA extraction from mouse brain tissues are reported. Also, in comparison to other existing methods for microRNA analysis (e.g. Agilent small RNA kit), the approach of combining standard UV absorbance and PAGE analysis in this study does not require the use of any expensive specialized instrumentation.
5. Acknowledgements
The authors are grateful to David Remington and Jason Reddick for their instrumental supports, and Phillip Behrns for his helpful discussions. The authors also wish to acknowledge the financial supports from UNCG.
REFERENCES
- A. Fire, S. Xu, M. K. Montgomery, S. A. Kostas, S. E. Driver and C. C. Mello, “Potent and Specific Genetic Interference by Double-Stranded RNA in Caenorhabditis Elegan,” Nature, Vol. 391, 1998, pp. 806-811. doi:10.1038/35888
- R. K. Slotkin and R. Martienssen, “Transposable Elements and the Epigenetic Regulation of the Genome,” Nature Reviews Genetics, Vol. 8, No. 4, 2007, pp. 272- 285. doi:10.1038/nrg2072
- C. D. Novina and P. A. Sharp, “The RNAi Revolution,” Nature, Vol. 430, 2004, pp. 161-164. doi:10.1038/430161a
- W. Filipowicz, S. N. Bhattacharyya and N. Sonenberg, “Mechanisms of Post-Transcriptional Regulation by microRNAs: Are the Answers in Sight?” Nature Reviews Genetics, Vol. 9, No. 2, 2008, pp. 102-114. doi:10.1038/nrg2290
- M. S. Nicoloso and G. A. Calin, “MicroRNA Involvement in Brain Tumors: From Bench to Bedside,” Brain Pathology, Vol. 18, No. 1, 2008, pp. 122-129. doi:10.1111/j.1750-3639.2007.00119.x
- W. Kong, J. Zhao, L. He and J. Q. Cheng, “Strategies for Profiling MicroRNA Expression,” Journal of Cellular Physiology, Vol. 218, No. 1, 2008, pp. 22-25. doi:10.1002/jcp.21577
- A. Aravin and T. Tuschl, “Identification and Characterization of Small RNAs Involved in RNA Silencing,” FEBS Letters, Vol. 579, No. 26, 2005, pp. 5830-5840. doi:10.1016/j.febslet.2005.08.009
- P. Chomczynski and N. Sacchi, “Single-Step Method of RNA Isolation by Acid Guanidinium Thiocyanate-Phenol-Chloroform Extraction,” Analytical Biochemistry, Vol. 162, No. 1, 1987, pp. 156-159. doi:10.1016/0003-2697(87)90021-2
- A. M. Krichevsky, K. S. King, C. P. Donahue, K. Khrapko and K. S. Kosik, “A MicroRNA Array Reveals Extensive Regulation of MicroRNAs during Brain Development,” RNA, Vol. 9, 2003, pp. 1274-1281. doi:10.1261/rna.5980303
- G. Sun, H. Li and J. J. Rossi, “Cloning and Detecting Signature MicroRNAs from Mammalian Cells,” Methods in Enzymology, Vol. 427, 2007, pp. 123-138. doi:10.1016/S0076-6879(07)27007-7
- T. Watanabe, Y. Totoki, H. Sasaki. N. Minami and H. Imai, “Analysis of Small RNA Profiles during Development,” Methods in Enzymology, Vol. 427, 2007, pp. 155-169. doi:10.1016/S0076-6879(07)27009-0
- A. M. Krichevsky, “MicroRNA Profiling: From Dark Matter to White Matter, or Identifying New Players in Neurobiology,” Scientific World Journal, Vol. 7, 2007, pp. 155-166. doi:10.1100/tsw.2007.201
- W. Li and K. Ruan, “MicroRNA Detection by Microarray,” Analytical and Bioanalytical Chemistry, Vol. 394, No. 4, 2009, pp. 1117-1124. doi:10.1007/s00216-008-2570-2
- M. Hafner, P. Landgraf, J. Ludwig, et al., “Identification of MicroRNAs and Other Small Regulatory RNAs Using cDNA Library Sequencing,” Methods, Vol. 44, No. 1, 2008, pp. 3-12. doi:10.1016/j.ymeth.2007.09.009
- S. Griffiths-Jones, K. Saini, et al., “miRBase: Tools for MicroRNA Genomics,” Nucleic Acids Research, Vol. 32, 2008, pp. D154-D158.
- E. A. Hunt, A. M. Goulding and S. K. Deo, “Direct Detection and Quantification of MicroRNAs,” Analytical Biochemistry, Vol. 387, No. 1, 2009, pp. 1-12. doi:10.1016/j.ab.2009.01.011
- E. Varallyay, J. Burhyan and Z. Havelda, “Detection of microRNAs by Northern Blot Analyses Using LNA Probes,” Methods, Vol. 43, No. 2, 2007, pp. 140-145. doi:10.1016/j.ymeth.2007.04.004
- K. A. Cissell, S. Shrestha and S. K. Deo, “microRNA Detection: Challenges for the Analytical Chemist,” Analytical Chemistry, Vol. 79, No. 13, 2007, pp. 4754-4761. doi:10.1021/ac0719305
- C. Chen, D. A. Ridzon, A. J. Broomer, et al., “Real-Time Quantification of microRNAs by Stem-Loop RT-PCR,” Nucleic Acids Research, Vol. 33, 2005, pp. e179:1- e179:9.
- J. Chen, J. Lozach, et al., “Highly Sensitive and Specific microRNA Expression Profiling Using BeadArray Technology,” Nucleic Acids Research, Vol. 36, 2008, pp. e87:1-e87:9.
- T. Wűrdinger, B. A. Tannous, et al., “MiR-296 Regulates Growth Factor Receptor Overexpression in Angiogenic Endothelial Cells,” Cancer Cell, Vol. 14, No. 5, 2008, pp. 382-393. doi:10.1016/j.ccr.2008.10.005
- N. C. Mishra, “Nucleases: Molecular Biology and Applications,” John Wiley & Sons, Hoboken, 2002.
- J. Sambrook and D. W. Russell, “Molecular Cloning: A Laboratory Manual,” 3rd Edition, Cold Spring Harbor Laboratory Press, Cold Spring Harbor, 2001.
- V. V. Didenko, “DNA Probes Using Fluorescence Resonance Energy Transfer (FRET): Designs and Applications,” Biotechniques, Vol. 31, 2001, pp. 1106-1121.
- Instructional Manual for mirVanaTM miRNA Isolation Kit, Ambion, 2010. http://www.ambion.com/techlib/prot/fm_1560.pdf
SupplementaryTable 1. Results from testing RNase contamination in deionized autoclaved water samples.
 (a)
(a) 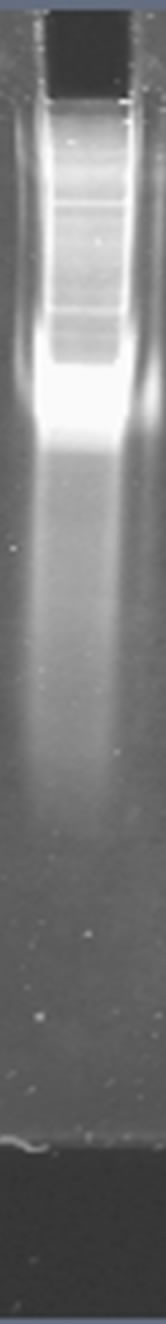 (b)
(b)
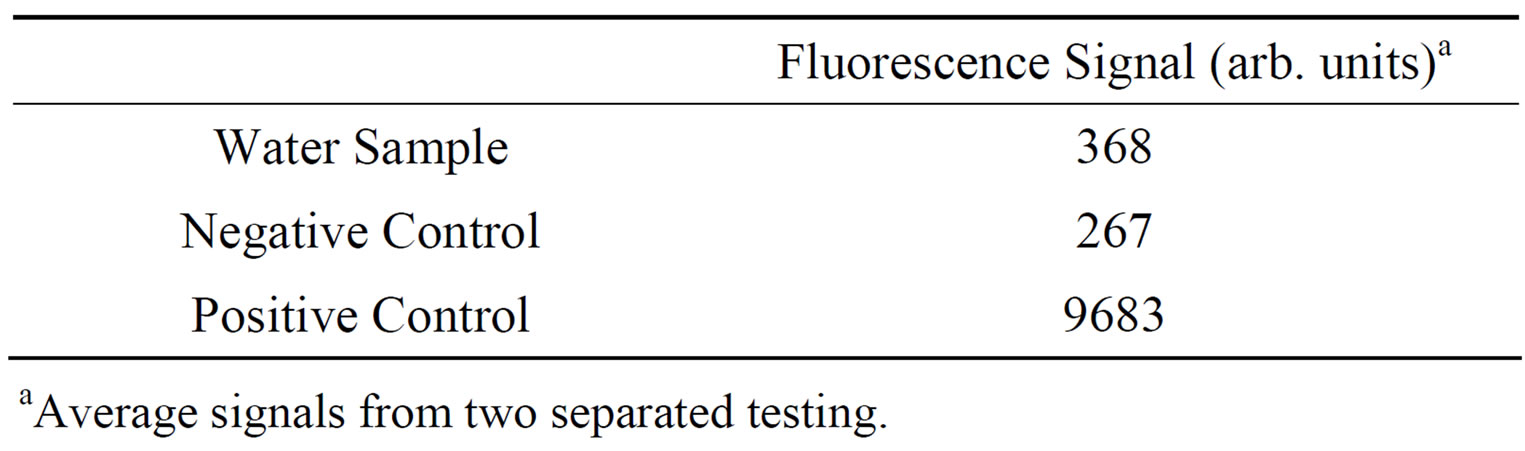
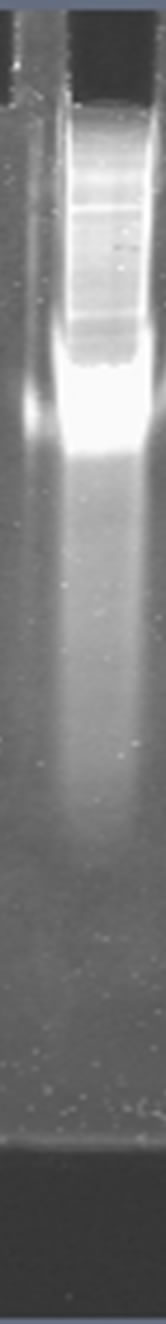
Supplementary Figure 1. Study on RNA Degradation. (a) and (b) Gel images of denature polyacrylamide gel electrophoresis (PAGE) of same amount of extracted RNA samples with and without an hour incubation of the sample at 37˚C, respectively, prior to the PAGE analysis.
Supplementary Figure 2. Study on DNA contamination. (A) and (B) Gel images of denature polyacrylamide gel electrophoresis (PAGE) of same amount of extracted RNA samples with and without DNase I digestion, respectively, prior to the PAGE analysis. In the DNase I digestion, 10 μg of extracted RNA sample was incubated with1 unit ofDNase I (RNase-free) and 0.3 μL of 10 × DNase I buffer (New England Biolabs) for 10 minutes at 37.
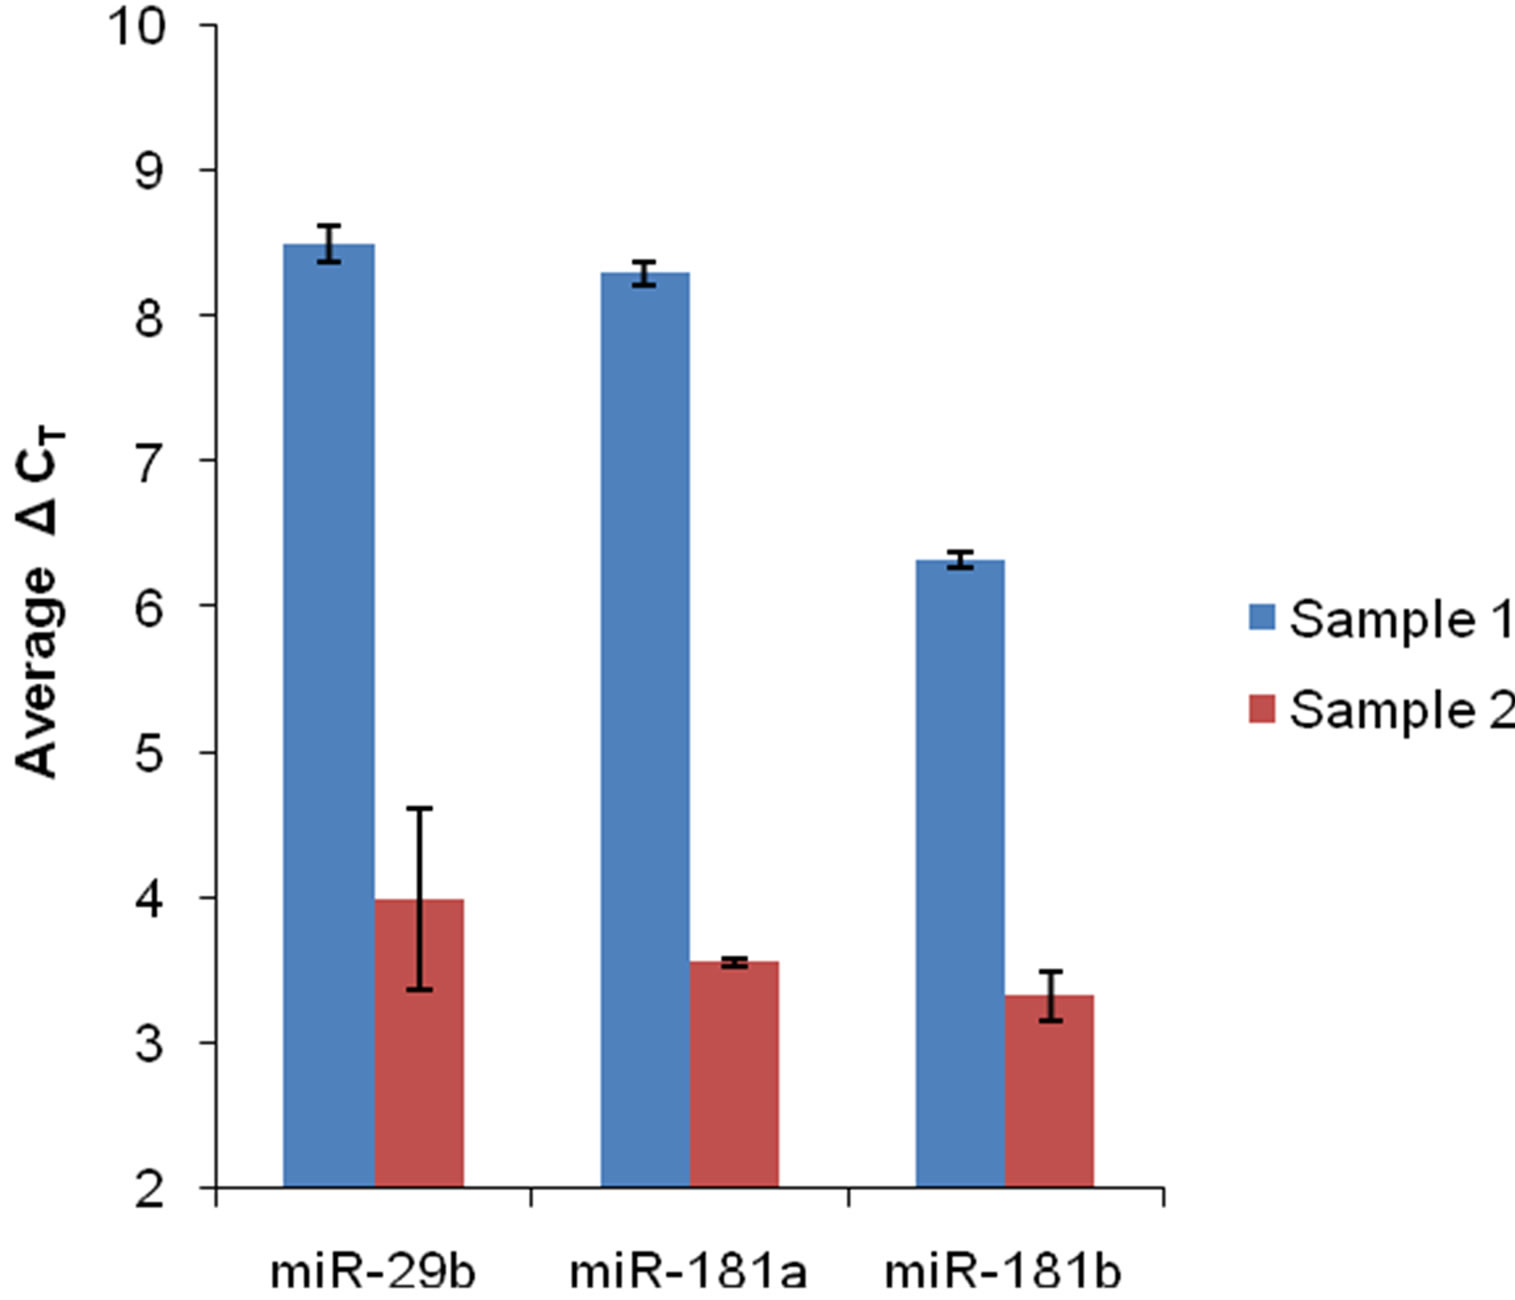
Supplementary Figure 3. Detection of specific miRNA in extracted RNA samples. Pre-designed TaqMan® microRNA assays from Life Technologies (Carlsbad, CA) were used. Following the manufacturer’s protocol, each miRNA was first converted into cDNA. Real-time PCR was then performed by using the TaqMan® protocol. Three different miRNAs from two different extracted RNA samples were analyzed. ΔCT is the CT value for a specific miRNA that has been normalized to an internal control (U6 RNA). Each average ΔCT is the result of three replicates. Error bars represent one standard deviation.
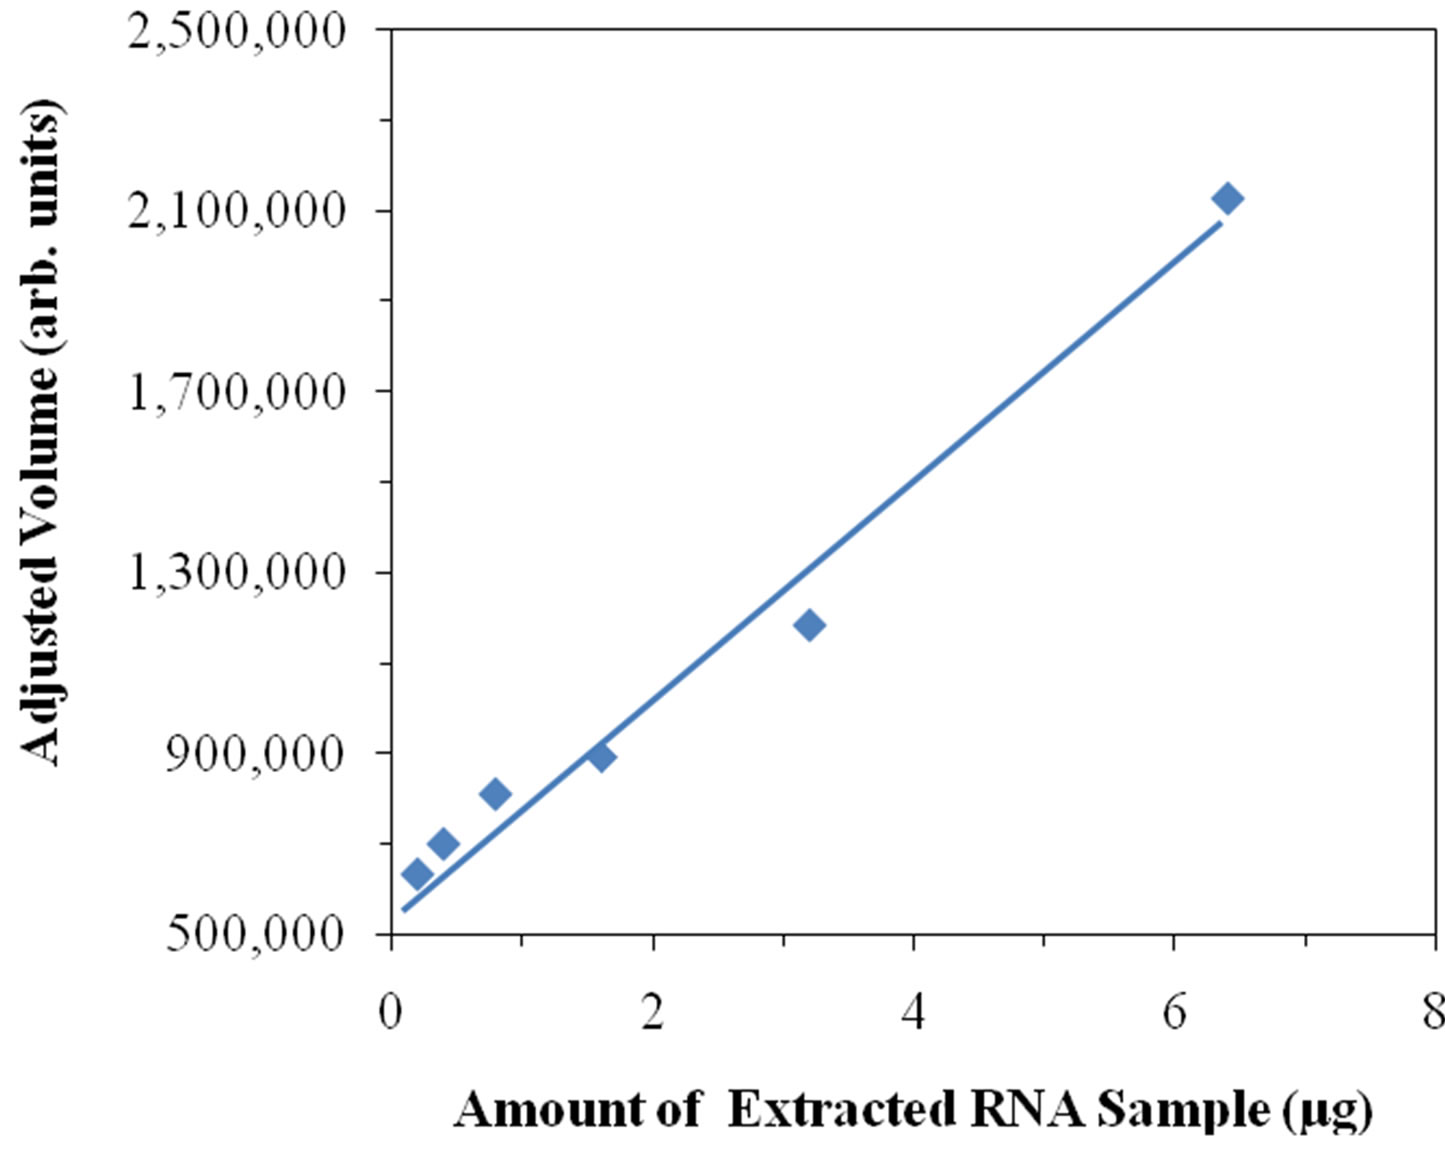
Supplementary Figure 4.Relationship between amount of RNA and adjusted volume. Different amounts of an extracted RNA sample were loaded into different lanes for PAGE analysis. The gel was stained with SYBR(R) Green II dye as described in Materials and Methods. From the gel image, the same region in each lane was selected, and the corresponding adjusted volumes were obtained. The amount of extracted RNA sample loaded in different lanes is plotted against the adjusted volume obtained from the same selected region in different lanes.
NOTES
*Corresponding author.