Paper Menu >>
Journal Menu >>
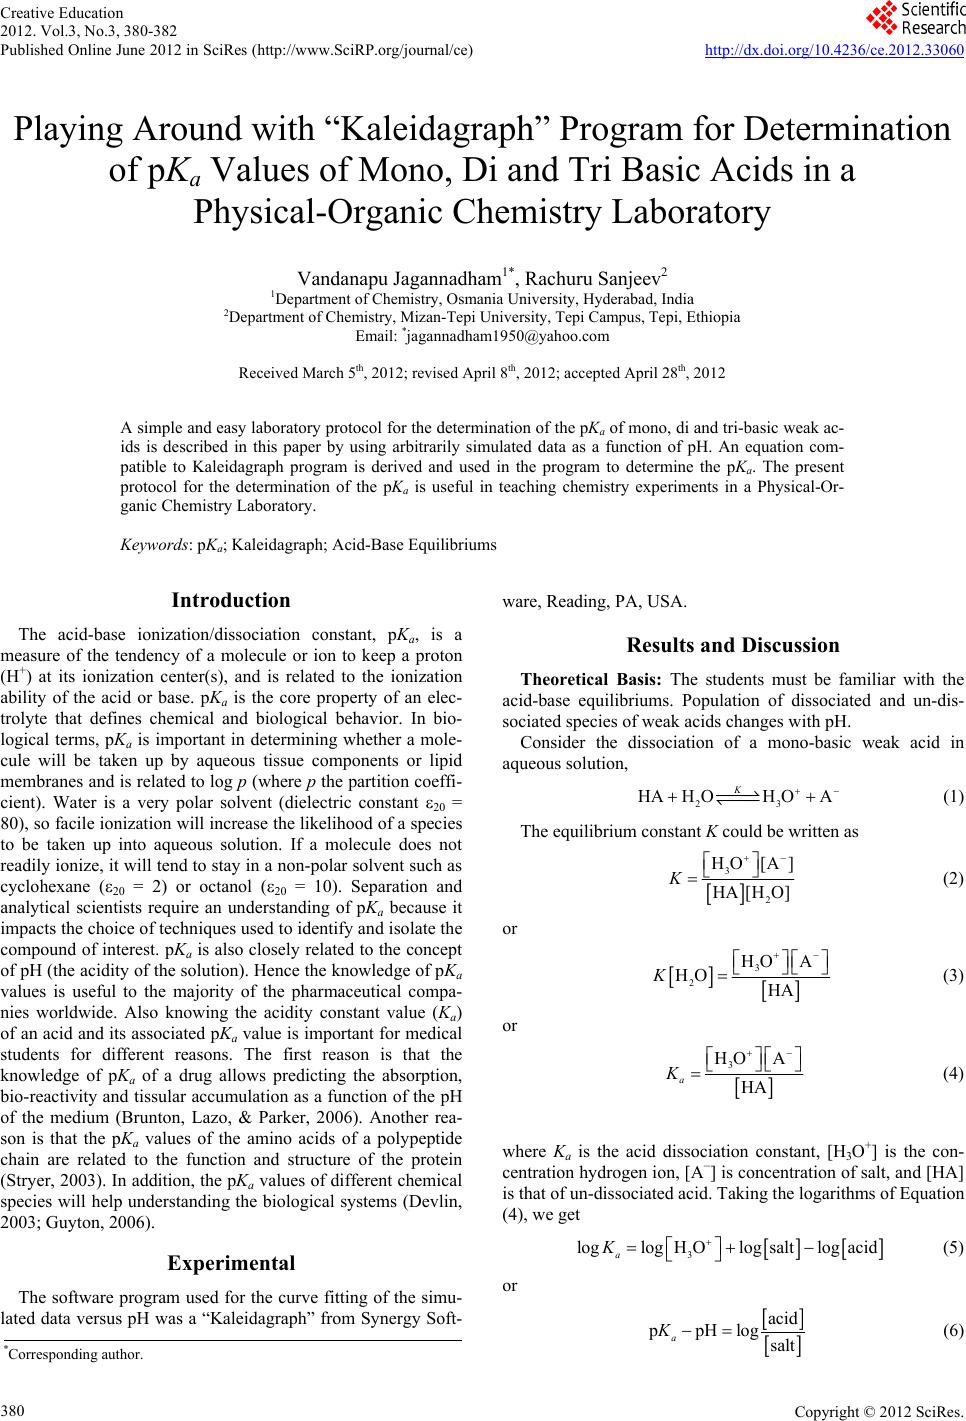 Creative Education 2012. Vol.3, No.3, 380-382 Published Online June 2012 in SciRes (http://www.SciRP.org/journal/ce) http://dx.doi.org/10.4236/ce.2012.33060 Copyright © 2012 SciRes. 380 Playing Around with “Kaleidagraph” Program for Determination of pKa Values of Mono, Di and Tri Basic Acids in a Physical-Organic Chemistry Laboratory Vandanapu Jagannadham1*, Rachuru Sanjeev2 1Department of Chemistry, Osmania University, Hyderabad, India 2Department of Chemistry, Mizan-Tepi University, Tepi Campus, Tepi, Ethiopia Email: *jagannadham1950@yahoo.com Received March 5th, 2012; revised April 8th, 2012; accepted April 28th, 2012 A simple and easy laboratory protocol for the determination of the pKa of mono, di and tri-basic weak ac- ids is described in this paper by using arbitrarily simulated data as a function of pH. An equation com- patible to Kaleidagraph program is derived and used in the program to determine the pKa. The present protocol for the determination of the pKa is useful in teaching chemistry experiments in a Physical-Or- ganic Chemistry Laboratory. Keywords: pKa; Kaleidagraph; Acid-Base Equilibriums Introduction The acid-base ionization/dissociation constant, pKa, is a measure of the tendency of a molecule or ion to keep a proton (H+) at its ionization center(s), and is related to the ionization ability of the acid or base. pKa is the core property of an elec- trolyte that defines chemical and biological behavior. In bio- logical terms, pKa is important in determining whether a mole- cule will be taken up by aqueous tissue components or lipid membranes and is related to log p (where p the partition coeffi- cient). Water is a very polar solvent (dielectric constant 20 = 80), so facile ionization will increase the likelihood of a species to be taken up into aqueous solution. If a molecule does not readily ionize, it will tend to stay in a non-polar solvent such as cyclohexane (20 = 2) or octanol (20 = 10). Separation and analytical scientists require an understanding of pKa because it impacts the choice of techniques used to identify and isolate the compound of interest. pKa is also closely related to the concept of pH (the acidity of the solution). Hence the knowledge of pKa values is useful to the majority of the pharmaceutical compa- nies worldwide. Also knowing the acidity constant value (Ka) of an acid and its associated pKa value is important for medical students for different reasons. The first reason is that the knowledge of pKa of a drug allows predicting the absorption, bio-reactivity and tissular accumulation as a function of the pH of the medium (Brunton, Lazo, & Parker, 2006). Another rea- son is that the pKa values of the amino acids of a polypeptide chain are related to the function and structure of the protein (Stryer, 2003). In addition, the pKa values of different chemical species will help understanding the biological systems (Devlin, 2003; Guyton, 2006). Experimental The software program used for the curve fitting of the simu- lated data versus pH was a “Kaleidagraph” from Synergy Soft- ware, Reading, PA, USA. Results and Discussion Theoretical Basis: The students must be familiar with the acid-base equilibriums. Population of dissociated and un-dis- sociated species of weak acids changes with pH. Consider the dissociation of a mono-basic weak acid in aqueous solution, 23 HAH OH OA K (1) The equilibrium constant K could be written as 3 2 HO[A] HA [H O] K (2) or 3 2 HO A HO HA K (3) or 3 HO A HA a K (4) where Ka is the acid dissociation constant, [H3O+] is the con- centration hydrogen ion, [A−] is concentration of salt, and [HA] is that of un-dissociated acid. Taking the logarithms of Equation (4), we get 3 HOlogsaltlolog lacogg a K id (5) or ppHlog acid salt a K (6) *Corresponding author. 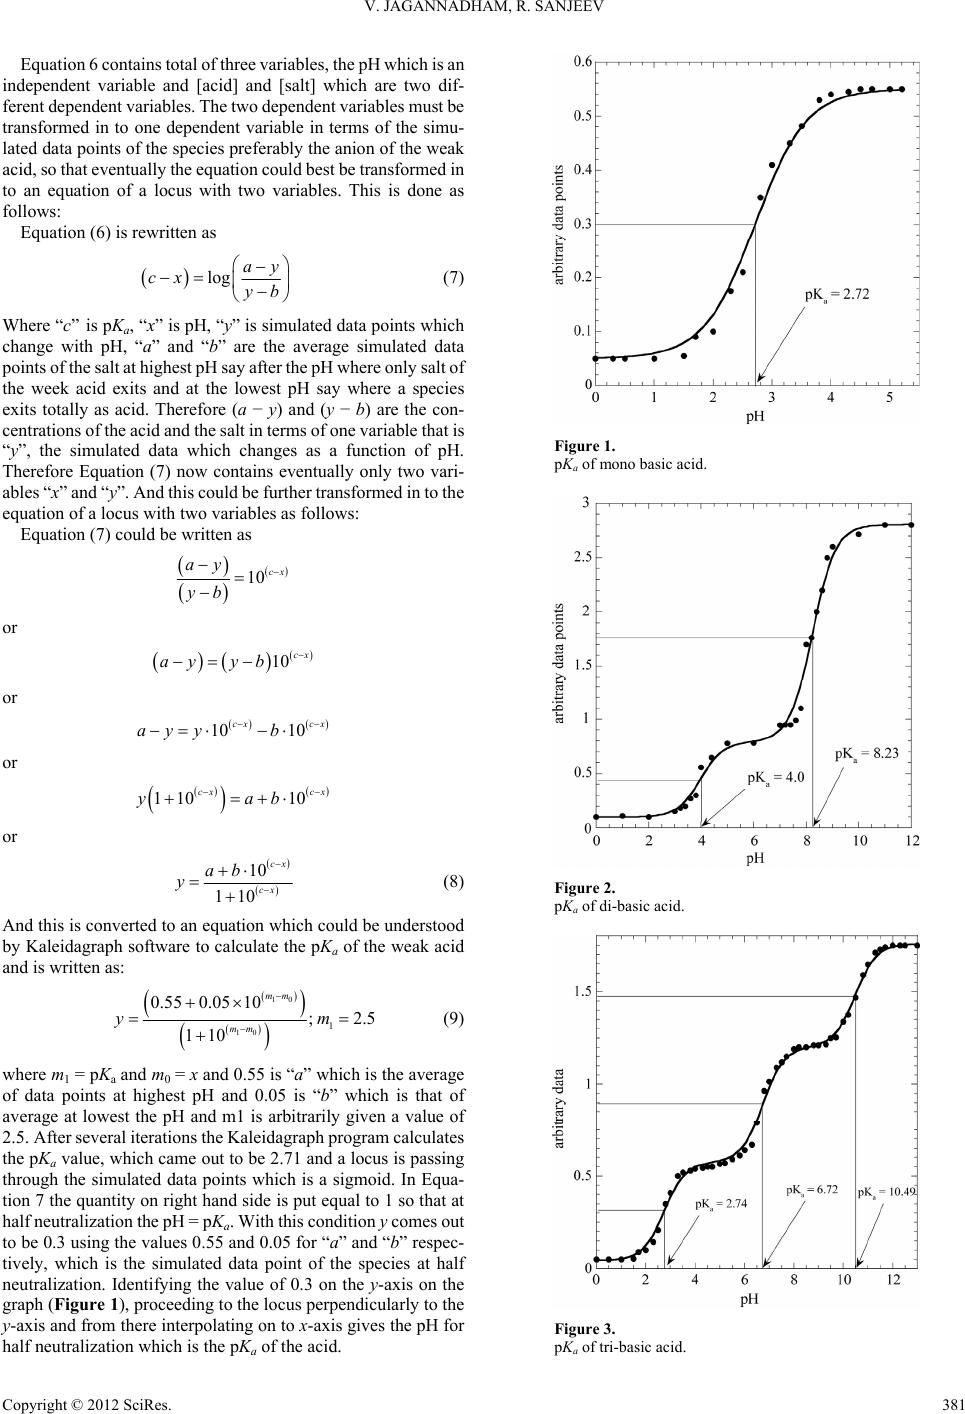 V. JAGANNADHAM, R. SANJEEV Equation 6 contains total of three variables, the pH which is an independent variable and [acid] and [salt] which are two dif- ferent dependent variables. The two dependent variables must be transformed in to one dependent variable in terms of the simu- lated data points of the species preferably the anion of the weak acid, so that eventually the equation could best be transformed in to an equation of a locus with two variables. This is done as follows: Equation (6) is rewritten as log ay cx yb (7) Where “c” is pKa, “x” is pH, “y” is simulated data points which change with pH, “a” and “b” are the average simulated data points of the salt at highest pH say after the pH where only salt of the week acid exits and at the lowest pH say where a species exits totally as acid. Therefore (a − y) and (y − b) are the con- centrations of the acid and the salt in terms of one variable that is “y”, the simulated data which changes as a function of pH. Therefore Equation (7) now contains eventually only two vari- ables “x” and “y”. And this could be further transformed in to the equation of a locus with two variables as follows: Equation (7) could be written as 10 cx ay yb or 10 cx ayyb or 10 10 cx cx bayy or 1110 0 cx cx yab or 10 101 cx cx ab y (8) And this is converted to an equation which could be understood by Kaleidagraph software to calculate the pKa of the weak acid and is written as: 10 10 1 0.550.05 10 ;2. 110 mm mm ym 5 (9) where m1 = pKa and m0 = x and 0.55 is “a” which is the average of data points at highest pH and 0.05 is “b” which is that of average at lowest the pH and m1 is arbitrarily given a value of 2.5. After several iterations the Kaleidagraph program calculates the pKa value, which came out to be 2.71 and a locus is passing through the simulated data points which is a sigmoid. In Equa- tion 7 the quantity on right hand side is put equal to 1 so that at half neutralization the pH = pKa. With this condition y comes out to be 0.3 using the values 0.55 and 0.05 for “a” and “b” respec- tively, which is the simulated data point of the species at half neutralization. Identifying the value of 0.3 on the y-axis on the graph (Figure 1), proceeding to the locus perpendicularly to the y-axis and from there interpolating on to x-axis gives the pH for half neutralization which is the pKa of the acid. Figure 1. pKa of mono basic acid. Figure 2. pKa of di-basic acid. Figure 3. pKa of tri-basic acid. Copyright © 2012 SciRes. 381 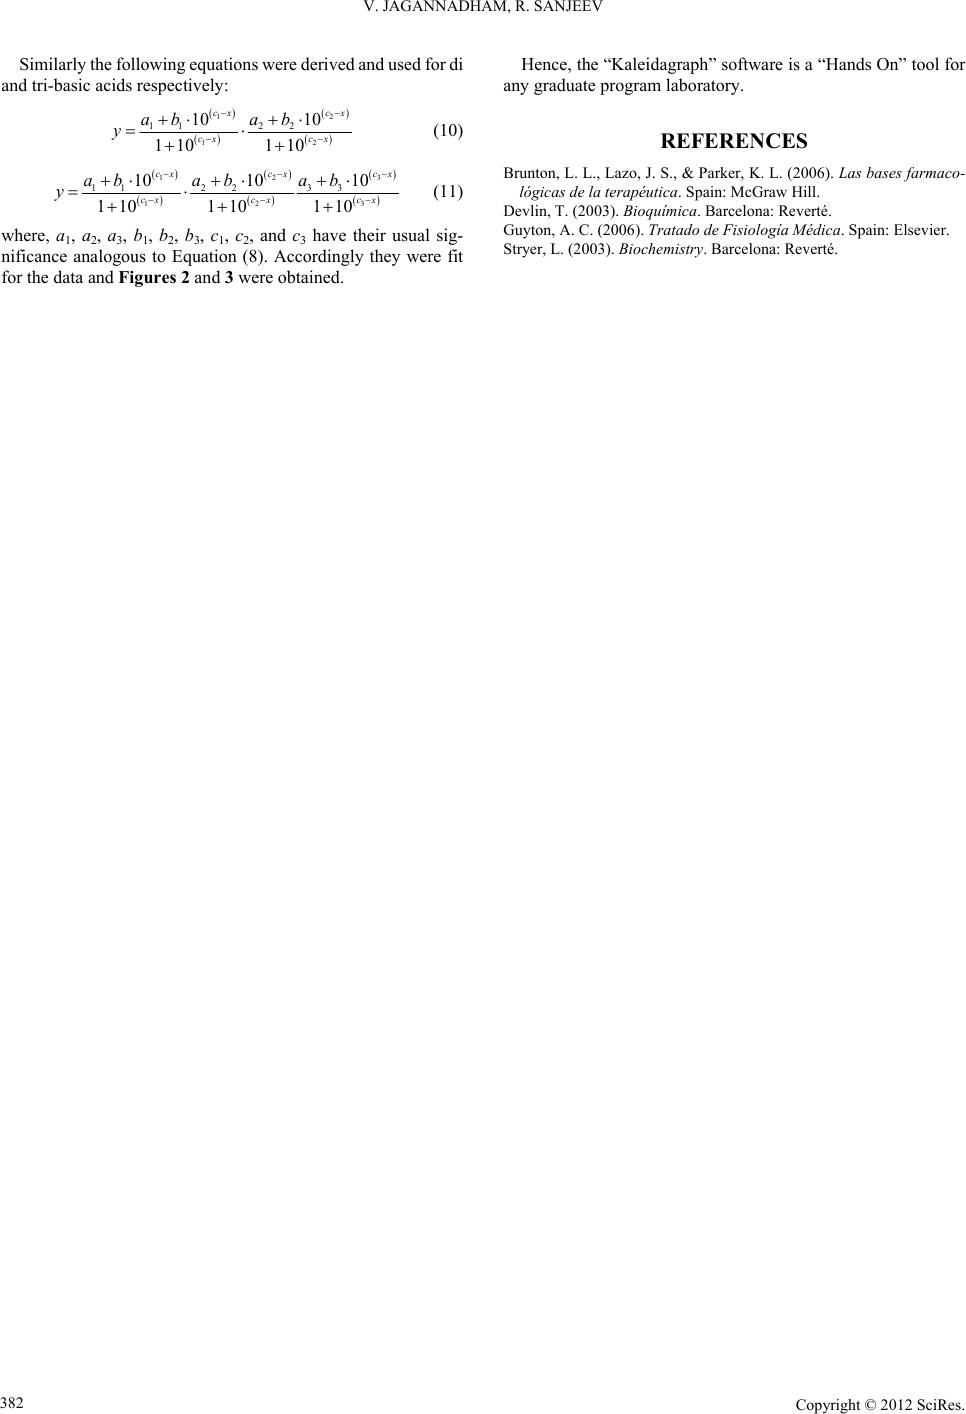 V. JAGANNADHAM, R. SANJEEV Copyright © 2012 SciRes. 382 Hence, the “Kaleidagraph” software is a “Hands On” tool for any graduate program laboratory. Similarly the following equations were derived and used for di and tri-basic acids respectively: 12 1 112 2 10 10 110 110 cx cx cx cx ab ab y 2 (10) REFERENCES Brunton, L. L., Lazo, J. S., & Parker, K. L. (2006). Las bases farmaco- lógicas de la terapéutica. Spain: McGraw Hill. 3 12 12 112 23 3 1010 10 110110 110 cx cx cx cxcx cx abab ab y 3 (11) Devlin, T. (2003). Bioquímica. Barcelona: Reverté. Guyton, A. C. (2006). Tratado de Fisiol o g í a Médica. Spain: Elsevier. where, a1, a2, a3, b1, b2, b3, c1, c2, and c3 have their usual sig- nificance analogous to Equation (8). Accordingly they were fit for the data and Figures 2 and 3 were obtained. Stryer, L. (2003). Biochemistry. Barcelona: Reverté. |