 J. Biomedical Science and Engineering, 2010, 3, 556-567 doi:10.4236/jbise.2010.36078 Published Online June 2010 (http://www.SciRP.org/journal/jbise/ JBiSE ). Published Online June 2010 in SciRes. http://www.scirp.org/journal/jbise A new approach for epileptic seizure detection: sample entropy based feature extraction and extreme learning machine Yuedong Song, Pietro Liò Computer Laboratory, University of Cambridge, Cambridge, United Kingdom. Email: ys340@cam.ac.uk; Pietro.Lio@cl.cam.ac.uk Received 4 March 2010; revised 15 April 2010; accepted 18 April 2010. ABSTRACT The electroencephalogram (EEG) signal plays a key role in the diagnosis of epilepsy. Substantial data is generated by the EEG recordings of ambulatory re- cording systems, and detection of epileptic activity requires a time-consuming analysis of the complete length of the EEG time series data by a neurology expert. A variety of automatic epilepsy detection sys- tems have been developed during the last ten years. In this paper, we investigate the potential of a re- cently-proposed statistical measure parameter re- garded as Sample Entropy (SampEn), as a method of feature extraction to the task of classifying three dif- ferent kinds of EEG signals (normal, interictal and ictal) and detecting epileptic seizures. It is known that the value of the SampEn falls suddenly during an epileptic seizure and this fact is utilized in the pro- posed diagnosis system. Two different kinds of classi- fication models, back-propagation neural network (BPNN) and the recently-developed extreme learning machine (ELM) are tested in this study. Results show that the proposed automatic epilepsy detection sys- tem which uses sample entropy (SampEn) as the only input feature, together with extreme learning ma- chine (ELM) classification model, not only achieves high classification accuracy (95.67%) but also very fast speed. Keywords: Epileptic Seizure; Electroencephalogram (EEG); Sample Entropy (SampEn ); Backpropagation Neural Network (BPNN); Extreme Learning Machine (ELM); Detection 1. INTRODUCTION Epilepsy, the second most common serious neurological disorder in human beings after stroke, is a chronic con- dition of the nervous system and it is characterized by recurrent unprovoked seizures. Approximately one in every 100 individuals worldwide are suffering from epi- lepsy [1]. Electroencephalography (EEG) is an important clinical tool, monitoring, diagnosing and managing neu- rological disorders related to epilepsy. In comparison with other methods such as Electrocorticogram (ECOG), EEG is a clean and safe technique for monitoring the brain activity. In spite of available dietary, drug and surgical treat- ment options, currently nearly one out of three epilepsy patients cannot be treated. They are completely subject to the sudden and unforeseen seizures which have a great effect on their daily life, with temporary impair- ments of perception, speech, motor control, memory and/or consciousness. Many new therapies are being investigated and among them the most promising are implantable devices that deliver direct electrical stimula- tion to affected areas of the brain. These treatments will greatly depend on robust algorithms for seizure detection to perform effectively. Because the onset of the seizures cannot be predicted in a short period, a continuous re- cording of the EEG is required to detect epilepsy. How- ever, analysis by visual inspection of long recordings of EEG, in order to find traces of epilepsy, is tedious, time- consuming and high-cost. Therefore, automated detec- tion of epilepsy has been a goal of many researchers for a long time. With the advent of technology, the digital EEG data can be input to an automated seizure detection system, allowing physicians to treat more patients in a given time because the time taken to review the EEG data is greatly reduced by automation. In recent years, there has been an increasing interest in the application of pattern recognition (PR) methods for automatic epileptic seizure detection. Several methods have been developed for handling EEG signals classifi- cation, and among these methods, Multi-layer Percep- tron Neural Network (MLPNN) [2-7] and Support Vec- tor Machine (SVM) [8-10] are two widely-used classifi- cation paradigms. Most of the automatic epileptic sei- zure detection system is built by time-frequency domain based feature extraction followed by a variety of classi- fication models. It has been found that the classification 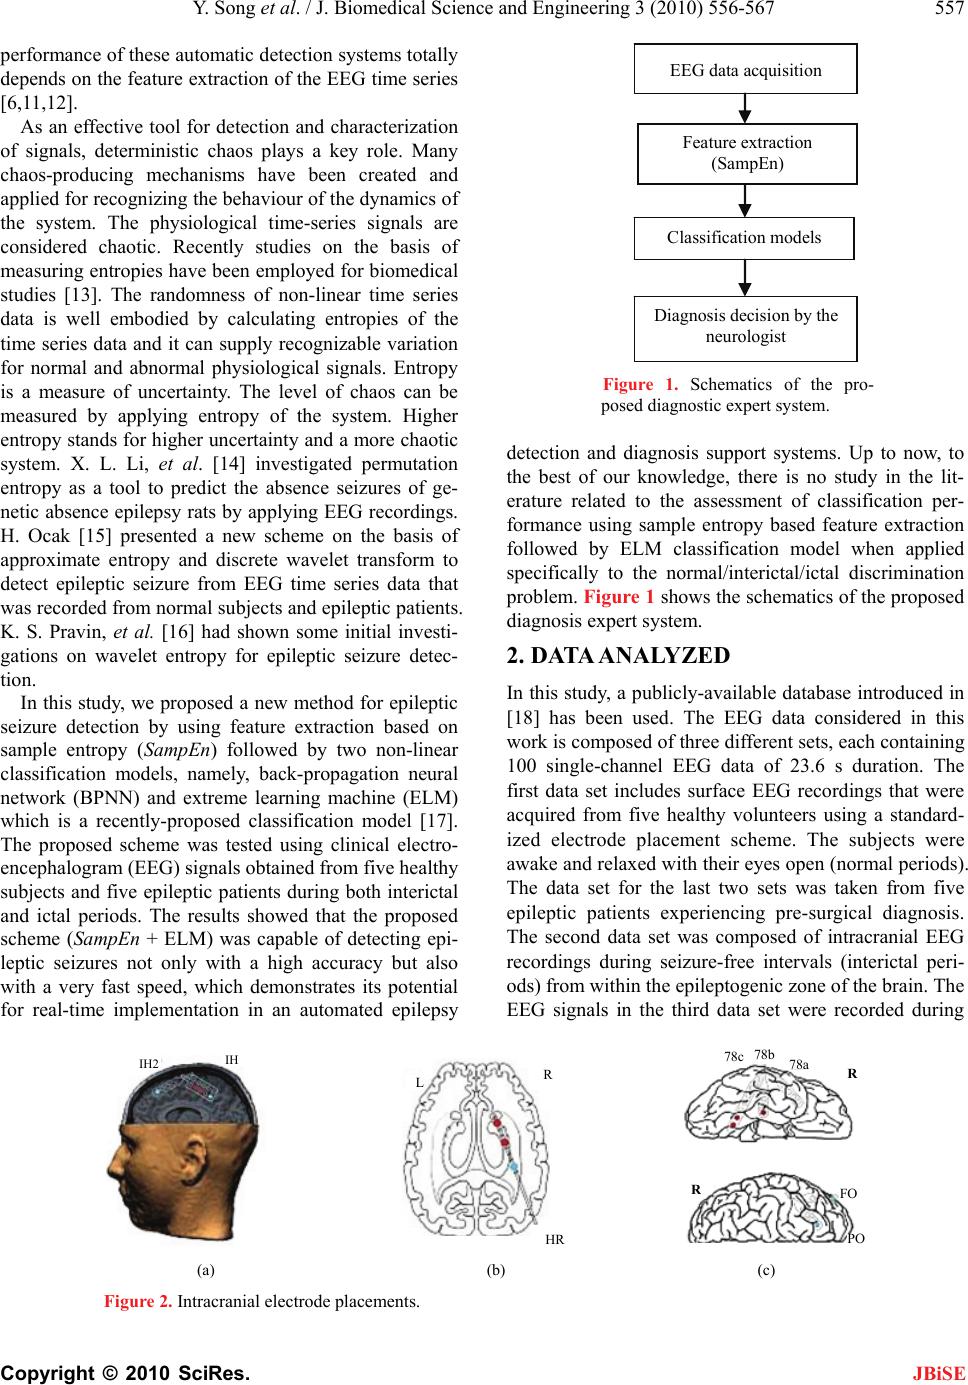 Y. Song et al. / J. Biomedical Science and Engineering 3 (2010) 556-567 557 Copyright © 2010 SciRes. JBiSE performance of these automatic detection systems totally depends on the feature extraction of the EEG time series [6,11,12]. As an effective tool for detection and characterization of signals, deterministic chaos plays a key role. Many chaos-producing mechanisms have been created and applied for recognizing the behaviour of the dynamics of the system. The physiological time-series signals are considered chaotic. Recently studies on the basis of measuring entropies have been employed for biomedical studies [13]. The randomness of non-linear time series data is well embodied by calculating entropies of the time series data and it can supply recognizable variation for normal and abnormal physiological signals. Entropy is a measure of uncertainty. The level of chaos can be measured by applying entropy of the system. Higher entropy stands for higher uncertainty and a more chaotic system. X. L. Li, et al. [14] investigated permutation entropy as a tool to predict the absence seizures of ge- netic absence epilepsy rats by applying EEG recordings. H. Ocak [15] presented a new scheme on the basis of approximate entropy and discrete wavelet transform to detect epileptic seizure from EEG time series data that was recorded from normal subjects and epileptic patients. K. S. Pravin, et al. [16] had shown some initial investi- gations on wavelet entropy for epileptic seizure detec- tion. In this study, we proposed a new method for epileptic seizure detection by using feature extraction based on sample entropy (SampEn ) followed by two non-linear classification models, namely, back-propagation neural network (BPNN) and extreme learning machine (ELM) which is a recently-proposed classification model [17]. The proposed scheme was tested using clinical electro- encephalogram (EEG) signals obtained from five healthy subjects and five epileptic patients during both interictal and ictal periods. The results showed that the proposed scheme (SampEn + ELM) was capable of detecting epi- leptic seizures not only with a high accuracy but also with a very fast speed, which demonstrates its potential for real-time implementation in an automated epilepsy EEG data acquisition Feature extraction (SampEn) Classification models Diagnosis decision by the neurologist Figure 1. Schematics of the pro- posed diagnostic expert system. detection and diagnosis support systems. Up to now, to the best of our knowledge, there is no study in the lit- erature related to the assessment of classification per- formance using sample entropy based feature extraction followed by ELM classification model when applied specifically to the normal/interictal/ictal discrimination problem. Figure 1 shows the schematics of the proposed diagnosis expert system. 2. DATA ANALYZED In this study, a publicly-available database introduced in [18] has been used. The EEG data considered in this work is composed of three different sets, each containing 100 single-channel EEG data of 23.6 s duration. The first data set includes surface EEG recordings that were acquired from five healthy volunteers using a standard- ized electrode placement scheme. The subjects were awake and relaxed with their eyes open (normal periods). The data set for the last two sets was taken from five epileptic patients experiencing pre-surgical diagnosis. The second data set was composed of intracranial EEG recordings during seizure-free intervals (interictal peri- ods) from within the epileptogenic zone of the brain. The EEG signals in the third data set were recorded during IH2 IH R L HR 78c 78 78a R RFO PO (a) (b) (c) Figure 2. Intracranial electrode placements. 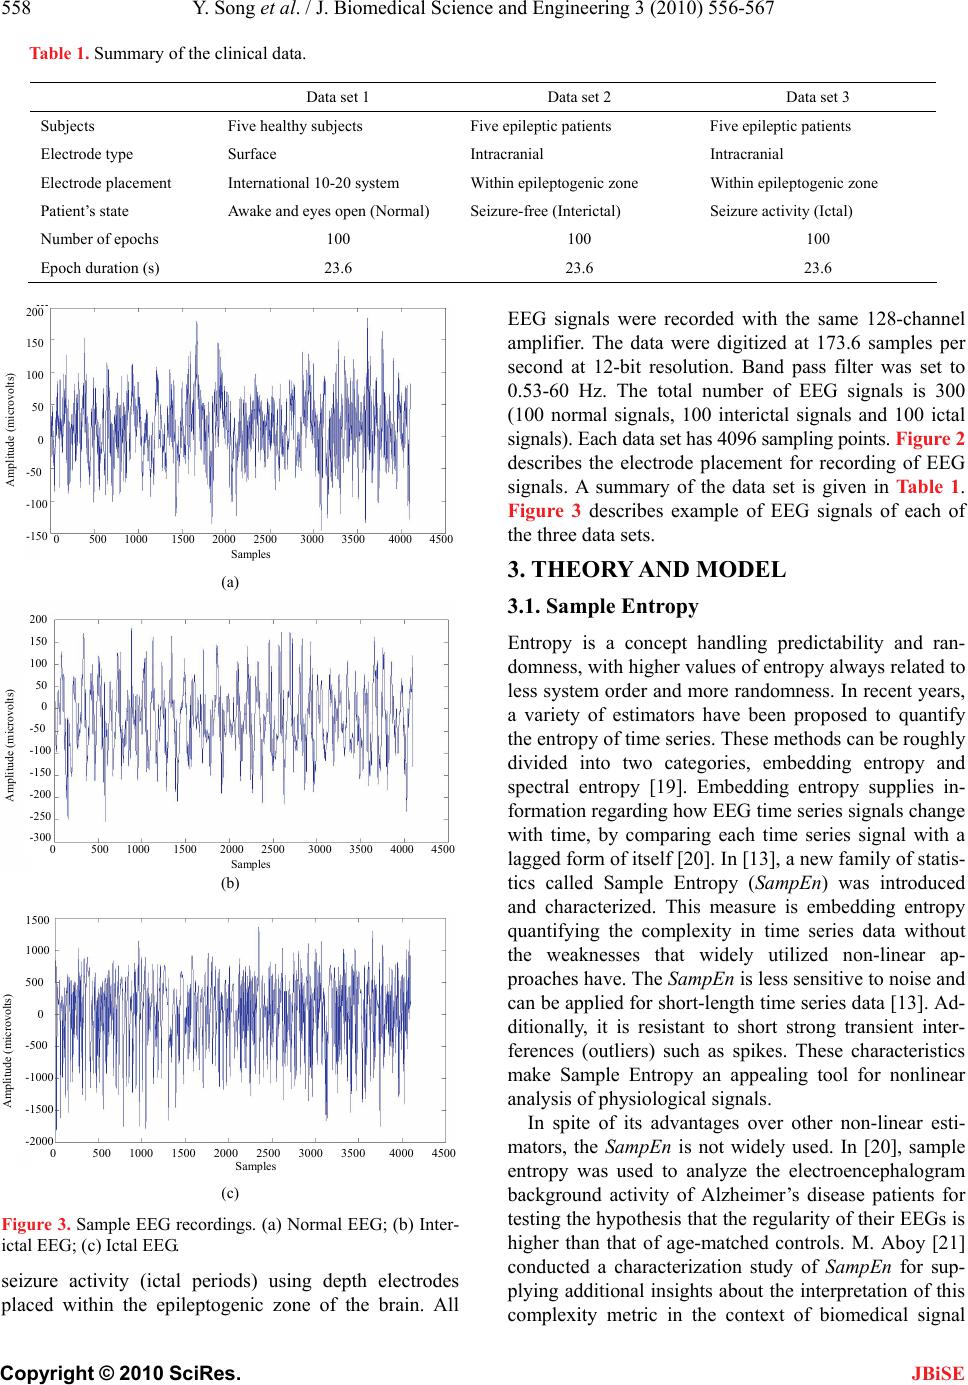 558 Y. Song et al. / J. Biomedical Science and Engineering 3 (2010) 556-567 Copyright © 2010 SciRes. JBiSE Table 1. Summary of the clinical data. Data set 1 Data set 2 Data set 3 Subjects Five healthy subjects Five epileptic patients Five epileptic patients Electrode type Surface Intracranial Intracranial Electrode placement International 10-20 system Within epileptogenic zone Within epileptogenic zone Patient’s state Awake and eyes open (Normal) Seizure-free (Interictal) Seizure activity (Ictal) Number of epochs 100 100 100 Epoch duration (s) 23.6 23.6 23.6 0 500 1000 1500 2000 2500 3000 3500 4000 4500 Samples 200 150 100 50 0 -50 -100 -150 Amplitude (microvolts) (a) 0 500 1000 1500 2000 2500 3000 3500 4000 4500 Samples 200 150 100 50 0 -50 -100 -150 -200 -250 -300 Amplitude (microvolts) (b) Amplitude (microvolts) 0 500 1000 1500 2000 2500 3000 3500 4000 4500 Samples 1500 1000 500 0 -500 -1000 -1500 -2000 (c) Figure 3. Sample EEG recordings. (a) Normal EEG; (b) Inter- ictal EEG; (c) Ictal EEG. seizure activity (ictal periods) using depth electrodes placed within the epileptogenic zone of the brain. All EEG signals were recorded with the same 128-channel amplifier. The data were digitized at 173.6 samples per second at 12-bit resolution. Band pass filter was set to 0.53-60 Hz. The total number of EEG signals is 300 (100 normal signals, 100 interictal signals and 100 ictal signals). Each data set has 4096 sampling points. Figure 2 describes the electrode placement for recording of EEG signals. A summary of the data set is given in Table 1. Figure 3 describes example of EEG signals of each of the three data sets. 3. THEORY AND MODEL 3.1. Sample Entropy Entropy is a concept handling predictability and ran- domness, with higher values of entropy always related to less system order and more randomness. In recent years, a variety of estimators have been proposed to quantify the entropy of time series. These methods can be roughly divided into two categories, embedding entropy and spectral entropy [19]. Embedding entropy supplies in- formation regarding how EEG time series signals change with time, by comparing each time series signal with a lagged form of itself [20]. In [13], a new family of statis- tics called Sample Entropy (SampEn) was introduced and characterized. This measure is embedding entropy quantifying the complexity in time series data without the weaknesses that widely utilized non-linear ap- proaches have. The SampEn is less sensitive to noise and can be applied for short-length time series data [13]. Ad- ditionally, it is resistant to short strong transient inter- ferences (outliers) such as spikes. These characteristics make Sample Entropy an appealing tool for nonlinear analysis of physiological signals. In spite of its advantages over other non-linear esti- mators, the SampEn is not widely used. In [20], sample entropy was used to analyze the electroencephalogram background activity of Alzheimer’s disease patients for testing the hypothesis that the regularity of their EEGs is higher than that of age-matched controls. M. Aboy [21] conducted a characterization study of SampEn for sup- plying additional insights about the interpretation of this complexity metric in the context of biomedical signal  Y. Song et al. / J. Biomedical Science and Engineering 3 (2010) 556-567 559 Copyright © 2010 SciRes. JBiSE analysis. Moreover, this entropy measure has been used to evaluate the signal complexity of the cyclic behaviour of heart rate variability (HRV) in obstructive sleep apnea syndrome [22]. In this study, SampEn is investigated for the first time as a feature extracted in the automatic de- tection of epilepsy. For calculating the SampEn, the embedding dimension (m) and vector comparison distance (r) must be specified. It is common to set the embedding dimension parameter m to be m = 1, 2 or 3 and to set the vector comparison distance r to be some percentage of the standard deviation of the time series so as not to depend on the absolute am- plitude of the signal [13]. SampEn(m,r,N) is the negative logarithm of the conditional probability that two se- quences similar for m points remain similar at the next point, where self-matches are not included in calculating the probability. Thus, a larger value often corresponds to more irregularity or complexity in the time series data. In the proposed automated epileptic seizure detection system, the value of the SampEn is determined as shown in the following steps: 1) Given N data points from a time series {x(n)} = x(1), x(2),...,x(N), take m vectors (1),..., (1) mm XXNm ( 1)],xi m 1i defined as mfor ( )[( ),(1),...,Xixi xi These vectors stand for m consecutive x val- ues, starting at the ith sample. 1.Nm 2) Let r denote the noise filter level which is defined as 0.1,0.2,...,0.5rgStdfor g (1) where St d represents the standard deviation of the data sequence X. 3) The distance between vectors () m iand () m j, is defined as the maximum absolute difference between their scalar components: [( ),()], mm dXi Xj 0,..., 1 [(),()] max(|()()|) mm km dXi Xjxikxjk . (2) 4) For a given () m i ,i , count the number of j such that (1, )jNmj [(),()] mm dXiXjr. This number is represented as , Then, for i B 1,iNm 1 () 1 m i Br B Nm i , (3) Here, note that only the first vectors of length m are considered in order to ensure that for the vector Nm ()1iNm 1m i is also defined. 5) Define as () m Br 1 1 () (). Nm m i i Br Br Nm m (4) 6) We increment the dimension to m + 1 and compute i as the number of 1() m i within r of 1() m j , where j ranges from 1 to . We then define as (ji)Nm ()r m i A 1 () . 1 m ii rA Nm (5) 7) We define () m r as 1 1 ()(). Nm m i i m r Nm Ar (6) Thus, represents the probability that two se- quences will match for m points, whereas () m Br () m r re- pressents the probability that two sequences will match for m + 1 points. The sample entropy is defined by () (,) lim{ln[]} () m m N r SampEn m rBr (7) Since the time series length is finite, SampEn is esti- mated as () (,, )ln[] () m m Br SampEn mrN r (8) 3.2. An Example of the Computation Procedure of SampEn Assume that the sequence N is composed of 50 sam- pling points (i.e., N = 50). N = {51,52,53,54,55, 51,52,53,54,55,51,...,55} The total sequence is periodic of 5. Let us choose m=5 and r = 2, so we have: 5(1){51,52,53,54,55}X 5(2) {52,53,54,55,51}X 5(3){53,54,55,51,52}X 5(4){54,55,51,52,53}X 5(5) {55,51,52,53,54}X and so on. Firstly we want to find the number of X5(i) which is similar to X5(1). Because we have chosen r = 2 as the threshold parameter, which means each of the five elements of X5(i) has to be within ±2 units of the corre- sponding element of X5(1). For instance, X5(2) is not similar to X5(1) because the last elements in these two sequences (51,55) differ by more than two units. The conditions of similarity to X5(1) are satisfied only by X5(6), X5(11), X 5(16), X 5(21),..., X 5(41) (excludes X5(1) since j ≠ i and also excludes X5(46) since only the first 45 elements of the X5(i) are considered in terms of the definition of SampEn). Thus, we get B1 = 8. Because the whole number of X5(i) is so we have 1505144,Nm  560 Y. Song et al. / J. Biomedical Science and Engineering 3 (2010) 556-567 Copyright © 2010 SciRes. JBiSE 51 1 8 (2) . 144 B BNm The above steps are repeated for determining the num- ber of X5(i) which are similar to X5(2), X5(3) and so on. By using the same inference, X5(2) is similar to X5(7), X5(12), X5(17),..., X5(42). Thus, we also get B2 = 8. Gen- erally, in this example, we have Bi = 8 for Therefore, is 8/44 and we can get the mean value of all 45 of : 1iNm . 5(2) i B B5 i 5 8 45 8 44 (2)0.1818 45 44 B In order to get SampEn(5,2 ,N), the above-mentioned computation procedure needs to be repeated for m = 6. Doing so, we get 6(1) {51,52,53,54,55,51}X 6(2) {52,53,54,55,51,52}X 6(3) {53,54,55,51,52,53}X and so on. By the same reasoning steps as that with m = 5, we find that: For 7 if i=5 modulo 5 1, A 8 otherwise i iNm 6 Therefore, is either 7/43 or 8/43, depending on , and the mean value of all 44 elements of the is: (2) i A i A (2) 6 i A 6 78 8368 43 43 (2) 0.1818 44 44 A Finally, we compute the value of SampEn as follows: 5 6 (2) (5, 2,)ln[]ln10 (2) B SampEn NA 2 This is the smallest value of SampEn, which indicates that the original time series data is highly regular and predictable. 3.3. Levenberg-Marquardt Algorithm Artificial neural network training is often regarded as a nonlinear least-squares problem and the Levenberg- Marquardt algorithm is a least-squares estimation algo- rithm utilizing the maximum neighbourhood idea, and it appears to be the fastest method for training feed- for- ward neural networks. Let be an objective error function composed of n individual error terms as follows: ()Ew 2() j ew 2 1 ()()|| ()|| n j j Ewewfw (9) where j and dj is the desired value of output neuron j, is the actual output of the neu- ron. 2 () () jdj ewy y j y 2 y The objective of the Levenberg-Marquardt algorithm is to calculate the weight vector w so that is minimized. By utilizing the LM algorithm, a novel weight vector wp+1 can be obtained from the previous weight vector wp as follows: ()Ew 1 p wwW P (10) where s is defined as 1 (())( ) TT ppppp wJfwJJI (11) In Equation (10), p is the Jacobian of f assessed at p, γ is the Marquardt parameter, and I is the identity matrix. The Levenberg-Marquardt algorithm can be de- scribed as follows: 1) Calculate . 2) Begin with a small value of γ ( w () p Ew 0.01 ). 3) Solve equation (11) for w and calculate pp Ew( )w . 4) If () pp Ew w , () w Ew increment γ by a factor of 10 and go to step 3. 5) If () pp w(Ew) p : , decrement γ by a factor of 10, update pp wp ww w and go to step 3. 3.4. Extreme Learning Machine (ELM) The general trend in current study of automatic epileptic seizure detection has focused on high accuracy but has not considered the time taken to train the classification models, which should be an important factor of devel- oping an EEG-based detection device for epileptic sei- zures because the online device will need to update its training during use. Therefore some classification mod- els with high classification accuracy may not be satis- factory when considering the trade-off between the clas- sification accuracy and the time for training the classifi- cation models. In our study, in addition to exploring the potential of a nonlinear feature of the EEG signal called sample entropy for electroencephalogram time series classification and epileptic seizure detection, we also investigate the use of a novel paradigm of learning ma- chine called Extreme Learning Machine (ELM) [17], in order to obtain a balance between high classification accuracy and short training time. In recent years, Ex- treme Learning Machine has been increasingly popular in classification tasks due to its high generalization abil- ity and fast learning speed. In [23], a classification sys- tem is built using ELM to classify protein sequences with ten classes of super-families obtained from a do- main database, and its performance is compared with that of Back-propagation Neural Networks. The results show ELM greatly outperforms BPNN in terms of both training time and classification accuracy. R. Zhang, et al. [24] developed an ELM for multi-category classification in three Cancer Microarray Gene Expression datasets, 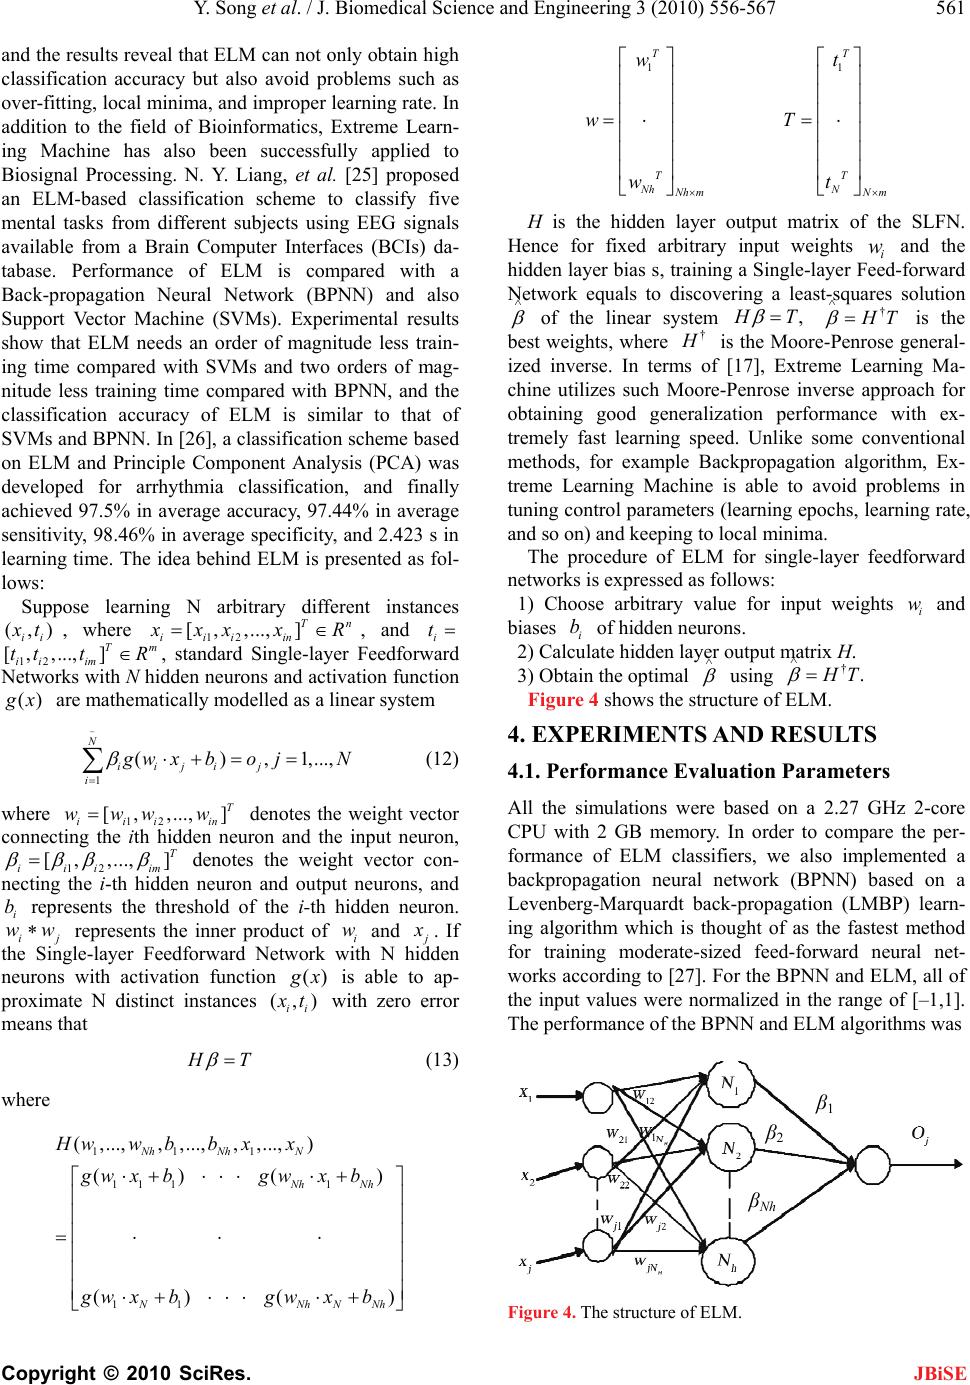 Y. Song et al. / J. Biomedical Science and Engineering 3 (2010) 556-567 561 Copyright © 2010 SciRes. JBiSE and the results reveal that ELM can not only obtain high classification accuracy but also avoid problems such as over-fitting, local minima, and improper learning rate. In addition to the field of Bioinformatics, Extreme Learn- ing Machine has also been successfully applied to Biosignal Processing. N. Y. Liang, et al. [25] proposed an ELM-based classification scheme to classify five mental tasks from different subjects using EEG signals available from a Brain Computer Interfaces (BCIs) da- tabase. Performance of ELM is compared with a Back-propagation Neural Network (BPNN) and also Support Vector Machine (SVMs). Experimental results show that ELM needs an order of magnitude less train- ing time compared with SVMs and two orders of mag- nitude less training time compared with BPNN, and the classification accuracy of ELM is similar to that of SVMs and BPNN. In [26], a classification scheme based on ELM and Principle Component Analysis (PCA) was developed for arrhythmia classification, and finally achieved 97.5% in average accuracy, 97.44% in average sensitivity, 98.46% in average specificity, and 2.423 s in learning time. The idea behind ELM is presented as fol- lows: Suppose learning N arbitrary different instances (,) ii t, where 12 [,,..., ] T iii in n xx xR , and i t 12iiim, standard Single-layer Feedforward Networks with N hidden neurons and activation function [, ,tt () ...,] T tm R x are mathematically modelled as a linear system 1 (),1,..., N iiji j i wxbo jN (12) where 12 denotes the weight vector connecting the ith hidden neuron and the input neuron, 12 denotes the weight vector con- necting the i-th hidden neuron and output neurons, and represents the threshold of the i-th hidden neuron. ij represents the inner product of i and j [,,..., ] T iii in www w , ,...,]T iii im w [ i b ww . If the Single-layer Feedforward Network with N hidden neurons with activation function () x (,) ii is able to ap- proximate N distinct instances t with zero error means that T (13) where 111 11 11 11 (,...,, ,...,,,...,) () ( ()( Nh NhN Nh Nh NNhN Hww bb xx gw xbgwxb gw xbgwxb 11 TT TT Nh N Nh mNm wt wT wt H is the hidden layer output matrix of the SLFN. Hence for fixed arbitrary input weights i and the hidden layer bias s, training a Single-layer Feed-forward Network equals to discovering a least-squares solution w of the linear system , T † T is the best weights, where † is the Moore-Penrose general- ized inverse. In terms of [17], Extreme Learning Ma- chine utilizes such Moore-Penrose inverse approach for obtaining good generalization performance with ex- tremely fast learning speed. Unlike some conventional methods, for example Backpropagation algorithm, Ex- treme Learning Machine is able to avoid problems in tuning control parameters (learning epochs, learning rate, and so on) and keeping to local minima. The procedure of ELM for single-layer feedforward networks is expressed as follows: 1) Choose arbitrary value for input weights and biases of hidden neurons. i w i 2) Calculate hidden layer output matrix H. b 3) Obtain the optimal using †. T Figure 4 shows the structure of ELM. 4. EXPERIMENTS AND RESULTS 4.1. Performance Evaluation Parameters All the simulations were based on a 2.27 GHz 2-core CPU with 2 GB memory. In order to compare the per- formance of ELM classifiers, we also implemented a backpropagation neural network (BPNN) based on a Levenberg-Marquardt back-propagation (LMBP) learn- ing algorithm which is thought of as the fastest method for training moderate-sized feed-forward neural net- works according to [27]. For the BPNN and ELM, all of the input values were normalized in the range of [–1,1]. The performance of the BPNN and ELM algorithms was ) ) Nh β 1 β 2 β Nh Figure 4. The structure of ELM. 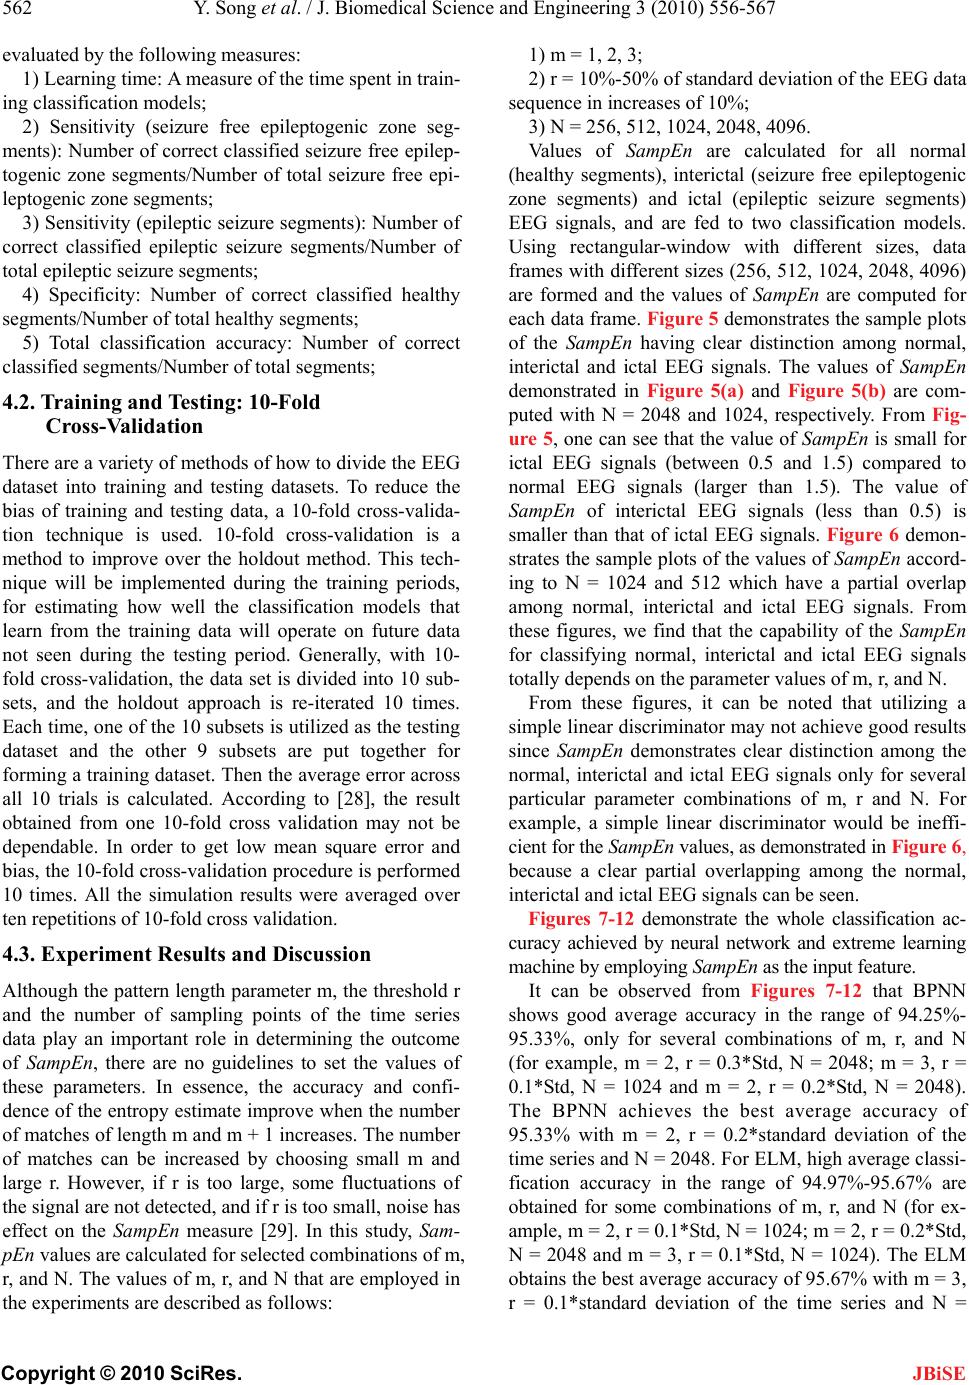 562 Y. Song et al. / J. Biomedical Science and Engineering 3 (2010) 556-567 Copyright © 2010 SciRes. JBiSE evaluated by the following measures: 1) Learning time: A measure of the time spent in train- ing classification models; 2) Sensitivity (seizure free epileptogenic zone seg- ments): Number of correct classified seizure free epilep- togenic zone segments/Number of total seizure free epi- leptogenic zone segments; 3) Sensitivity (epileptic seizure segments): Number of correct classified epileptic seizure segments/Number of total epileptic seizure segments; 4) Specificity: Number of correct classified healthy segments/Number of total healthy segments; 5) Total classification accuracy: Number of correct classified segments/Number of total segments; 4.2. Training and Testing: 10-Fold Cross-Validation There are a variety of methods of how to divide the EEG dataset into training and testing datasets. To reduce the bias of training and testing data, a 10-fold cross-valida- tion technique is used. 10-fold cross-validation is a method to improve over the holdout method. This tech- nique will be implemented during the training periods, for estimating how well the classification models that learn from the training data will operate on future data not seen during the testing period. Generally, with 10- fold cross-validation, the data set is divided into 10 sub- sets, and the holdout approach is re-iterated 10 times. Each time, one of the 10 subsets is utilized as the testing dataset and the other 9 subsets are put together for forming a training dataset. Then the average error across all 10 trials is calculated. According to [28], the result obtained from one 10-fold cross validation may not be dependable. In order to get low mean square error and bias, the 10-fold cross-validation procedure is performed 10 times. All the simulation results were averaged over ten repetitions of 10-fold cross validation. 4.3. Experiment Results and Discussion Although the pattern length parameter m, the threshold r and the number of sampling points of the time series data play an important role in determining the outcome of SampEn, there are no guidelines to set the values of these parameters. In essence, the accuracy and confi- dence of the entropy estimate improve when the number of matches of length m and m + 1 increases. The number of matches can be increased by choosing small m and large r. However, if r is too large, some fluctuations of the signal are not detected, and if r is too small, noise has effect on the SampEn measure [29]. In this study, Sam- pEn values are calculated for selected combinations of m, r, and N. The values of m, r, and N that are employed in the experiments are described as follows: 1) m = 1, 2, 3; 2) r = 10%-50% of standard deviation of the EEG data sequence in increases of 10%; 3) N = 256, 512, 1024, 2048, 4096. Values of SampEn are calculated for all normal (healthy segments), interictal (seizure free epileptogenic zone segments) and ictal (epileptic seizure segments) EEG signals, and are fed to two classification models. Using rectangular-window with different sizes, data frames with different sizes (256, 512, 1024, 2048, 4096) are formed and the values of SampEn are computed for each data frame. Figure 5 demonstrates the sample plots of the SampEn having clear distinction among normal, interictal and ictal EEG signals. The values of Samp En demonstrated in Figure 5(a) and Figure 5(b) are com- puted with N = 2048 and 1024, respectively. From Fig- ure 5, one can see that the value of SampEn is small for ictal EEG signals (between 0.5 and 1.5) compared to normal EEG signals (larger than 1.5). The value of SampEn of interictal EEG signals (less than 0.5) is smaller than that of ictal EEG signals. Figure 6 demon- strates the sample plots of the values of SampEn accord- ing to N = 1024 and 512 which have a partial overlap among normal, interictal and ictal EEG signals. From these figures, we find that the capability of the SampEn for classifying normal, interictal and ictal EEG signals totally depends on the parameter values of m, r, and N. From these figures, it can be noted that utilizing a simple linear discriminator may not achieve good results since SampEn demonstrates clear distinction among the normal, interictal and ictal EEG signals only for several particular parameter combinations of m, r and N. For example, a simple linear discriminator would be ineffi- cient for the SampEn values, as demonstrated in Figure 6, because a clear partial overlapping among the normal, interictal and ictal EEG signals can be seen. Figures 7-12 demonstrate the whole classification ac- curacy achieved by neural network and extreme learning machine by employing SampEn as the input feature. It can be observed from Figures 7-12 that BPNN shows good average accuracy in the range of 94.25%- 95.33%, only for several combinations of m, r, and N (for example, m = 2, r = 0.3*Std, N = 2048; m = 3, r = 0.1*Std, N = 1024 and m = 2, r = 0.2*Std, N = 2048). The BPNN achieves the best average accuracy of 95.33% with m = 2, r = 0.2*standard deviation of the time series and N = 2048. For ELM, high average classi- fication accuracy in the range of 94.97%-95.67% are obtained for some combinations of m, r, and N (for ex- ample, m = 2, r = 0.1*Std, N = 1024; m = 2, r = 0.2*Std, N = 2048 and m = 3, r = 0.1*Std, N = 1024). The ELM obtains the best average accuracy of 95.67% with m = 3, = 0.1*standard deviation of the time series and N = r 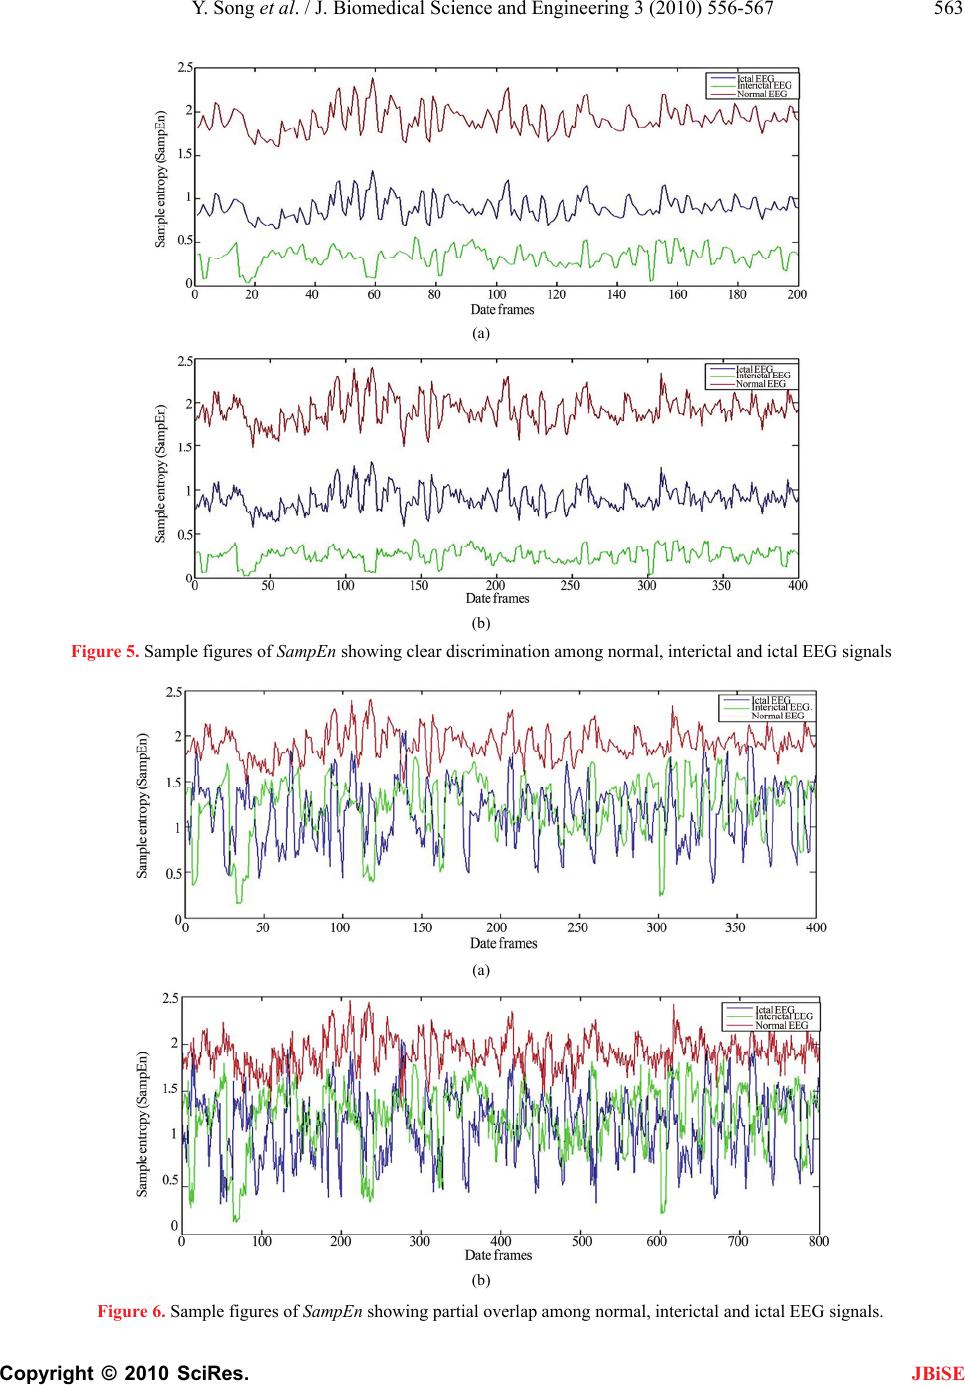 Y. Song et al. / J. Biomedical Science and Engineering 3 (2010) 556-567 563 Copyright © 2010 SciRes. (a) (b) Figure 5. Sample figures of SampEn showing clear discrimination among normal, interictal and ictal EEG signals (a) (b) Figure 6. Sample figures of SampEn showing partial overlap among normal, interictal and ictal EEG signals. JBiSE 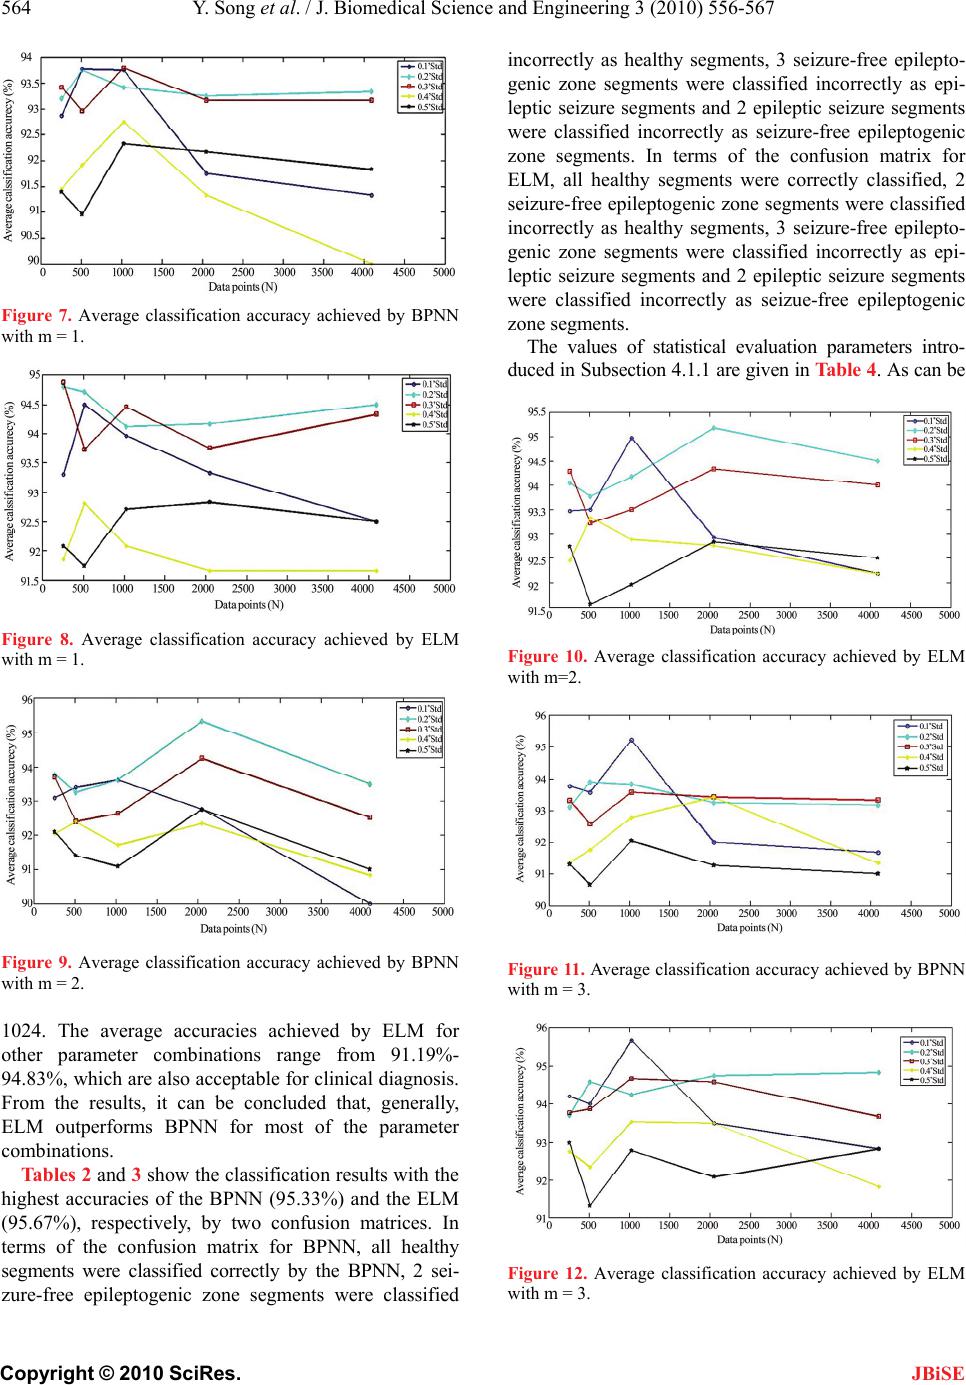 564 Y. Song et al. / J. Biomedical Science and Engineering 3 (2010) 556-567 Copyright © 2010 SciRes. JBiSE Figure 7. Average classification accuracy achieved by BPNN with m = 1. Figure 8. Average classification accuracy achieved by ELM with m = 1. Figure 9. Average classification accuracy achieved by BPNN with m = 2. 1024. The average accuracies achieved by ELM for other parameter combinations range from 91.19%- 94.83%, which are also acceptable for clinical diagnosis. From the results, it can be concluded that, generally, ELM outperforms BPNN for most of the parameter combinations. Tables 2 and 3 show the classification results with the highest accuracies of the BPNN (95.33%) and the ELM (95.67%), respectively, by two confusion matrices. In terms of the confusion matrix for BPNN, all healthy segments were classified correctly by the BPNN, 2 sei- zure-free epileptogenic zone segments were classified incorrectly as healthy segments, 3 seizure-free epilepto- genic zone segments were classified incorrectly as epi- leptic seizure segments and 2 epileptic seizure segments were classified incorrectly as seizure-free epileptogenic zone segments. In terms of the confusion matrix for ELM, all healthy segments were correctly classified, 2 seizure-free epileptogenic zone segments were classified incorrectly as healthy segments, 3 seizure-free epilepto- genic zone segments were classified incorrectly as epi- leptic seizure segments and 2 epileptic seizure segments were classified incorrectly as seizue-free epileptogenic zone segments. The values of statistical evaluation parameters intro- duced in Subsection 4.1.1 are given in Table 4. As can be Figure 10. Average classification accuracy achieved by ELM with m=2. Figure 11. Average classification accuracy achieved by BPNN with m = 3. Figure 12. Average classification accuracy achieved by ELM with m = 3. 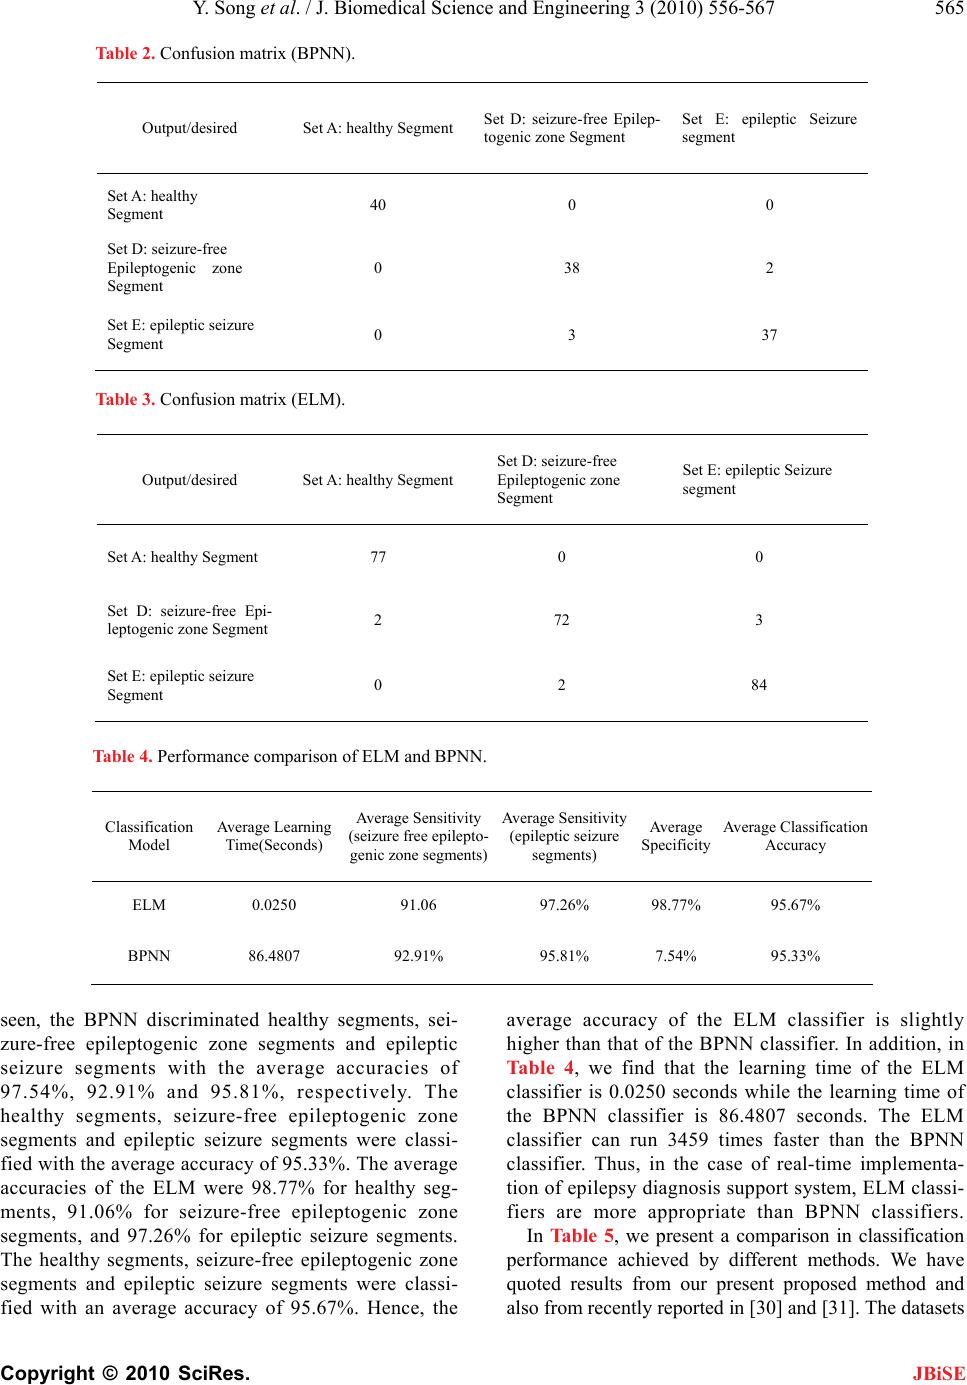 Y. Song et al. / J. Biomedical Science and Engineering 3 (2010) 556-567 565 Copyright © 2010 SciRes. JBiSE Table 2. Confusion matrix (BPNN). Output/desired Set A: healthy Segment Set D: seizure-free Epilep- togenic zone Segment Set E: epileptic Seizure segment Set A: healthy Segment 40 0 0 Set D: seizure-free Epileptogenic zone Segment 0 38 2 Set E: epileptic seizure Segment 0 3 37 Table 3. Confusion matrix (ELM). Output/desired Set A: healthy Segment Set D: seizure-free Epileptogenic zone Segment Set E: epileptic Seizure segment Set A: healthy Segment 77 0 0 Set D: seizure-free Epi- leptogenic zone Segment 2 72 3 Set E: epileptic seizure Segment 0 2 84 Table 4. Performance comparison of ELM and BPNN. Classification Model Average Learning Time(Seconds) Average Sensitivity (seizure free epilepto- genic zone segments) Average Sensitivity (epileptic seizure segments) Average Specificity Average Classification Accuracy ELM 0.0250 91.06 97.26% 98.77% 95.67% BPNN 86.4807 92.91% 95.81% 7.54% 95.33% seen, the BPNN discriminated healthy segments, sei- zure-free epileptogenic zone segments and epileptic seizure segments with the average accuracies of 97.54%, 92.91% and 95.81%, respectively. The healthy segments, seizure-free epileptogenic zone segments and epileptic seizure segments were classi- fied with the average accuracy of 95.33%. The average accuracies of the ELM were 98.77% for healthy seg- ments, 91.06% for seizure-free epileptogenic zone segments, and 97.26% for epileptic seizure segments. The healthy segments, seizure-free epileptogenic zone segments and epileptic seizure segments were classi- fied with an average accuracy of 95.67%. Hence, the average accuracy of the ELM classifier is slightly higher than that of the BPNN classifier. In addition, in Table 4, we find that the learning time of the ELM classifier is 0.0250 seconds while the learning time of the BPNN classifier is 86.4807 seconds. The ELM classifier can run 3459 times faster than the BPNN classifier. Thus, in the case of real-time implementa- tion of epilepsy diagnosis support system, ELM classi- fiers are more appropriate than BPNN classifiers. In Table 5, we present a comparison in classification performance achieved by different methods. We have quoted results from our present proposed method and also from recently reported in [30] and [31]. The datasets 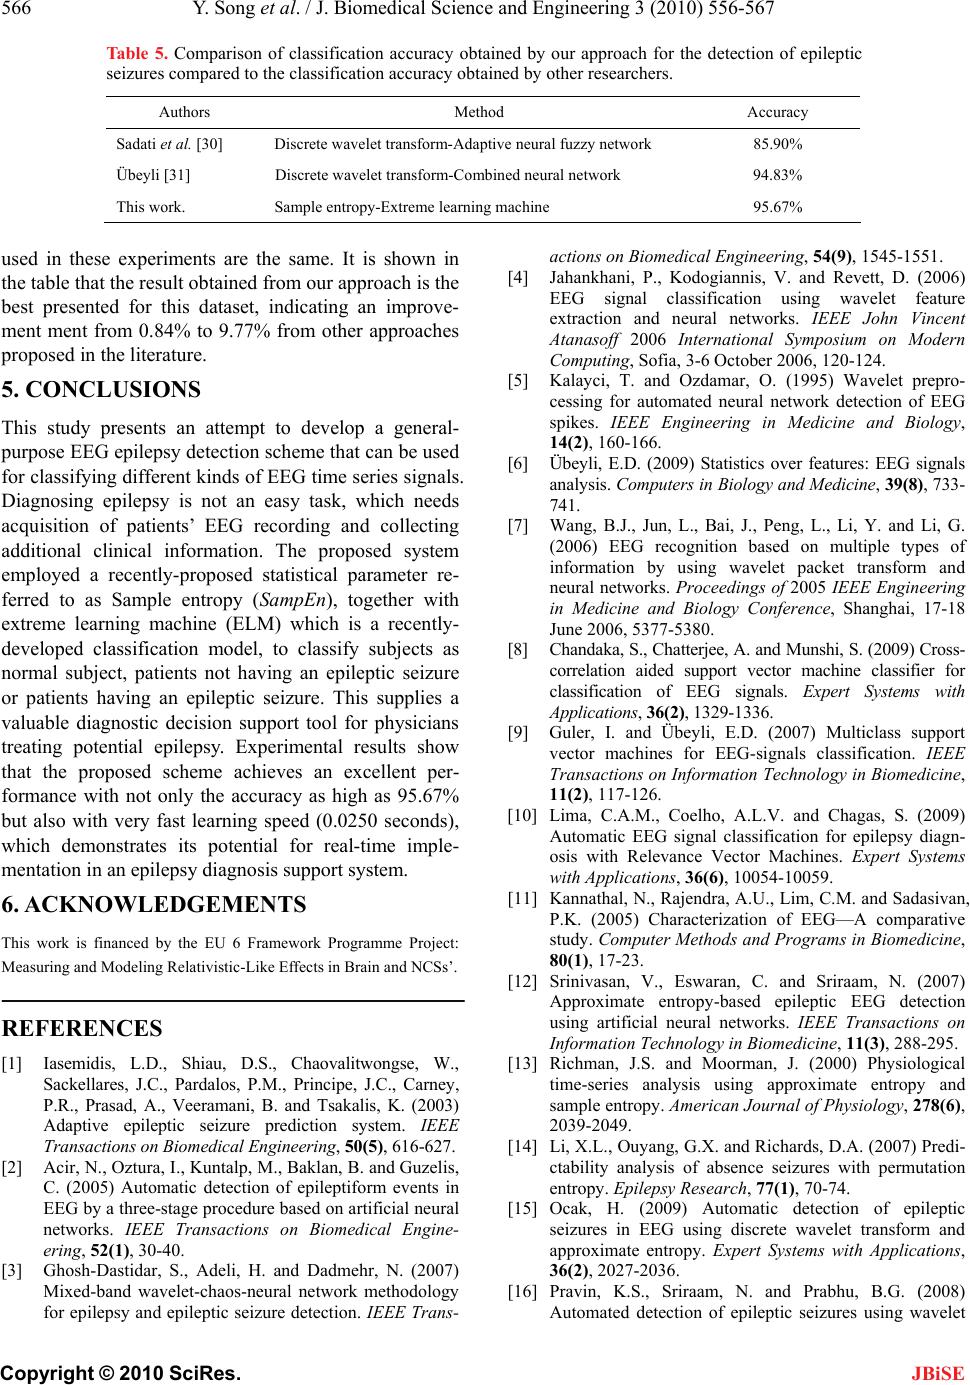 566 Y. Song et al. / J. Biomedical Science and Engineering 3 (2010) 556-567 Copyright © 2010 SciRes. JBiSE Table 5. Comparison of classification accuracy obtained by our approach for the detection of epileptic seizures compared to the classification accuracy obtained by other researchers. Authors Method Accuracy Sadati et al. [30] Discrete wavelet transform-Adaptive neural fuzzy network 85.90% Übeyli [31] Discrete wavelet transform-Combined neural network 94.83% This work. Sample entropy-Extreme learning machine 95.67% used in these experiments are the same. It is shown in the table that the result obtained from our approach is the best presented for this dataset, indicating an improve- ment ment from 0.84% to 9.77% from other approaches proposed in the literature. 5. CONCLUSIONS This study presents an attempt to develop a general- purpose EEG epilepsy detection scheme that can be used for classifying different kinds of EEG time series signals. Diagnosing epilepsy is not an easy task, which needs acquisition of patients’ EEG recording and collecting additional clinical information. The proposed system employed a recently-proposed statistical parameter re- ferred to as Sample entropy (SampEn), together with extreme learning machine (ELM) which is a recently- developed classification model, to classify subjects as normal subject, patients not having an epileptic seizure or patients having an epileptic seizure. This supplies a valuable diagnostic decision support tool for physicians treating potential epilepsy. Experimental results show that the proposed scheme achieves an excellent per- formance with not only the accuracy as high as 95.67% but also with very fast learning speed (0.0250 seconds), which demonstrates its potential for real-time imple- mentation in an epilepsy diagnosis support system. 6. ACKNOWLEDGEMENTS This work is financed by the EU 6 Framework Programme Project: Measuring and Modeling Relativistic-Like Effects in Brain and NCSs’. REFERENCES [1] Iasemidis, L.D., Shiau, D.S., Chaovalitwongse, W., Sackellares, J.C., Pardalos, P.M., Principe, J.C., Carney, P.R., Prasad, A., Veeramani, B. and Tsakalis, K. (2003) Adaptive epileptic seizure prediction system. IEEE Transactions on Biomedical Engineering, 50(5), 616-627. [2] Acir, N., Oztura, I., Kuntalp, M., Baklan, B. and Guzelis, C. (2005) Automatic detection of epileptiform events in EEG by a three-stage procedure based on artificial neural networks. IEEE Transactions on Biomedical Engine- ering, 52(1), 30-40. [3] Ghosh-Dastidar, S., Adeli, H. and Dadmehr, N. (2007) Mixed-band wavelet-chaos-neural network methodology for epilepsy and epileptic seizure detection. IEEE Trans- actions on Biomedical Engineering, 54(9), 1545-1551. [4] Jahankhani, P., Kodogiannis, V. and Revett, D. (2006) EEG signal classification using wavelet feature extraction and neural networks. IEEE John Vincent Atanasoff 2006 International Symposium on Modern Computing, Sofia, 3-6 October 2006, 120-124. [5] Kalayci, T. and Ozdamar, O. (1995) Wavelet prepro- cessing for automated neural network detection of EEG spikes. IEEE Engineering in Medicine and Biology, 14(2), 160-166. [6] Übeyli, E.D. (2009) Statistics over features: EEG signals analysis. Computers in Biology and Medicine, 39(8), 733- 741. [7] Wang, B.J., Jun, L., Bai, J., Peng, L., Li, Y. and Li, G. (2006) EEG recognition based on multiple types of information by using wavelet packet transform and neural networks. Proceedings of 2005 IEEE Engineering in Medicine and Biology Conference, Shanghai, 17-18 June 2006, 5377-5380. [8] Chandaka, S., Chatterjee, A. and Munshi, S. (2009) Cross- correlation aided support vector machine classifier for classification of EEG signals. Expert Systems with Applications, 36(2), 1329-1336. [9] Guler, I. and Übeyli, E.D. (2007) Multiclass support vector machines for EEG-signals classification. IEEE Transactions on Information Technology in Biomedicine, 11(2), 117-126. [10] Lima, C.A.M., Coelho, A.L.V. and Chagas, S. (2009) Automatic EEG signal classification for epilepsy diagn- osis with Relevance Vector Machines. Expert Systems with Applications, 36(6), 10054-10059. [11] Kannathal, N., Rajendra, A.U., Lim, C.M. and Sadasivan, P.K. (2005) Characterization of EEG—A comparative study. Computer Methods and Programs in Biomedicine, 80(1), 17-23. [12] Srinivasan, V., Eswaran, C. and Sriraam, N. (2007) Approximate entropy-based epileptic EEG detection using artificial neural networks. IEEE Transactions on Information Technology in Biomedicine, 11(3), 288-295. [13] Richman, J.S. and Moorman, J. (2000) Physiological time-series analysis using approximate entropy and sample entropy. American Journal of Physiology, 278(6), 2039-2049. [14] Li, X.L., Ouyang, G.X. and Richards, D.A. (2007) Predi- ctability analysis of absence seizures with permutation entropy. Epilepsy Research, 77(1), 70-74. [15] Ocak, H. (2009) Automatic detection of epileptic seizures in EEG using discrete wavelet transform and approximate entropy. Expert Systems with Applications, 36(2), 2027-2036. [16] Pravin, K.S., Sriraam, N. and Prabhu, B.G. (2008) Automated detection of epileptic seizures using wavelet 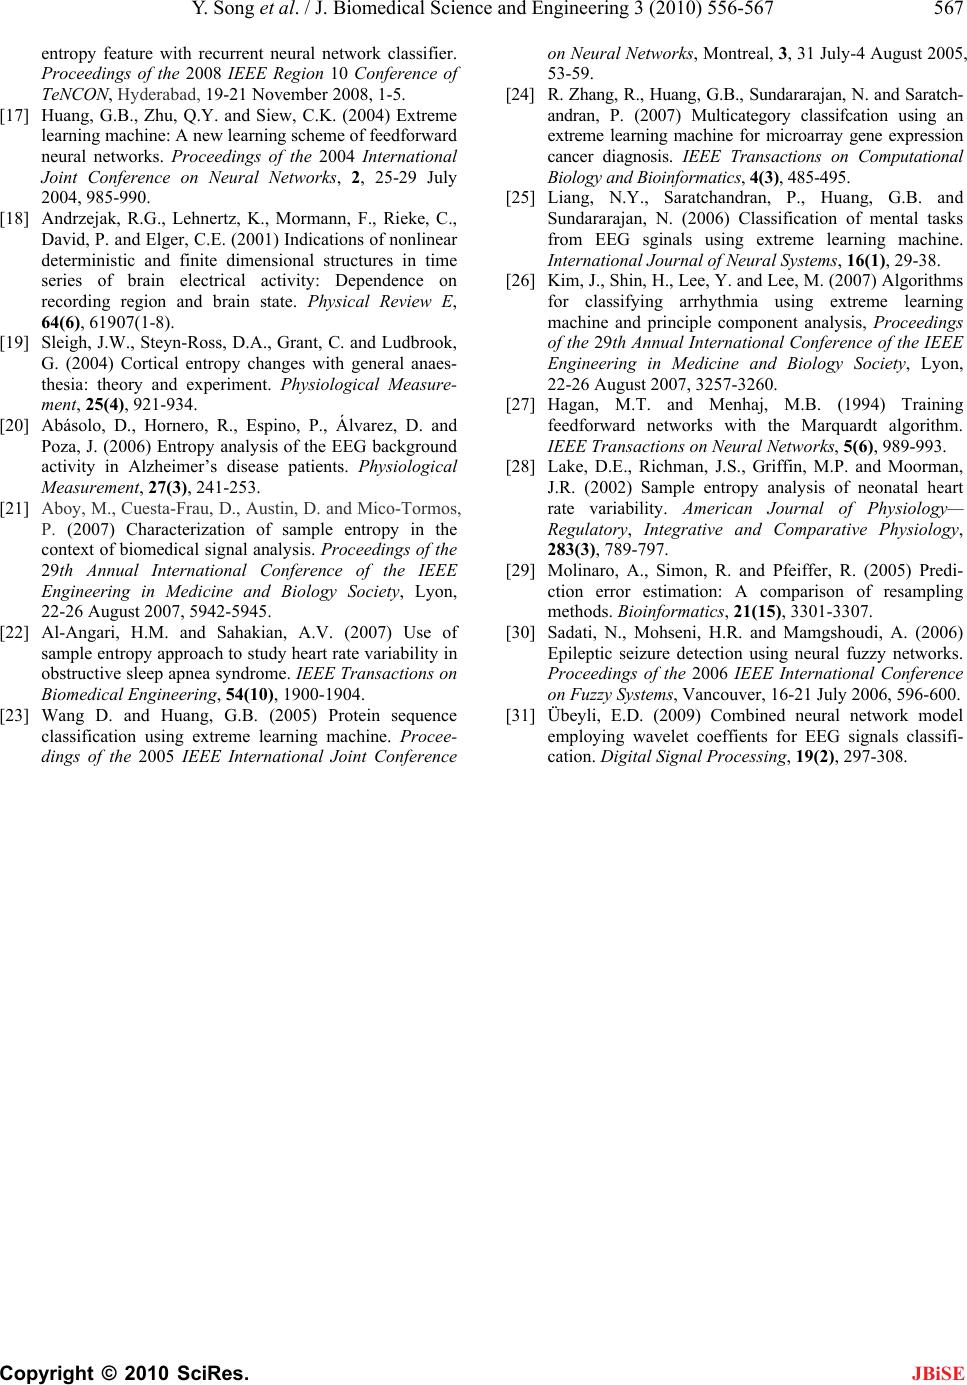 Y. Song et al. / J. Biomedical Science and Engineering 3 (2010) 556-567 567 Copyright © 2010 SciRes. JBiSE entropy feature with recurrent neural network classifier. Proceedings of the 2008 IEEE Region 10 Conference of TeNCON, Hyderabad, 19-21 November 2008, 1-5. [17] Huang, G.B., Zhu, Q.Y. and Siew, C.K. (2004) Extreme learning machine: A new learning scheme of feedforward neural networks. Proceedings of the 2004 International Joint Conference on Neural Networks, 2, 25-29 July 2004, 985-990. [18] Andrzejak, R.G., Lehnertz, K., Mormann, F., Rieke, C., David, P. and Elger, C.E. (2001) Indications of nonlinear deterministic and finite dimensional structures in time series of brain electrical activity: Dependence on recording region and brain state. Physical Review E, 64(6), 61907(1-8). [19] Sleigh, J.W., Steyn-Ross, D.A., Grant, C. and Ludbrook, G. (2004) Cortical entropy changes with general anaes- thesia: theory and experiment. Physiological Measure- ment, 25(4), 921-934. [20] Abásolo, D., Hornero, R., Espino, P., Álvarez, D. and Poza, J. (2006) Entropy analysis of the EEG background activity in Alzheimer’s disease patients. Physiological Measurement, 27(3), 241-253. [21] Aboy, M., Cuesta-Frau, D., Austin, D. and Mico-Tormos, P. (2007) Characterization of sample entropy in the context of biomedical signal analysis. Proceedings of the 29th Annual International Conference of the IEEE Engineering in Medicine and Biology Society, Lyon, 22-26 August 2007, 5942-5945. [22] Al-Angari, H.M. and Sahakian, A.V. (2007) Use of sample entropy approach to study heart rate variability in obstructive sleep apnea syndrome. IEEE Transactions on Biomedical Engineering, 54(10), 1900-1904. [23] Wang D. and Huang, G.B. (2005) Protein sequence classification using extreme learning machine. Procee- dings of the 2005 IEEE International Joint Conference on Neural Networks, Montreal, 3, 31 July-4 August 2005, 53-59. [24] R. Zhang, R., Huang, G.B., Sundararajan, N. and Saratch- andran, P. (2007) Multicategory classifcation using an extreme learning machine for microarray gene expression cancer diagnosis. IEEE Transactions on Computational Biology and Bioinformatics, 4(3), 485-495. [25] Liang, N.Y., Saratchandran, P., Huang, G.B. and Sundararajan, N. (2006) Classification of mental tasks from EEG sginals using extreme learning machine. International Journal of Neural Systems, 16(1), 29-38. [26] Kim, J., Shin, H., Lee, Y. and Lee, M. (2007) Algorithms for classifying arrhythmia using extreme learning machine and principle component analysis, Proceedings of the 29th Annual International Conference of the IEEE Engineering in Medicine and Biology Society, Lyon, 22-26 August 2007, 3257-3260. [27] Hagan, M.T. and Menhaj, M.B. (1994) Training feedforward networks with the Marquardt algorithm. IEEE Transactions on Neural Networks, 5(6), 989-993. [28] Lake, D.E., Richman, J.S., Griffin, M.P. and Moorman, J.R. (2002) Sample entropy analysis of neonatal heart rate variability. American Journal of Physiology— Regulatory, Integrative and Comparative Physiology, 283(3), 789-797. [29] Molinaro, A., Simon, R. and Pfeiffer, R. (2005) Predi- ction error estimation: A comparison of resampling methods. Bioinformatics, 21(15), 3301-3307. [30] Sadati, N., Mohseni, H.R. and Mamgshoudi, A. (2006) Epileptic seizure detection using neural fuzzy networks. Proceedings of the 2006 IEEE International Conference on Fuzzy Systems, Vancouver, 16-21 July 2006, 596-600. [31] Übeyli, E.D. (2009) Combined neural network model employing wavelet coeffients for EEG signals classifi- cation. Digital Signal Processing, 19(2), 297-308.
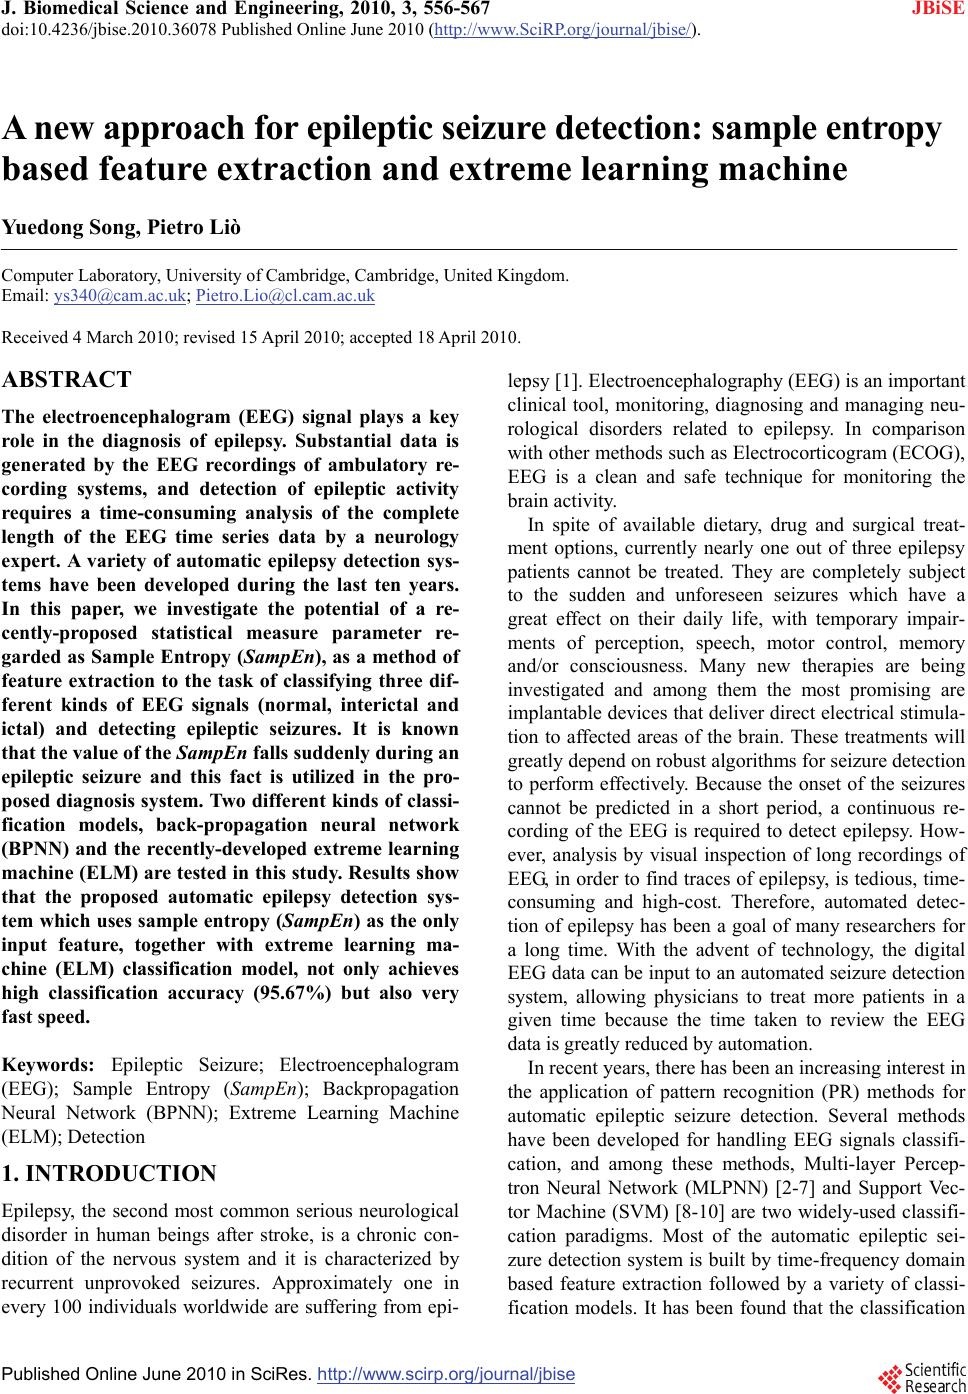
|