 Journal of Water Resource and Protection, 2012, 4, 545-559 http://dx.doi.org/10.4236/jwarp.2012.47064 Published Online July 2012 (http://www.SciRP.org/journal/jwarp) Hydro-Geoelectrical Investigation for the Potential of Underground Water Storage along the Lower Reaches of King Abdullah Canal—Deir Alla Area/Jordan Hani Al-Amoush1*, Elias Salameh2, Marwan Al-Raggad2 1Al Al-Bayt University, Mafraq, Jordan 2Jordan University, Amman, Jordan Email: *hani1@aabu.edu.jo Received March 12, 2012; revised April 14, 2012; accepted May 19, 2012 ABSTRACT In this article the potential stoarativity of groundwater in the alluvial deposits along the King Abdullah Canal (KAC) in Deir Alla-Sulikhat area is studied. In this study geological, geo-electrical and Hydro-geochemical methods were used with the aim of storing some water of the Canal during water excess times in the underground to be extracted for use as drinking source for human during shortages in the Canal water and in emergency causes of Canal water pollution. The results show the existence of appropriate underground space in the alluvial deposits for water storage and that the water/ water and water/rock interactions are also be minimal and will not present and detriment to the different groundwater bodies. Implementing groundwater artificial recharge in the Jordan Valley area to create storage for King Abdullah Ca- nal (KAC) water will enhance the drinking water supply during the dry season and it will also serve as a reserve for emergency causes, especially pollution accidents in King Abdullah Canal (KAC), such as those taking place almost every year. Keywords: Jordan Valley; Geo-Electrical; King Abdullah Canal (KAC) 1. Introduction According to preliminary investigations rechargeable aquifers are found in the Jordan Valley (JV) area [1,2]. Such aquifers can accommodate several millions of cubic meters of recharge water and serve as storage reservoir. Worldwide, surface waters are contaminated or are ex- posed to contamination by human actions and natural cir- cumstances. Surface waters in semiarid areas should, in general not be directly channeled into treatments plants for use in drinking purposes, but are first stored in un- derground reservoirs, after that they are extracted for treatment and use in drinking purposes [3]. King Abdul- lah Canal (KAC) (The East Ghor Canal) (Figure 1) and its irrigation network is considered the most important water project in Jordan, it is a concrete lined gravity ca- nal 110 km long fed by 1 km diversion tunnel running underneath the mountain between Yarmouk River and the village of Adassiya. KAC transfers water from the Yarmouk River to the south at the shores of the Dead Sea and Irrigates 230.000 dunum (23,000 hectare) [4]. The water sources of the KAC are from Yarmouk River, at the international Jordan border with Syria, Mukheiba wells, the peace conveyer water from Israel, and the southern tributaries which flow within Jordanian territo- ries [3]. Presently, 60 to 70 million cubic meters per year (MCM/Y) of water are pumped from the KAC to Am- man with the provision for treatment at Zai plant, located between Deir Alla, the water intake site and Amman (Figure 1) [3]. During the last 24 years of the operation of Deir Alla-Zai water supply scheme water pumped from King Abdullah Canal (KAC) have suffered of dif- ferent water pollution problems, which in 1987 and 1998 affected human health with rigorous consequences for the water supply scheme from KAC and for the different water agencies such as the Water Authority of Jordan and the Jordan Valley Authority. Since 1998 several water pollution events affected KAC water and catastrophes were only averted in last moments. In many years since its operation the KAC was not able to supply the neces- sary water amounts due to decreased flow, especially during the summer months when drinking water is badly needed. The risks of contamination and drought are still present and can at any time negatively affect the water supply of Amman and the other cities, which partly de- pend on Deir Alla-Zai scheme for their drinking water, although the Ministry of Water and Irrigation has in- stalled early warning systems on the KAC to warn against pollution. In general, storing surface water un- *Corresponding author. C opyright © 2012 SciRes. JWARP 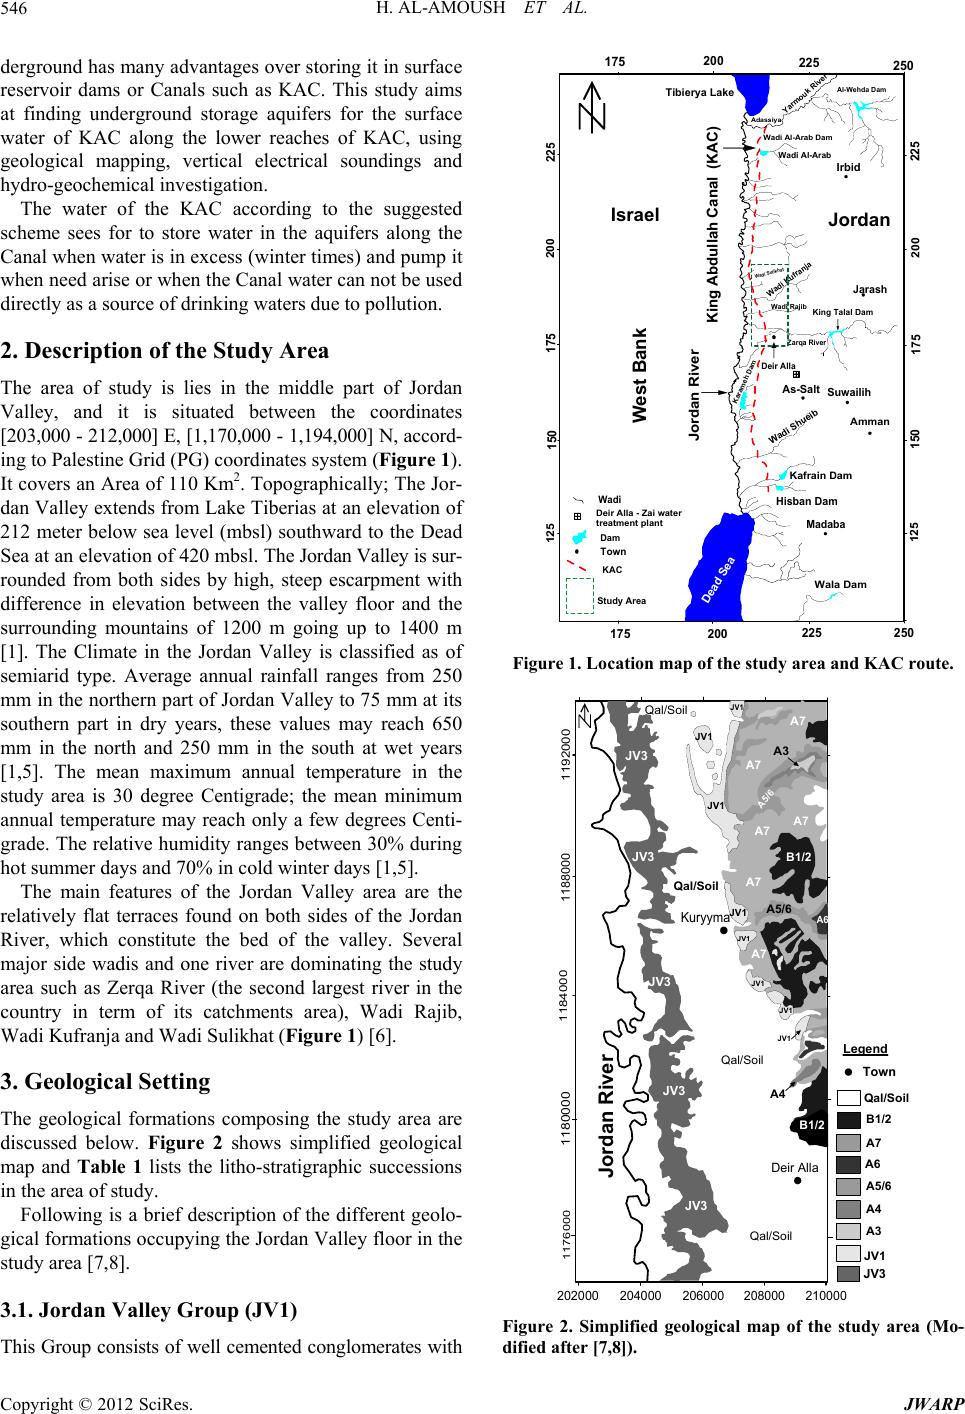 H. AL-AMOUSH ET AL. 546 derground has many advantages over storing it in surface reservoir dams or Canals such as KAC. This study aims at finding underground storage aquifers for the surface water of KAC along the lower reaches of KAC, using geological mapping, vertical electrical soundings and hydro-geochemical investigation. The water of the KAC according to the suggested scheme sees for to store water in the aquifers along the Canal when water is in excess (winter times) and pump it when need arise or when the Canal water can not be used directly as a source of drinking waters due to pollution. 2. Description of the Study Area The area of study is lies in the middle part of Jordan Valley, and it is situated between the coordinates [203,000 - 212,000] E, [1,170,000 - 1,194,000] N, accord- ing to Palestine Grid (PG) coordinates system (Figure 1). It covers an Area of 110 Km2. Topographically; The Jor- dan Valley extends from Lake Tiberias at an elevation of 212 meter below sea level (mbsl) southward to the Dead Sea at an elevation of 420 mbsl. The Jordan Valley is sur- rounded from both sides by high, steep escarpment with difference in elevation between the valley floor and the surrounding mountains of 1200 m going up to 1400 m [1]. The Climate in the Jordan Valley is classified as of semiarid type. Average annual rainfall ranges from 250 mm in the northern part of Jordan Valley to 75 mm at its southern part in dry years, these values may reach 650 mm in the north and 250 mm in the south at wet years [1,5]. The mean maximum annual temperature in the study area is 30 degree Centigrade; the mean minimum annual temperature may reach only a few degrees Centi- grade. The relative humidity ranges between 30% during hot summer days and 70% in cold winter days [1,5]. The main features of the Jordan Valley area are the relatively flat terraces found on both sides of the Jordan River, which constitute the bed of the valley. Several major side wadis and one river are dominating the study area such as Zerqa River (the second largest river in the country in term of its catchments area), Wadi Rajib, Wadi Kufranja and Wadi Sulikhat (Figure 1) [6]. 3. Geological Setting The geological formations composing the study area are discussed below. Figure 2 shows simplified geological map and Table 1 lists the litho-stratigraphic successions in the area of study. Following is a brief description of the different geolo- gical formations occupying the Jordan Valley floor in the study area [7,8]. 3.1. Jordan Valley Group (JV1) This Group consists of well cemented conglomerates with Yarmouk River Al-Wehda Dam Adassiya Wadi Al-Arab Dam Wadi Kufranja Wadi Rajib Zarqa River King Talal D am As-Salt Wadi Shueib Kafrain Dam Wala Dam Amman Suwailih Hisban Dam Madaba Irbid Jarash Wadi Al-Arab Jordan River King Abdullah Canal (KAC) Dead Sea 175 17 200 225 250 150 175 200 225 225 200 175 150 125 125 Town KAC Tibierya Lake Dam 20 225 250 Study Area Deir Alla Deir Alla - Zai water treatment plant Jordan West Bank Israel Wadi Sulikhat Karameh Dam Wadi Figure 1. Location map of the study area and KAC route. 202000 204000 206000 208000 210000 1184000 1188000 1192000 1180000 1176000 JV3 JV1 A3 A4 A5/6 A6 A7 B1/2 Qal/Soil Deir Alla JV3 JV3 JV3 B1/2 B1/2 A7 A7 Qal/Soil Qal/Soil Qal/Soil A7 JV1 A5/6 JV1 JV1 JV3 JV3 A3 A4 JV1 A7 A7 A7 Jordan River Legend Kuryyma Town JV1 JV1 A5/6 A6 JV1 Qal/Soil JV1 Figure 2. Simplified geological map of the study area (Mo- dified after [7,8]). Copyright © 2012 SciRes. JWARP 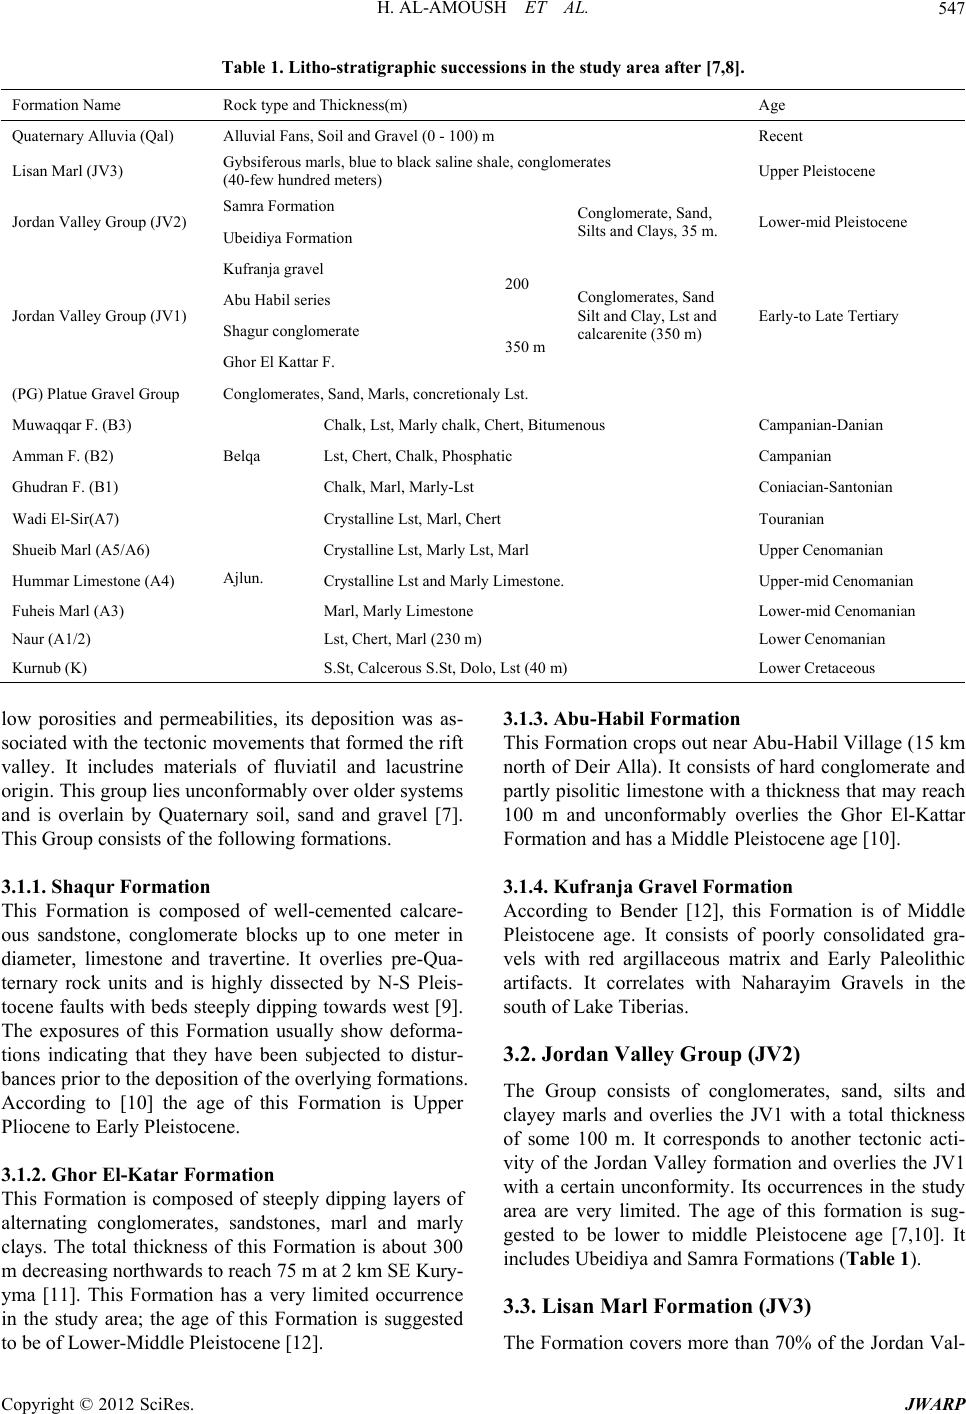 H. AL-AMOUSH ET AL. Copyright © 2012 SciRes. JWARP 547 Table 1. Litho-stratigraphic successions in the study area after [7,8]. Formation Name Rock type and Thickness(m) Age Quaternary Alluvia (Qal) Alluvial Fans, Soil and Gravel (0 - 100) m Recent Lisan Marl (JV3) Gybsiferous marls, blue to black saline shale, conglomerates (40-few hundred meters) Upper Pleistocene Samra Formation Jordan Valley Group (JV2) Ubeidiya Formation Conglomerate, Sand, Silts and Clays, 35 m. Lower-mid Pleistocene Kufranja gravel Abu Habil series 200 Shagur conglomerate Jordan Valley Group (JV1) Ghor El Kattar F. 350 m Conglomerates, Sand Silt and Clay, Lst and calcarenite (350 m) Early-to Late Tertiary (PG) Platue Gravel Group Conglomerates, Sand, Marls, concretionaly Lst. Muwaqqar F. (B3) Chalk, Lst, Marly chalk, Chert, Bitumenous Campanian-Danian Amman F. (B2) Lst, Chert, Chalk, Phosphatic Campanian Ghudran F. (B1) Belqa Chalk, Marl, Marly-Lst Coniacian-Santonian Wadi El-Sir(A7) Crystalline Lst, Marl, Chert Touranian Shueib Marl (A5/A6) Crystalline Lst, Marly Lst, Marl Upper Cenomanian Hummar Limestone (A4) Crystalline Lst and Marly Limestone. Upper-mid Cenomanian Fuheis Marl (A3) Marl, Marly Limestone Lower-mid Cenomanian Naur (A1/2) Ajlun. Lst, Chert, Marl (230 m) Lower Cenomanian Kurnub (K) S.St, Calcerous S.St, Dolo, Lst (40 m) Lower Cretaceous low porosities and permeabilities, its deposition was as- sociated with the tectonic movements that formed the rift valley. It includes materials of fluviatil and lacustrine origin. This group lies unconformably over older systems and is overlain by Quaternary soil, sand and gravel [7]. This Group consists of the following formations. 3.1.1. Shaqur Formation This Formation is composed of well-cemented calcare- ous sandstone, conglomerate blocks up to one meter in diameter, limestone and travertine. It overlies pre-Qua- ternary rock units and is highly dissected by N-S Pleis- tocene faults with beds steeply dipping towards west [9]. The exposures of this Formation usually show deforma- tions indicating that they have been subjected to distur- bances prior to the deposition of the overlying formations. According to [10] the age of this Formation is Upper Pliocene to Early Pleistocene. 3.1.2. Ghor El-Katar Formation This Formation is composed of steeply dipping layers of alternating conglomerates, sandstones, marl and marly clays. The total thickness of this Formation is about 300 m decreasing northwards to reach 75 m at 2 km SE Kury- yma [11]. This Formation has a very limited occurrence in the study area; the age of this Formation is suggested to be of Lower-Middle Pleistocene [12]. 3.1.3. Abu-Habil Formation This Formation crops out near Abu-Habil Village (15 km north of Deir Alla). It consists of hard conglomerate and partly pisolitic limestone with a thickness that may reach 100 m and unconformably overlies the Ghor El-Kattar Formation and has a Middle Pleistocene age [10]. 3.1.4. Kufranja Gravel Formation According to Bender [12], this Formation is of Middle Pleistocene age. It consists of poorly consolidated gra- vels with red argillaceous matrix and Early Paleolithic artifacts. It correlates with Naharayim Gravels in the south of Lake Tiberias. 3.2. Jordan Valley Group (JV2) The Group consists of conglomerates, sand, silts and clayey marls and overlies the JV1 with a total thickness of some 100 m. It corresponds to another tectonic acti- vity of the Jordan Valley formation and overlies the JV1 with a certain unconformity. Its occurrences in the study area are very limited. The age of this formation is sug- gested to be lower to middle Pleistocene age [7,10]. It includes Ubeidiya and Samra Formations (Table 1). 3.3. Lisan Marl Formation (JV3) The Formation covers more than 70% of the Jordan Val-  H. AL-AMOUSH ET AL. 548 ley area. The thickness of this Formation is about 300 m and it belongs to Early to Late Pleistocene [10]. The up- per part is called Lisan Marl facies and consists of alter- nating fine to medium particles of marl and clay with friable chalk, silt and gypsum [10]. The lower part is composed of dark gray and greenish marls with few sand layers [10]. It occurs mainly on the Jordan River mean- dering plain and in the underground of alluvial covered flood plain. Within the Formation, in its eastern part many gravel and sand beds occurs representing deltaic or alluvial fans deposits interfingering with the Lisan For- mation. 3.4. Quaternary Alluvium (Qal) and Alluvial Fans These refer to unconsolidated colluvials developed along the course of the major wadis. They usually overlie the Lisan Formation (JV3) and are composed of lenticular beds of gravels, sands and calcareous clay. They are de- rived from older formations exposed in the adjacent catchment areas. The gravels are usually composed of limestone, dolomites, chert, basalts boulders and pebbles with a matrix of sand, silt and clay [10]. The gravel beds are usually very pervious, the calcareous clays and clay beds are fairly impervious, the gravel beds are more abundant near the side wadis of the foothills, while the silt and sands occur more abundantly at the fringes of the fans towards the Jordan River course. The groundwater occurring in the alluvial fans of the major side wadis accounts for more than 80% of the available fresh groundwater in the Jordan Valley [6]. The thickness of alluvial fans as encountered by drilling and geo-electric sounding may exceed 100 m [2]. 4. Hydrogeology The study area is composed—in terms of hydro-geolo- gical aspects—of four different aquifers systems these include: Zerqa Group aquifer (Z), Kurnub sandstone aq- uifer (K), Upper Aquifer Complex (A1-A6 and A7/B2), and Jordan Valley (JV1) Group. Table 2 lists these aqui- fers systems along with their hydro-geologic classifica- tion. Jordan Valley Group Aquifer (Shallow Groundwater Aquifer) The Jordan Valley Group thickly fills the rift valley and forms the wide valley floor. This group can be divided into three main units, which are from older to younger: consolidated/cemented conglomerate layers of about 100 m in thickness, conglomerates and alternating marl, sand, gravel layers of about 350 m in thickness and alternating marl, clay, chalk, silt and gypsum layer of about 300 m in thickness (Lisan Formation, JV3) [13]. The aquifer in the Jordan Valley is formed by the middle unit which is intercalated with sand and gravel layer (Sand/Gravel Aq- uifer). The Specific Capacity of Sand/Gravel Aquifer in the southern part of the Jordan Valley ranges from 100 to 300 m2/day in average [13]. The upper zone represents the shallow aquifer which extends along the Jordan Valley floor and consists of alluvial fans and other recent sediments. The recent sedi- ments inter-finger with the salty, clayey deposits of the ancestors of the Dead Sea, like Lisan Lake which, tens of thousands years ago extended northward beyond the present shores of Lake Tiberias [12]. This shallow aqui- fer has a good potential with rather good water quality. However, it deteriorates towards the west due to the pre- sence of Lisan beds responsible for an increase of the salinity of about 1500 to 2500 μS/cm, the permeability of the shallow aquifer ranges between 6.5 × 10e–4 to 1.3 × 10e–2 m/s with an average value of 6.6 × 10e–3 m/s [13]. 5. Data Acquisition, Processing and Interpretation 121 Vertical Electrical Resistivity Soundings were con- ducted in the area of study along N-S profiles (Figure 3(a) and Figure 3(b)), using an ABEM CAMPUS GEO- PULSE Ltd. resistivity meter. It is a digital signal en- hancement device incorporating a micro-processor that gives the resistance reading in Ω, mΩ or μΩ and capable Table 2. Simplified hydro-geological classification of the rock units [13]. Geological formation Regional hydro-geological classification Hydro-geological classificationLithology (rock type) Saturated thickness (m) Mio-Pliocene Quaternary Jordan Valley Aquifer Aquifer/Aquiclude Sand/L.St. Conglom. 10 - 400 Rijam (B4) Aquifer L.St/Chert 15 -> 100 Muwaqqar (B3) Aquiclude Marl 50 - 400 Amman-Sir (A7-B2) Aquifer L.St./Chert 50 -> 350 Hummar (A4) Aquifer Dolo, L.St 40 - 45 Ajlun (A1-A6) Upper Aquifer Complex Upper Cretaceous Aquifer Aquifer L.St/Shale/Marl 200 - 600 Kurnub (K) Aquifer S.St/siltstone 50 - 300 Zarqa (Z) Lower Aquifer Complex Aquifer Marl Dolo, L.St, S.St 50 - 600 Copyright © 2012 SciRes. JWARP 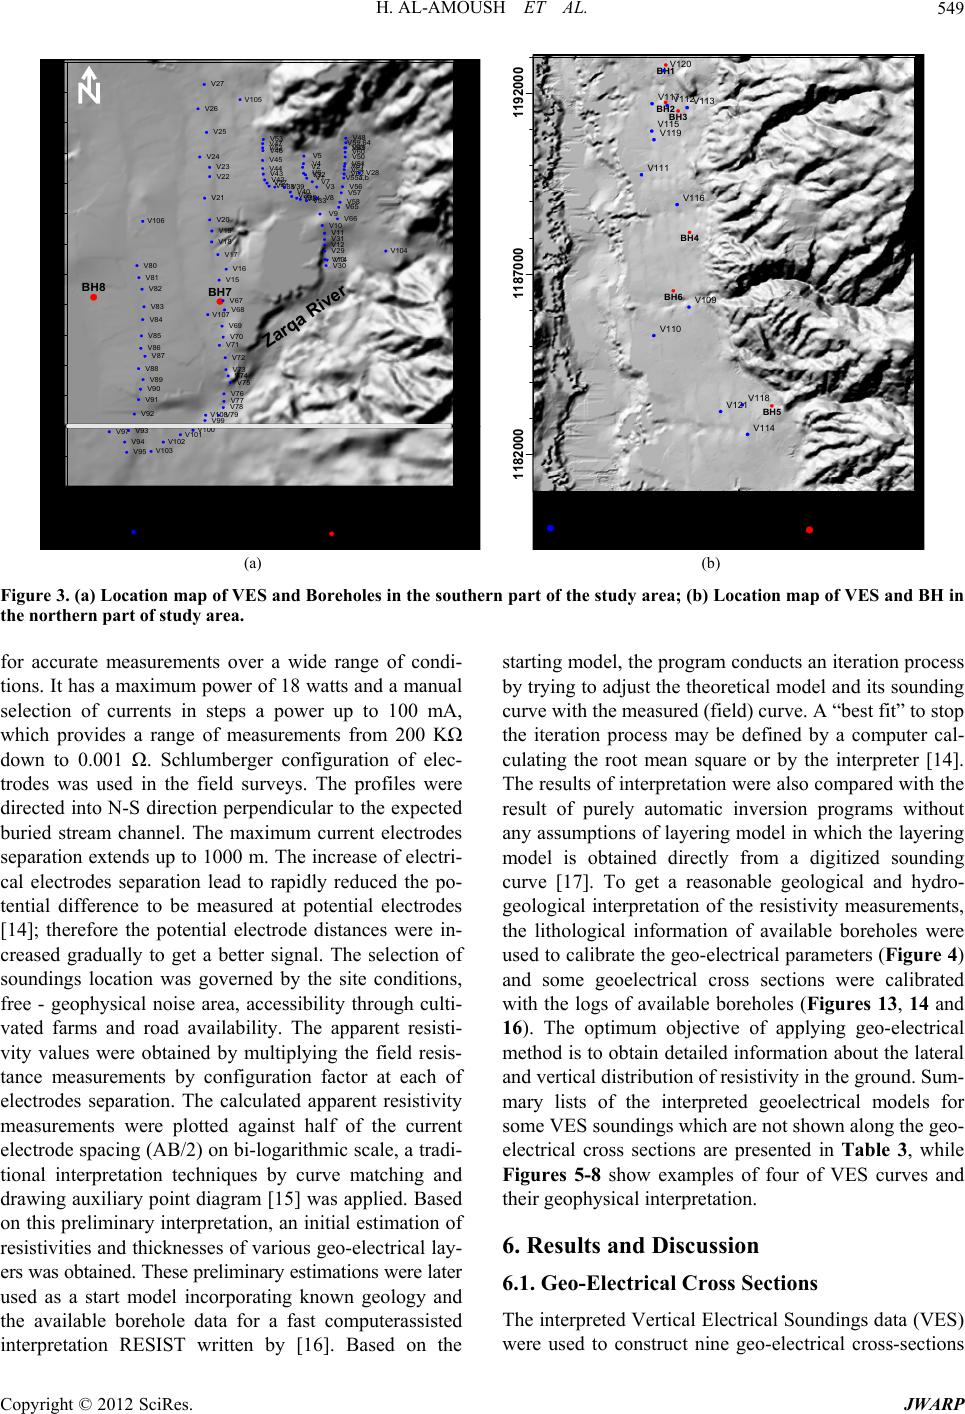 H. AL-AMOUSH ET AL. 549 206000 209000 212000 1175000 1177000 1179000 BH1 V120 BH7 BH8 V97 V95 V94 V93 V92 V91 V90 V89 V88 V87 V86 V85 V84 V83 V82 V81 V80 V79 V78 V77 V76 V75 V74 V73 V72 V71 V70 V69 V68 V67 V15 V16 V17 V18 V19 V20 V21 V22 V23 V24 V25 V26 V27 V53 V47 V52 V46 V45 V44 V43 V42 V37 V41 V38 V39 V40 V36 V35 V34 V33 V5 V4 V2 V32 V1 V7 V3 V8 V9 V10 V11 V31 V12 V29 V13 V30 V14 V48 V59,64 V49 V60 V50 V63 V51 V61 V54 V62 V55a,b V56 V57 V58 V65 V66 V99 V100 V101 V102 V103 V6 V28 V104 V105 V106 V107 V108 Vertical Electrical Sounding (VES) Bore Hole (BH) Zarqa River 1182000 1187000 1192000 204000 207000210000 BH2 V112 V117 V113 BH3 V115 V119 V111 V116 BH4 BH6 V109 V110 V118 V121 BH5 V114 Vertical Electrical Soundings (VES) Bore Hole (a) (b) Figure 3. (a) Location map of VES and Boreholes in the southern part of the study area; (b) Location map of VES and BH in the northern part of study area. for accurate measurements over a wide range of condi- tions. It has a maximum power of 18 watts and a manual selection of currents in steps a power up to 100 mA, which provides a range of measurements from 200 KΩ down to 0.001 Ω. Schlumberger configuration of elec- trodes was used in the field surveys. The profiles were directed into N-S direction perpendicular to the expected buried stream channel. The maximum current electrodes separation extends up to 1000 m. The increase of electri- cal electrodes separation lead to rapidly reduced the po- tential difference to be measured at potential electrodes [14]; therefore the potential electrode distances were in- creased gradually to get a better signal. The selection of soundings location was governed by the site conditions, free - geophysical noise area, accessibility through culti- vated farms and road availability. The apparent resisti- vity values were obtained by multiplying the field resis- tance measurements by configuration factor at each of electrodes separation. The calculated apparent resistivity measurements were plotted against half of the current electrode spacing (AB/2) on bi-logarithmic scale, a tradi- tional interpretation techniques by curve matching and drawing auxiliary point diagram [15] was applied. Based on this preliminary interpretation, an initial estimation of resistivities and thicknesses of various geo-electrical lay- ers was obtained. These preliminary estimations were later used as a start model incorporating known geology and the available borehole data for a fast computerassisted interpretation RESIST written by [16]. Based on the starting model, the program conducts an iteration process by trying to adjust the theoretical model and its sounding curve with the measured (field) curve. A “best fit” to stop the iteration process may be defined by a computer cal- culating the root mean square or by the interpreter [14]. The results of interpretation were also compared with the result of purely automatic inversion programs without any assumptions of layering model in which the layering model is obtained directly from a digitized sounding curve [17]. To get a reasonable geological and hydro- geological interpretation of the resistivity measurements, the lithological information of available boreholes were used to calibrate the geo-electrical parameters (Figure 4) and some geoelectrical cross sections were calibrated with the logs of available boreholes (Figures 13, 14 and 16). The optimum objective of applying geo-electrical method is to obtain detailed information about the lateral and vertical distribution of resistivity in the ground. Sum- mary lists of the interpreted geoelectrical models for some VES soundings which are not shown along the geo- electrical cross sections are presented in Table 3, while Figures 5-8 show examples of four of VES curves and their geophysical interpretation. 6. Results and Discussion 6.1. Geo-Electrical Cross Sections The interpreted Vertical Electrical Soundings data (VES) were used to construct nine geo-electrical cross-sections Copyright © 2012 SciRes. JWARP  H. AL-AMOUSH ET AL. 550 Table 3. Summary list of some interpreted geoelectrical soundings that are not shown along the geoelectrical cross sections (resistivity (ρ) in Ω.m and thickness (h) in meter (m)). VES ρ1 ρ2 ρ3 ρ4 ρ5 ρ6 h1 h2 h3 h4 h5 28 5 35 5 35 - - 1 8 33 - - 46 10 20 8 25 15 - 3 6 13 44 - 63 250 85 15 - - - 3 4 - - - 97 10 8 35 3 10 1 2 4 4 41 22 99 15 65 15 - - - 3 18 - - - 100 15 80 6 40 - - 4 16 9 - - 101 20 8 60 90 35 7 2 2 16 5 25 102 22 90 38 7 - - 2 8 20 - - 103 22 90 38 7 - - 2 8 20 - - 104 12 5 40 7 - - 1 16 60 - - 105 100 40 8 70 9 - 2 16 21 62 - 107 34 7 50 4 - - 2 26 36 - - 109 65 100 60 - - - 3 115 - - - 110 11 64 20 47 3 - 3 9 27 50 - 111 25 11 15 7 2 - 3 6 87 42 - 114 500 142 65 5 - - 5 41 48 - - 115 34 48 5 15 4 - 1 3 21 70 - 116 120 63 90 35 16 10 3 12 12 36 32 120 285 70 150 63 14 9 4 15 23 32 78 121 19 12 8 12 28 6 2 2 4 3 90 V107 -265 5 - 5 -27 - - - - - - - - -255 -245 -285 -295 -305 Marl Sand & Gravel Sand & Clay Sand &Gravel Marl & Clay -31 -325 Elevation (masl) .m 7 .m 50 .m 4 .m 35 - -235 BH8 BH West Marl Gravel & Sand Marl 1750m 280m Figure 4. Correlation of the interpreted resistivity sounding V107 with bore hole data of BH7 and BH8 (for location of boreholes and V107, see Figure 1). across the study area. Their locations and extensions are presented in Figure 9 and the constructed geo-electrical cross-sections in Figures 10-18. A detailed inspection of the geo-electrical cross-sections along with the calibra- tion of VES results and borehole data indicates the pres- ence of different predominant lithofacies in the study area, those are: The top soil layer (wide resistivity range 20 - 200 Ohm.m layer); clay, marl, clay with saline water (resistivity ≤ 10 Ohm.m); sand with silt (10 - 20 Ohm.m); sand and gravel; saturated alluvium (20 - 60 Ohm.m); and unconsolidated deposits, gravel, dry sand where re- sistivity is larger than 60 Ohm.m. Top Soil layer: In the study area, different types of soils have been developed throughout the geological history. Generally, these types reflect the composition and types of the parent rocks over which these soil types have developed. According to the National Soil Mapping Project [18] the soil types dominant in the study area are: Type-1: Randzina and Lithosol with their parent rocks of carbonate. They are shallow, up to 1m in depth, and cover the most eastern part of the study area. The VES’s encountered along geoelectri- cal cross-section (A-A’; B-B’ Figure 10 and Figure 11 respectively) were performed in area where Randzina and lithosol soil prevail with the results that the top soil of 1 - 3 m have high resistivity. Type-2: Soil developed on loss-like sediment; these soils are silty and Loamy with moderate humus in addition to granular and friable gravel [18]. This type of soil oc- cupies the most western part of the study area. The VES’s encountered along the geo-electrical cross- sections: (E-E’; F-F’ and G-G’, Figure 14, Figure 15 and Figure 18 respectively). They showed relatively moderate resistivity of 15 - 30 Ohm.m for the top Copyright © 2012 SciRes. JWARP 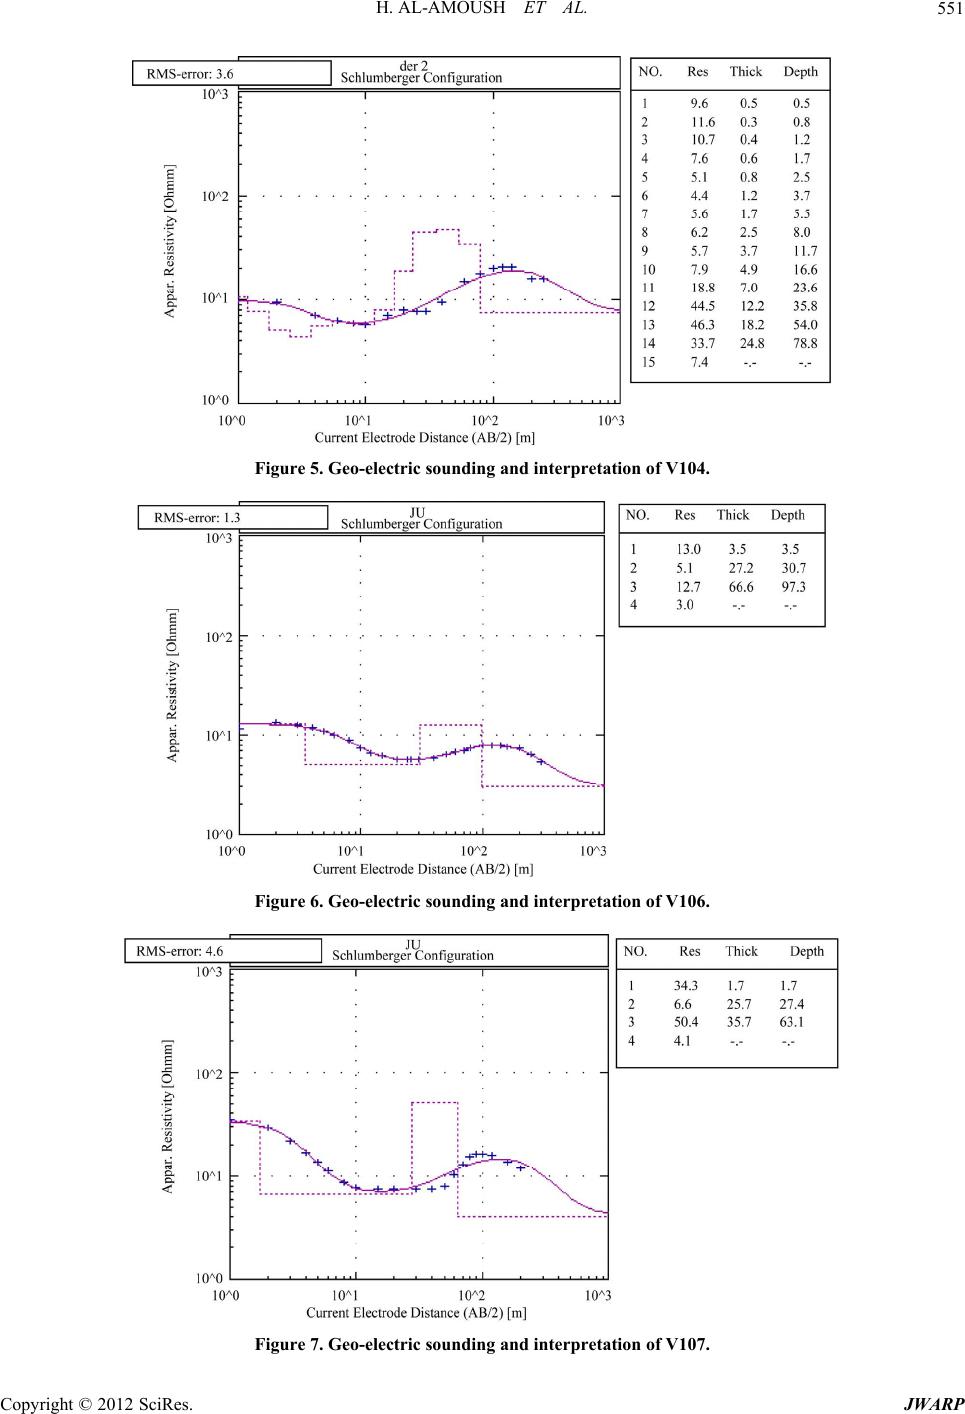 H. AL-AMOUSH ET AL. 551 Figure 5. Geo-electric sounding and interpretation of V104. Figure 6. Geo-electric sounding and interpretation of V106. Figure 7. Geo-electric sounding and interpretation of V107. Copyright © 2012 SciRes. JWARP 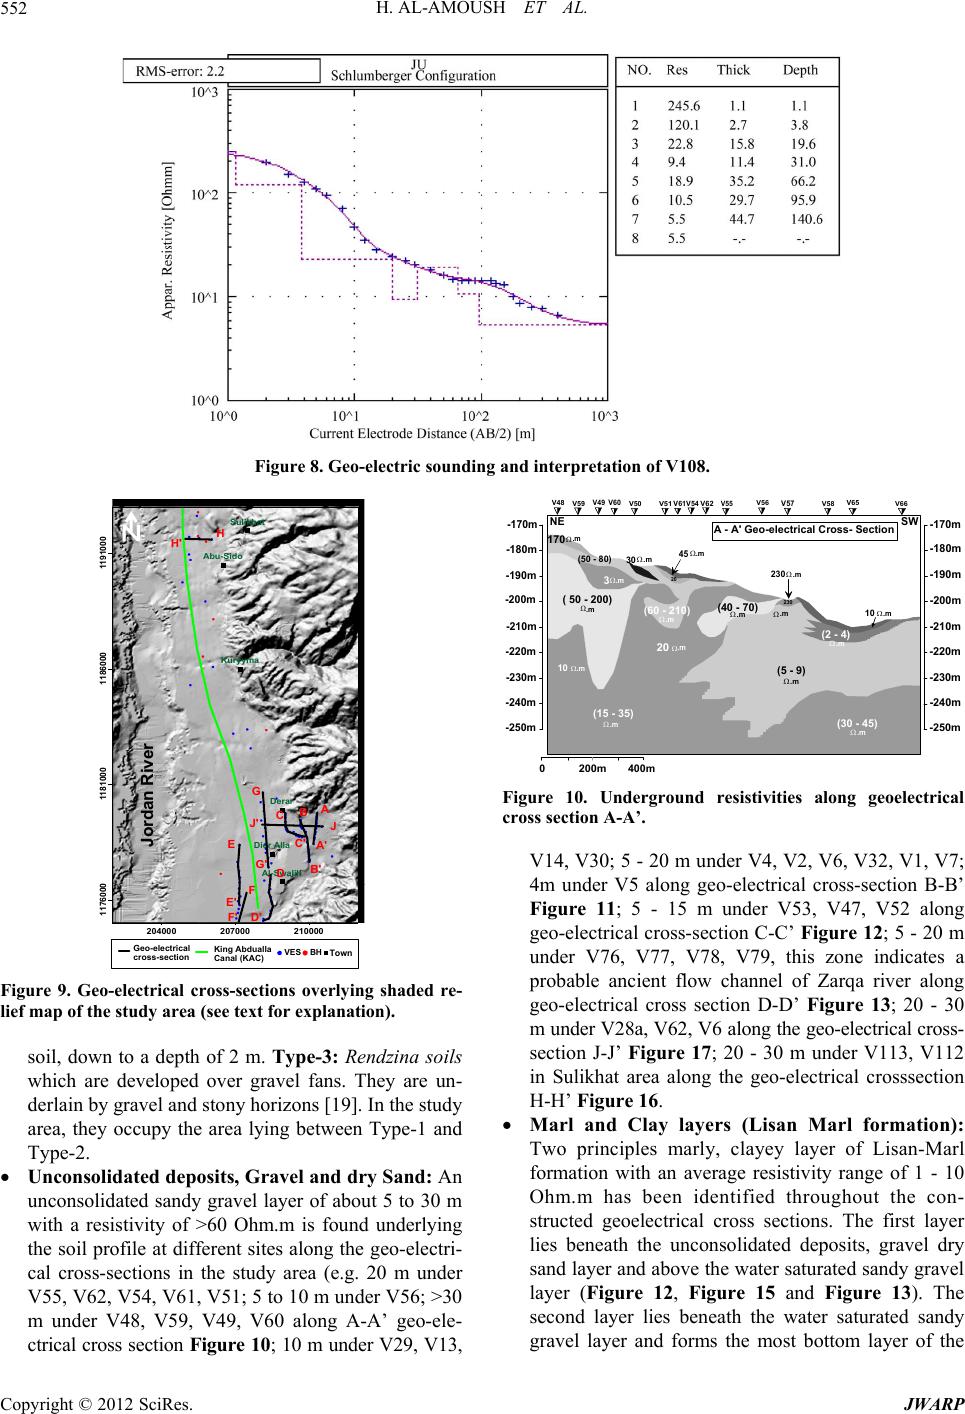 H. AL-AMOUSH ET AL. 552 Figure 8. Geo-electric sounding and interpretation of V108. 204000 207000210000 1176000 1181000 1186000 1191000 Al-Swa lih Dier Alla Derar Sulikhat Abu-Sido Kuryyma A A' B B' C C' D D' E E' F F' G G' H H' J J' Jordan River Geo-electrical cross-section King Abdualla Canal (KAC) VES BH Town Figure 9. Geo-electrical cross-sections overlying shaded re- lief map of the study area (see text for explanation). soil, down to a depth of 2 m. Type-3: Rendzina soils which are developed over gravel fans. They are un- derlain by gravel and stony horizons [19]. In the study area, they occupy the area lying between Type-1 and Type-2. Unconsolidated deposits, Gravel and dry Sand: An unconsolidated sandy gravel layer of about 5 to 30 m with a resistivity of >60 Ohm.m is found underlying the soil profile at different sites along the geo-electri- cal cross-sections in the study area (e.g. 20 m under V55, V62, V54, V61, V51; 5 to 10 m under V56; >30 m under V48, V59, V49, V60 along A-A’ geo-ele- ctrical cross section Figure 10; 10 m under V29, V13, -190m -200m -210m -220m -230m -240m -250m 200m 400m0 NE SW -180m -170m -190m -200m -210m -220m -230m -240m -250m -180m -170m V48 V59 10 V49 60 V50 V51 45 20 V61 20 V54 V55 V56 V57 230 V58 V65 10 V66 V62 .m (15 - 35) 20 (5 - 9) (30 - 45) ( 50 - 200) 3 (50 - 80) 170 30 (60 - 210)(40 - 70) (2 - 4) .m .m .m .m .m .m .m .m .m .m .m 230 .m .m .m .m A - A' Geo-electrical Cross- Section Figure 10. Underground resistivities along geoelectrical cross section A-A’. V14, V30; 5 - 20 m under V4, V2, V6, V32, V1, V7; 4m under V5 along geo-electrical cross-section B-B’ Figure 11; 5 - 15 m under V53, V47, V52 along geo-electrical cross-section C-C’ Figure 12; 5 - 20 m under V76, V77, V78, V79, this zone indicates a probable ancient flow channel of Zarqa river along geo-electrical cross section D-D’ Figure 13; 20 - 30 m under V28a, V62, V6 along the geo-electrical cross- section J-J’ Figure 17; 20 - 30 m under V113, V112 in Sulikhat area along the geo-electrical crosssection H-H’ Figure 16. Marl and Clay layers (Lisan Marl formation): Two principles marly, clayey layer of Lisan-Marl formation with an average resistivity range of 1 - 10 Ohm.m has been identified throughout the con- structed geoelectrical cross sections. The first layer lies beneath the unconsolidated deposits, gravel dry sand layer and above the water saturated sandy gravel layer (Figure 12, Figure 15 and Figure 13). The second layer lies beneath the water saturated sandy gravel layer and forms the most bottom layer of the Copyright © 2012 SciRes. JWARP  H. AL-AMOUSH ET AL. 553 -230m -240m -250m -260m -270m -280m -290m 200m 400 0 North South -220m -210m -200m -190m V5 50 150 20 100 10 V4 60 20 70 20 10 110 V2 75 15 70 20 45 7 V6 35 20 55 V32 80 25 70 15 60 20 V1 30 70 35 10 60 10 V7 35 70 25 10 35 8 V3 25 75 20 10 35 6 V8 65 10 70 6 V9 10 5 30 V10 5 10 45 V11 35 5 35 V31 5 30 6 30 V12 5 10 30 V29 10 85 10 30 -230m -240m -250m -260m -270m -280m -290m V13 30 600 30 15 V30 260 50 20 >50 10 V14 -220m -210m -200m -190m .m .m .m .m .m .m .m .m .m .m .m .m .m .m .m .m .m .m .m .m .m .m .m .m .m .m .m .m .m .m .m .m .m .m .m .m .m .m .m .m .m .m .m .m .m .m .m .m .m .m .m .m .m .m .m .m .m .m .m .m (6 - 20) (35 - 100) (5 - 10) 20 (20 - 50) 200- 70 150 600 60 - 70 (25 - 65) 10 35 .m .m .m .m .m .m .m .m .m .m B - B' Geo-electrical Cross-Section 30 (10 - 15) .m .m .m .m Figure 11. Underground resistivities along geoelectrical cross section B-B’. -230m -240m -250m -260m -270m -280m -290m North South -220m -210m V53 40 V47 V52 V45 V44 V43 V42 V37 V41 V38 V39 V40 V36 V35V34 V33 -230m -240m -250m -260m -270m -280m -290m -220m -210m (15 - 40) (30 - 100) (20 - 40)(20 - 40) 7 50 (25 - 35) (3 - 9) (3 - 9) (25 - 80) (3 - 9) (20 - 80) (15 - 25) (4 - 7) (10 - 15) .m .m .m .m .m .m .m .m .m .m .m .m .m (15 - 25) C - C' Geo-elec trical Cross Sectio n .m .m Figure 12. Underground resistivities along geoelectrical cross section C-C’. -230m -240m -250m -260m -270m -280m -290m 200m 400m0 North V67 12 60 V68 15 9 70 V69 35 9 V70 10 V71 V72 20 V73 9 V74 10 20 V75 25 15 V76 30 110 V77 80 10 V7 South 8 20 140 15 V79 15 15 60 -300m -310m -320m -330m -230m -240m -250m -260m -270m -280m -290m .m .m .m .m .m .m .m .m .m .m .m .m .m .m .m .m .m Zarqa River .m .m .m .m .m (35 - 70)(10 - 20) (15 - 20) 7 75 (6 30 0 - 110) 9 (15 - 25) (3 - 7)(3 - 7) (10 - 15) .m .m .m .m (10 - .m .m .m .m (11 (3 - 7) .m .m 20) .m 0 - 225) .m .m BH7 Marl Gravel + Sand -300m -310m -320m -330m V108 D - D' Geo-electrical Cross Section Figure 13. Underground resistivities along geoelectrical cross section D-D’. whole Jordan Valley (Figure 11, Figure 14 and Fig- ure 15). Water Saturated Sandy Gravel layer: This layer forms the major water bearing layer in the Jordan Valley, which has been subjected to over-pumping of its groundwater sources during the past four decades [2]. The average resistivity ranges of this layer were found to be in the range (20 - 60 Ohm.m). It was as- signed based on a correlation of different lithological log data and geoelectrical measurements (Figure 4, Figure 13, Figure 14 and Figure 16). This layer was found along the all geoelectrical cross sections (e.g. 15 - 45 Ohm.m (Figure 10); 20 - 100 Ohm.m (Figure 11) and (Figure 12); 10 - 25 Ohm.m (Figure 18); 35 - 70 Ohm.m (Figure 13); 20 - 35 Ohm.m (Figure 14); 15 - 35 Ohm (Figure 15); 15 - 50 (Figure 17) and 13 - 17 Ohm.m (Figure 16). 6.2. Iso-Resistivity Contour Maps The apparent resistivity (ρa) at selected half electrode separations (AB/2 = 20 m and AB/2 = 60 m), measured Copyright © 2012 SciRes. JWARP 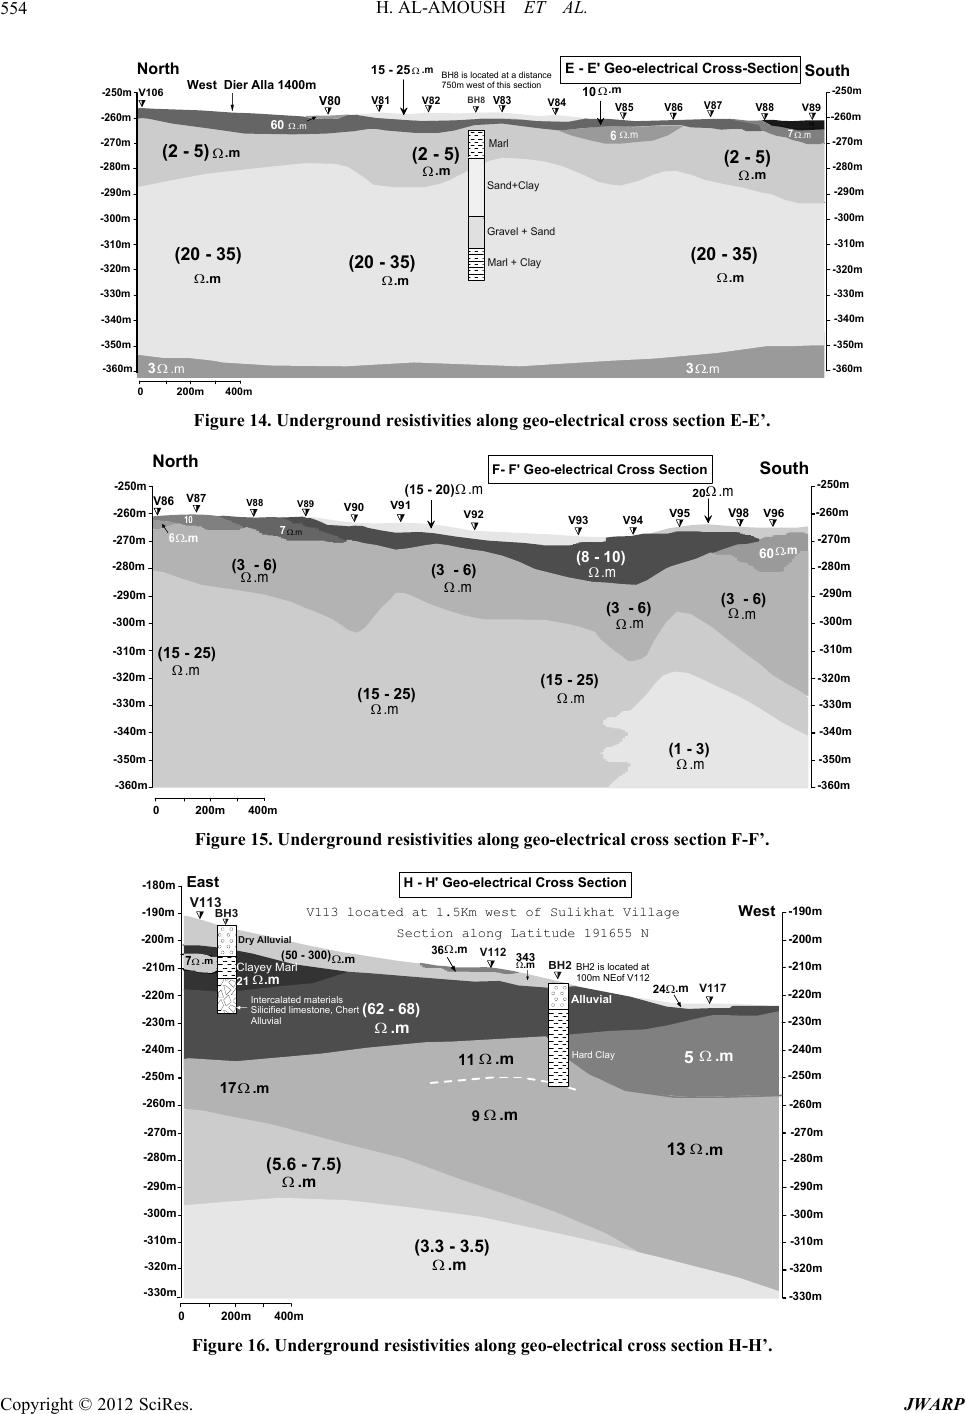 H. AL-AMOUSH ET AL. 554 -270m -280m -290m -300m -310m -320m -330m -270m -280m -290m -300m -310m -320m -330m 200m 400m0 North South -260m -250m V81 V85 V86 V87 -340m -350m -360m .m .m .m .m .m West Dier Alla 1400m .m -340m -350m -360m V88 V89 10 7 -260m -250m V106 3 V80 60 V82 V83 V84 15 - 25 6 (20 - 35) (2 - 5) (2 - 5) (2 - 5) (20 - 35) (20 - 35) .m .m 10 .m .m .m 3 .m .m BH8 BH8 is located at a distance 750m west of this section Marl Sand+Clay Gravel + Sand Marl + Clay E - E' Geo-electrical Cross-Section Figure 14. Underground resistivities along geo-electrical cross section E-E’. -270m -280m -290m -300m -310m -320m -330m 200m 400m0 North South -260m -250m -270m -280m -290m -300m -310m -320m -330m -260m -250m V86 V87 10 V88 V89 -340m -350m -360m .m V90 V91 (15 - 20) V92 V93 V94 V95 20 V9 6 7 8 V96 .m (1 - 3) .m (15 - 25) .m (3 - 6) .m (8 - 10) .m 60 .m (3 - 6) (3 (15 - 25) (15 - 25) .m .m .m .m (3 - 6) .m F- F' Geo-electrical Cross Section .m -340m -350m -360m - 6) .m Figure 15. Underground resistivities along geo-electrical cross section F-F’. -190m -200m -210m -220m -230m -240m -250m 200m 400m0 East West -180m -190m -200m -210m -220m -230m -240m -250m 17 V113 15-21 7 (62 - 68) 17 3.5 V112 36 343 11 9 V1 24 5 13 3.3 -260m -270m -280m -290m -300m -310m Section along Latitude 191655 N V113 located at 1.5Km west of Sulikhat Village .m .m .m .m .m .m .m .m (3.3 - 3.5) (5.6 - 7.5) .m .m .m .m .m .m 7 .m (50 - 300) -320m -330m -260m -270m -280m -290m -300m -310m -320m -330m .m Alluvial Hard Clay BH2 is located at 100m NEof V112 BH2 BH3 Dry Alluvial Clayey Marl .m Intercalated materia ls Silicified limestone, Chert Alluvial H - H' Geo-electrical Cross Section Figure 16. Underground resistivities along geo-electrical cross section H-H’. Copyright © 2012 SciRes. JWARP 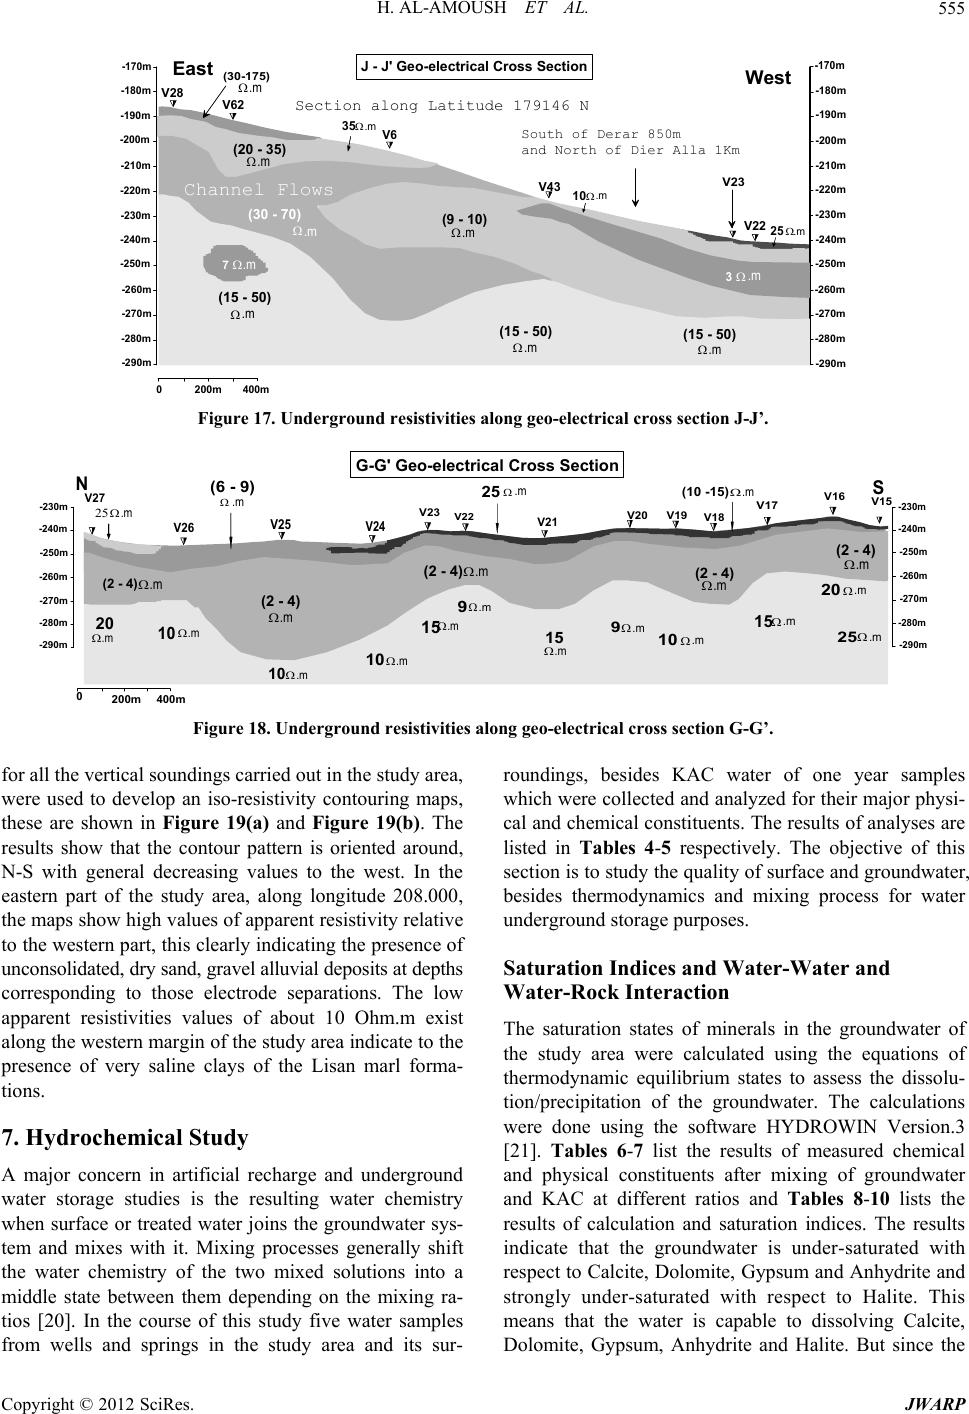 H. AL-AMOUSH ET AL. 555 -190m -200m -210m -220m -230m -240m -250m 200m 400m0 East West -180m -170m -190m -200m -210m -220m -230m -240m -250m -180m -170m V22 25 3 V28 V62 20 V6 35 20 V43 10 4 25 (30-175) 15 25 50 -260m -270m -280m -290m V2 15 3 .m .m .m .m .m .m .m .m .m South of Derar 850m and North of Dier Alla 1Km Section along Latitude 179146 N Channel Flows (15 - 50) (15 - 50) (15 - 50) 7 (30 - 70) (20 - 35) (9 - 10) .m .m .m .m .m .m 3 .m .m J - J' Geo-electrical Cross Section -260m -270m -280m -290m .m Figure 17. Underground resistivities along geo-electrical cross section J-J’. -230m -240m -250m -260m -270m -280m -290m V27 20 10 V23 15 10 V22 25 9 15 V20 9 V19 10 V18 V17 (10 -15) 15 10 200m 400m N .m .m .m .m .m .m V16 20 V15 25 -230m -240m -250m -260m -270m -280m -290m .m .m .m .m .m V26 V25 V24 V21 .m .m .m .m .m .m 0 .m .m (2 - 4) (2 - 4) (2 - 4) (2 - 4) .m .m .m .m G-G' Geo-electrical Cross Section (2 - 4) .m S (6 - 9) .m Figure 18. Underground resistivities along geo-electrical cross section G-G’. for all the vertical soundings carried out in the study area, were used to develop an iso-resistivity contouring maps, these are shown in Figure 19(a) and Figure 19(b). The results show that the contour pattern is oriented around, N-S with general decreasing values to the west. In the eastern part of the study area, along longitude 208.000, the maps show high values of apparent resistivity relative to the western part, this clearly indicating the presence of unconsolidated, dry sand, gravel alluvial deposits at depths corresponding to those electrode separations. The low apparent resistivities values of about 10 Ohm.m exist along the western margin of the study area indicate to the presence of very saline clays of the Lisan marl forma- tions. 7. Hydrochemical Study A major concern in artificial recharge and underground water storage studies is the resulting water chemistry when surface or treated water joins the groundwater sys- tem and mixes with it. Mixing processes generally shift the water chemistry of the two mixed solutions into a middle state between them depending on the mixing ra- tios [20]. In the course of this study five water samples from wells and springs in the study area and its sur- roundings, besides KAC water of one year samples which were collected and analyzed for their major physi- cal and chemical constituents. The results of analyses are listed in Tables 4-5 respectively. The objective of this section is to study the quality of surface and groundwater, besides thermodynamics and mixing process for water underground storage purposes. Saturation Indices and Water-Water and Water-Rock Interaction The saturation states of minerals in the groundwater of the study area were calculated using the equations of thermodynamic equilibrium states to assess the dissolu- tion/precipitation of the groundwater. The calculations were done using the software HYDROWIN Version.3 [21]. Tables 6-7 list the results of measured chemical and physical constituents after mixing of groundwater and KAC at different ratios and Tables 8-10 lists the results of calculation and saturation indices. The results indicate that the groundwater is under-saturated with respect to Calcite, Dolomite, Gypsum and Anhydrite and strongly under-saturated with respect to Halite. This means that the water is capable to dissolving Calcite, Dolomite, Gypsum, Anhydrite and Halite. But since the Copyright © 2012 SciRes. JWARP  H. AL-AMOUSH ET AL. 556 204000 207000 210000 213000 1176000 1181000 1186000 1191000 1176000 1181000 1186000 1191000 204000 207000 210000 213000 (a) (b) Figure 19. (a) Iso-Resistivity map (Ohm.m) overlying shaded relief map of the study area at electrode separation (AB/2 = 20 m); (b) Iso-Resistivity map (Ohm.m) overlying shaded relief map of the study area at electrode separation (AB/2 = 60 m). Table 4. Chemical composition of groundwater resources in the study area (meq/l). 4 SO 3 HCO 3 NO meq/l meq/l No Source (well ID) EC μS/cm T.D.S mg/l pH Ca2+ meq/l Mg2+ meq/l Na+ meq/l K+ meq/l Cl– meq/l meq/l 1 SULK n4 628 316.4 7.101.80 4.20 0.96 0.15 1.8 0.57 3.60 0.04 2 SULK n5 669 376.6 7.482.33 4.40 1.20 0.14 1.65 0.43 4.50 0.43 3 SULK n8 536 396 7.321.60 2.30 1.99 0.14 3.80 0.60 3.20 0.50 4 KUR n2 750 414.3 7.301.50 4.10 2.38 0.30 2.18 1.25 4.10 0.15 5 KUR n1 1095 605.2 7.203.46 5.81 1.87 0.47 3.19 2.50 5.35 0.20 AVERAGE 736 421.7 7.282.13 4.16 1.68 0.23 2.52 1.07 4.15 0.26 Table 5. Maximum, minimum and average composition of King Abdullah Canal (KAC) water one year average (meq/l), at two sites. Source (site) E.C μS/cm pH Ca2+ meq/l Mg2+ meq /l Na+ meq /l K+ meq /l Cl– meq /l 2 4 SO 3 HCO 3 NO meq/l meq/l meq/l Max 1111 8.30 4.08 6.224.780.205.482.29 5.06 0.30 Min 447 7.93 1.79 1.390.950.071.300.72 2.01 0.00 Mixture of KAC & Ziglab Dam Water Avg. 939 8.12 2.90 2.603.230.163.631.46 3.24 0.12 Max 1118 8.33 3.98 5.634.350.256.072.01 4.87 0.28 Min 466 7.62 1.66 1.391.300.101.510.37 1.93 0.00 KAC at Deir Alla area Avg. 937 8.03 2.82 2.753.320.173.991.34 3.30 0.12 Copyright © 2012 SciRes. JWARP 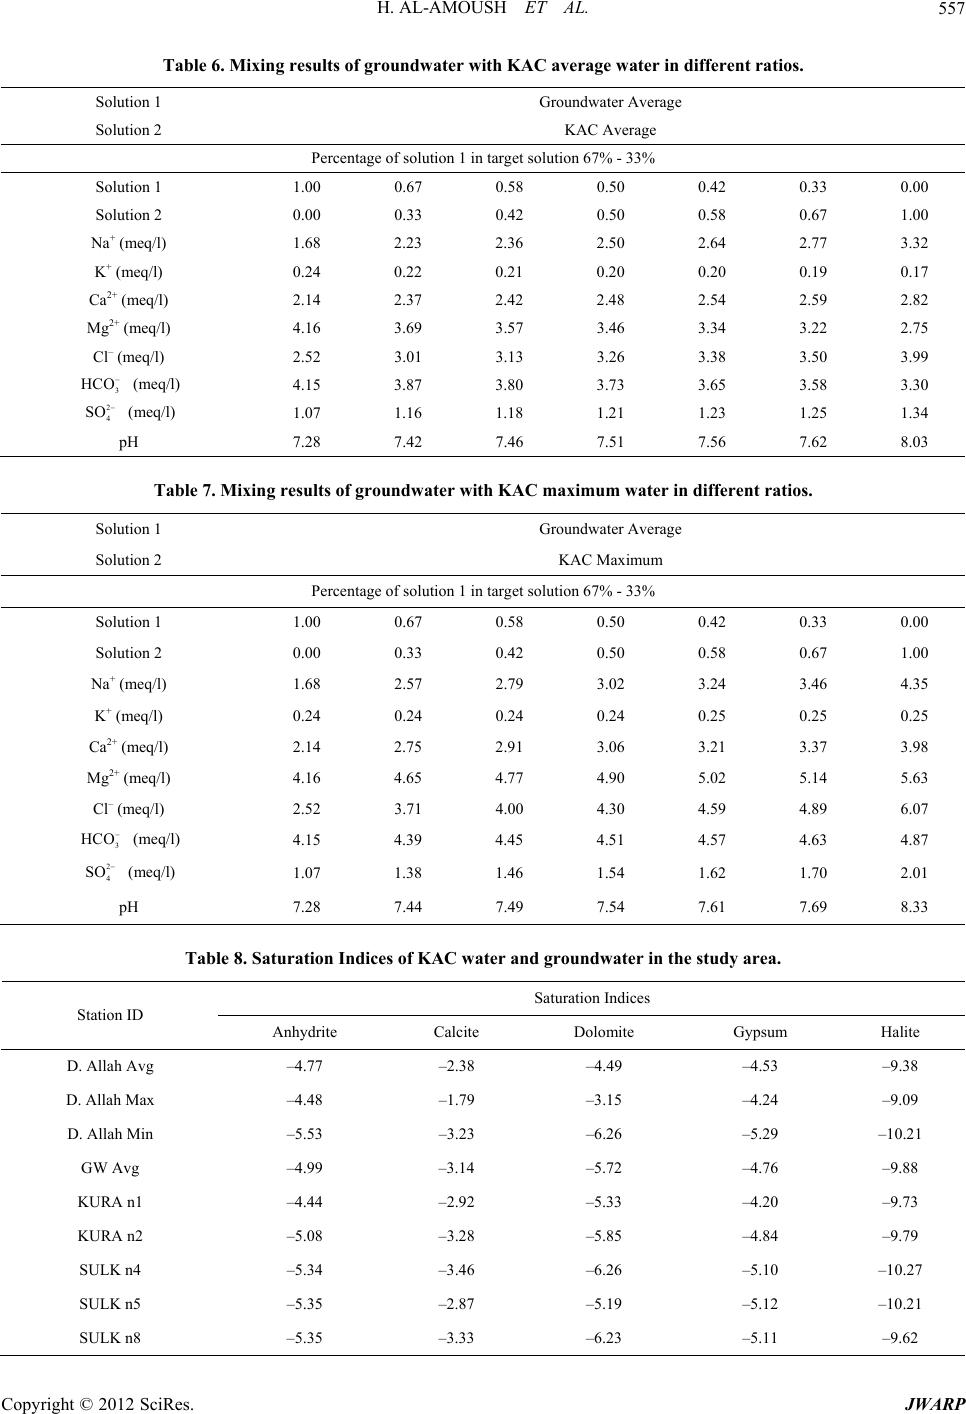 H. AL-AMOUSH ET AL. 557 Table 6. Mixing results of groundwater with KAC average water in different ratios. Solution 1 Groundwater Average Solution 2 KAC Average Percentage of solution 1 in target solution 67% - 33% Solution 1 1.00 0.67 0.58 0.50 0.42 0.33 0.00 Solution 2 0.00 0.33 0.42 0.50 0.58 0.67 1.00 Na+ (meq/l) 1.68 2.23 2.36 2.50 2.64 2.77 3.32 K+ (meq/l) 0.24 0.22 0.21 0.20 0.20 0.19 0.17 Ca2+ (meq/l) 2.14 2.37 2.42 2.48 2.54 2.59 2.82 Mg2+ (meq/l) 4.16 3.69 3.57 3.46 3.34 3.22 2.75 Cl– (meq/l) 2.52 3.01 3.13 3.26 3.38 3.50 3.99 3 HCO 2 4 SO (meq/l) 4.15 3.87 3.80 3.73 3.65 3.58 3.30 (meq/l) 1.07 1.16 1.18 1.21 1.23 1.25 1.34 pH 7.28 7.42 7.46 7.51 7.56 7.62 8.03 Table 7. Mixing results of groundwater with KAC maximum water in different ratios. Solution 1 Groundwater Average Solution 2 KAC Maximum Percentage of solution 1 in target solution 67% - 33% Solution 1 1.00 0.67 0.58 0.50 0.42 0.33 0.00 Solution 2 0.00 0.33 0.42 0.50 0.58 0.67 1.00 Na+ (meq/l) 1.68 2.57 2.79 3.02 3.24 3.46 4.35 K+ (meq/l) 0.24 0.24 0.24 0.24 0.25 0.25 0.25 Ca2+ (meq/l) 2.14 2.75 2.91 3.06 3.21 3.37 3.98 Mg2+ (meq/l) 4.16 4.65 4.77 4.90 5.02 5.14 5.63 Cl– (meq/l) 2.52 3.71 4.00 4.30 4.59 4.89 6.07 3 HCO 2 4 SO (meq/l) 4.15 4.39 4.45 4.51 4.57 4.63 4.87 (meq/l) 1.07 1.38 1.46 1.54 1.62 1.70 2.01 pH 7.28 7.44 7.49 7.54 7.61 7.69 8.33 Table 8. Saturation Indices of KAC water and groundwater in the study area. Saturation Indices Station ID Anhydrite Calcite Dolomite Gypsum Halite D. Allah Avg –4.77 –2.38 –4.49 –4.53 –9.38 D. Allah Max –4.48 –1.79 –3.15 –4.24 –9.09 D. Allah Min –5.53 –3.23 –6.26 –5.29 –10.21 GW Avg –4.99 –3.14 –5.72 –4.76 –9.88 KURA n1 –4.44 –2.92 –5.33 –4.20 –9.73 KURA n2 –5.08 –3.28 –5.85 –4.84 –9.79 SULK n4 –5.34 –3.46 –6.26 –5.10 –10.27 SULK n5 –5.35 –2.87 –5.19 –5.12 –10.21 SULK n8 –5.35 –3.33 –6.23 –5.11 –9.62 Copyright © 2012 SciRes. JWARP  H. AL-AMOUSH ET AL. Copyright © 2012 SciRes. JWARP 558 Table 9. Saturation indices of average groundwater (AVG GW) to maximum surface water (Max SW) in the study area. Sample ID Saturation Indices AVG GW to Max SW Anhydrite Calcite Dolomite Gypsum Halite 1 to 0 –4.479 –1.789 –3.144 –4.242 –9.089 2 to 1 –4.616 –2.503 –4.540 –4.379 –9.281 1 to 1 –4.694 –2.702 –4.917 –4.457 –9.396 1 to 2 –4.782 –2.856 –5.202 –4.545 –9.529 0 to 1 –4.992 –3.144 –5.716 –4.755 –9.878 Table 10. Saturation indices of average surface water and groundwater in the study area. Station ID Saturation Indices GW to SW (averages) Anhydrite Calcite Dolomite Gypsum Halite 0 to 1 –4.770 –2.382 –4.492 –4.533 –9.382 1 to 0 –4.993 –3.144 –5.716 –4.755 –9.878 1 to 1 –4.874 –2.898 –5.368 –4.637 –9.594 1 to 2 –4.840 –2.786 –5.195 –4.600 –9.517 2 to 1 –4.912 –2.991 –5.507 –4.675 –9.679 alluvial aquifer does not contain in its matrix Gypsum, Halite or Anhydrite, the water does and will not have the opportunity to dissolve these minerals as long as it stays in that type of aquifer. Mixing of water of KAC with the average groundwater type of different ratios, (Tables 8-9) indicate that the water after mixing will be still un- der-saturated with respect of Calcite, Dolomite, Gypsum and Anhydrite and strongly with respect to Halite. It will not only be saturated but it will remain in an under-satu- rated states. The final result is then mixing of KAC water with the groundwater type found in the study area will not result in any major dissolution/ precipitation reac- tions within the rock matrix, other than those taking place in a very slow process lasting hundreds to thou- sands of years. 8. Summary and Conclusions A part of the municipal water supply of north Jordan comes from King Abdullah Canal (KAC) which also supplies irrigation water to farmers in the Jordan Valley area. During the dry season the Canal waters can not supply both municipal and irrigation water due to the water shortages. In addition, sometimes the Canal water witnesses pollution events lasting for days, during which a major drinking water supply in Jordan is interrupted with no substitute. In this article creating water storage in the underground along the Canal (KAC) is studied to store water during times of excess availability in King Abdullah Canal (KAC) for uses in times of water short- age for emergency causes, especially pollution accidents the Canal water. The geology and especially the under- lying rocks building the area were mapped and geo- electrically investigated to define the capable rocks for storage and their extensions, the results of geo-electrical profiling were also tuned using geologic well logs. Mixing processes of the Canal water and the existing groundwater bodies and the water/rocks interaction were also studied. The results show that there is an immense underground space in the area of Deir Alla to store a few million cubic meters of water in the underground that the recharge of groundwater will not negatively affect the existing groundwater quality or the recharge water qua- lity and that water rock interaction will not result in any major precipitation or dissolution of minerals. The study recommends other geophysical studies such as gravity or electromagnetic surveys to verify the geo- electric and geological findings and to drill small diame- ter boreholes to depths of a few tens of meters to study the hydraulic properties of the underlying strata. This will enable going into the implementation stage of the artificial recharge project, which also might bring about improvements in the quality of King Abdullah Canal (KAC) water, which will be recharged into the alluvial aquifer as a results of self-purification. 9. Acknowledgements The Authors would like to thank the Federal Ministry of Education and Research of Germany for the financial support of this study within SMART-2 Project. Special thanks are due to Prof. Heinz Hotzl the coordinator of SMART-2 Project for his continuous support and en- couragement. REFERENCES [1] E. N. Salameh, “The Potential of Groundwater Artificial  H. AL-AMOUSH ET AL. 559 Recharge in the Jordan Valley Area/Jordan: Selected Contributions to Applied Geology in the Jordan Rift Val- ley,” Freiberger Forschungshefte C494, Freiberg, Vol. 1, No. 2, 2001, pp. 63-81. [2] H. R. Al-Amoush, “Hydro-Geophysical Investigations for the Purposes of Groundwater Artificial Recharge in the Jordan Valley Area,” Ph.D. Dissertation, University of Jordan, Amman, 2006. [3] E. Salameh, H. Al-Amoush, H. Jasim, B. Sagarat and M. El-Fawwaz, “Underground Water Storage along King Abdullah Canal, A Means to Control Water Pollution and to Cope with Temporary Water Shortages,” Final Report for MWI, Amman, 2009. [4] Ministry of Water and Irrigation (MWI) Open Files, Jor- dan, 2011. [5] Department of Metrology (DOM) Open Internal Reports, Amman, 2011. [6] E. Salameh, “Water Quality Degradation in Jordan,” 1st Edition, Friedrich Elbert Stifing (FES) and Royal Society for Conservation of Nature (RSCN), Amman, 1996. [7] S. M. McDonald and Partners in Cooperation with Hunt- ing Geological Survey Limited, “East Bank Water Re- sources,” Ministry of Water and Irrigation, Amman, Jor- dan, Vol. 5, 1965, p. 512. [8] Natural Resources Authority (NRA) Open Files, Jordan 2011. [9] J. Sahawneh, “Geology and Structural Interpretation of the Area NE of the Dead Sea,” M.Sc. Dissertation, Yar- mouk University, Irbid, 1991. [10] F. Bender, “Geology of Jordan,” Gebrueder Borntraeger, Berlin, 1974, 196 p. [11] A. Abed, “Geology of Jordan (in Arabic),” Al-Nahda Al-Islamiah Library, Amman, 1982, 232 p. [12] F. Bender, “Geologie Von Jordanian,” Beitrage zur Regionalen der arde, Gebruder Borntraeger, Berlin, 1968, 230 p. [13] Japan International Cooperation Agency (JICA), “The Study on Brackish Groundwater Desalinization in Jordan Valley,” Yachiyo Engineering Co., Ltd, and Mitsu Min- eral Development Engineering Co., Ltd., Tokyo, 1965, 318 p. [14] R. Kirsch and K. Ernstson, “Geoelectrical Methods,” In: R. Kirsch, Ed., Groundwater Geophysics, a Tool for Hydrogeology, Germany, 2006, pp. 85-116. [15] E. Orenella and H. M. Mooney, “Master Tables and Curves for Vertical Electrical Sounding over Layered Structures,” Interciencia, Madrid, 1966, 34 p. [16] B . P. A. Vander Velpen and R. J. Sporry, “RESIST. A Computer Program to Process Resistivity Sounding Data on PC Compatibles,” Computer and Geosciences, Vol. 19, No. 5, 1993, pp. 691-703. doi:10.1016/0098-3004(93)90102-B [17] A. Zohdy and R. J. Bisdorf, “Programs for the Automatic Processing and Interpretation of Schlumberger Sounding curves in Quick Basic. U.S.G.S,” Open File Report, 89-137-2, 1989, 64 p. [18] Ministry of Agriculture (MOA) Open Internal Reports, Jordan, 1993. [19] A. F. Hamadeh, “Quality Changes of Infiltrated RAIN- WATER in Soils for a Profile Extending from Deir-Alla to Safawi,” M.Sc. Dissertation, University of Jordan, 2000. [20] A. L. Bloom, “Geomorphology a Systematic Analysis of Late Cenozoic Land Forms,” Prentice Hall, New Jersey, 1978. [21] L. Calmbach, “HYDROWIN Software Version 3,” Insti- tute de Mineralogy, Lausanne, 1995. Copyright © 2012 SciRes. JWARP
|