L. ZYSBERG
Method
Settings an d S tu dy Design
The study was conducted in a large financial organization
providing investment services to a broad range of clients, in
Israel. The organization employs about 7000 individuals, about
66% of whom are based in 180 branches nationwide. Data col-
lection took place in a series of specially designed assessment
centers used for the selection of Investments department man-
agers. The position is considered mid-tier management and is
open to inside employees only, typically investment profes-
sionals without official managerial background (though many
have some training in management).
Sample
One hundred and eighty candidates took part in ACs for the
above job, after applying for an internal call for candidates, and
passing a basic screening process based on their resumes. Of
the above sample, 75 were placed in managerial positions with-
in 6 month s following the AC. For this sample, ages ranged 29 -
50 (mean age = 41.00; sd = 7.65), 60% were men and 40%
were women. Tenure with the company at the time of applica-
tion ranged 5 - 25 years. They all had at least a Bachelor’s de-
gree and 20% had a graduate level degree or equivalent.
Instruments
Assessment centers were specially designed for this position
by a team of expert Industrial-Organizational psychologists
working for the organization, to reflect behaviors according to
the job description provided by the organization HR division.
The assessment centers included: 1) A self- presentation task in
which participants planned and performed a time-limited self-
presentation; 2) A discussion group, simulating professional
credit-approva l dilemmas in whic h consensus has to be reached
via discussion; 3) A group “in-basket” assignment simulating
daily assignments of an investment department manager and 4)
A competitive ‘branch promotion event’ assignment in which 2
or more sub-groups competed on designing and presenting the
best promotion event for a new investment product. These tasks,
though tailored for the specific job and organization are based
on widely used paradigms (see for example: Bray & Grant,
1966; Thornton & Gibbons, 2009).
Data from 10 groups (total n = 75) was included in this
analysis. The data was summarized across 6 dimensions rated
by 2 observers (one is an HR specialist and the other an I/O
psychologist from outside the organization). The two observers
discussed each candidate after the AC and reached consensus as
for the grade on each dimension, as well as a general recom-
mendation regarding the candidate’s fit for the position. Grades
were given on a Stanine scale. The dimensions were as follows:
1) General cognitive ability: problem solving, effective infor-
mation processing; 2) Work style: planned, orderly perform-
ance, paying attention to technical details while keeping awa-
reness of the group goals; 3) Interpersonal relations: open, ef-
fective and assertive communication, collaboration and sensi-
tivity to others; 4) Service & Sales orientation: service aware-
ness, perceiving client-oriented service as a priority, identifying
and taking opportunities to broaden the business and customer
base; 5) Organizational commitment: Embracing organiza-
tional values and priorities, identification with the organization
and its interests; 6) Leadership potential: initiating action, as-
suming responsibilities and motivating others. These dimen-
sions fit a model of generalized dimension structure presented
in a meta-analysis of a large number of studies of assessment
centers (Arthur, Day, McNelly, & Edens, 2006).
Demographic data was collected via a short questionnaire.
Data analysis included gender, age, and tenure.
Criterion data—bonus for managerial performance: as a cri-
terion for managerial performance we collected data regarding
the managers’ performance-based bonus, at the end of the year
following the AC. Bonus is calculated and paid by the HR divi-
sion, ranges 0 to 30 units, each unit representing a given per-
centage of the employee’s monthly salary. Bonus is paid once a
year only in branches reaching or surpassing their business
objectives and goals. Differential bonus is awarded based on
profits, and performance appraisal provided by the employee’s
supervisor. Though there is room for personal judgment, bonus
sums are monitored carefully by the corporate office and super-
visors are held liable for the fairn ess a nd perf ormance cong ru-
ency of the process. Thus it is assumed that this data is a valid
indication of managerial performance through the corporate
lens.
Procedure
After obtaining the organization’s approval for data collec-
tion, we retrieved data from the corporate files making sure no
identifying markers are left in the data to allow tracing indi-
viduals, thus assuring anonymity.
The data was then analyzed using SPSS 19.0 (IBM, 2012).
Results
Before testing the hypotheses we examined the distribution
of our main variables and the general associations among them.
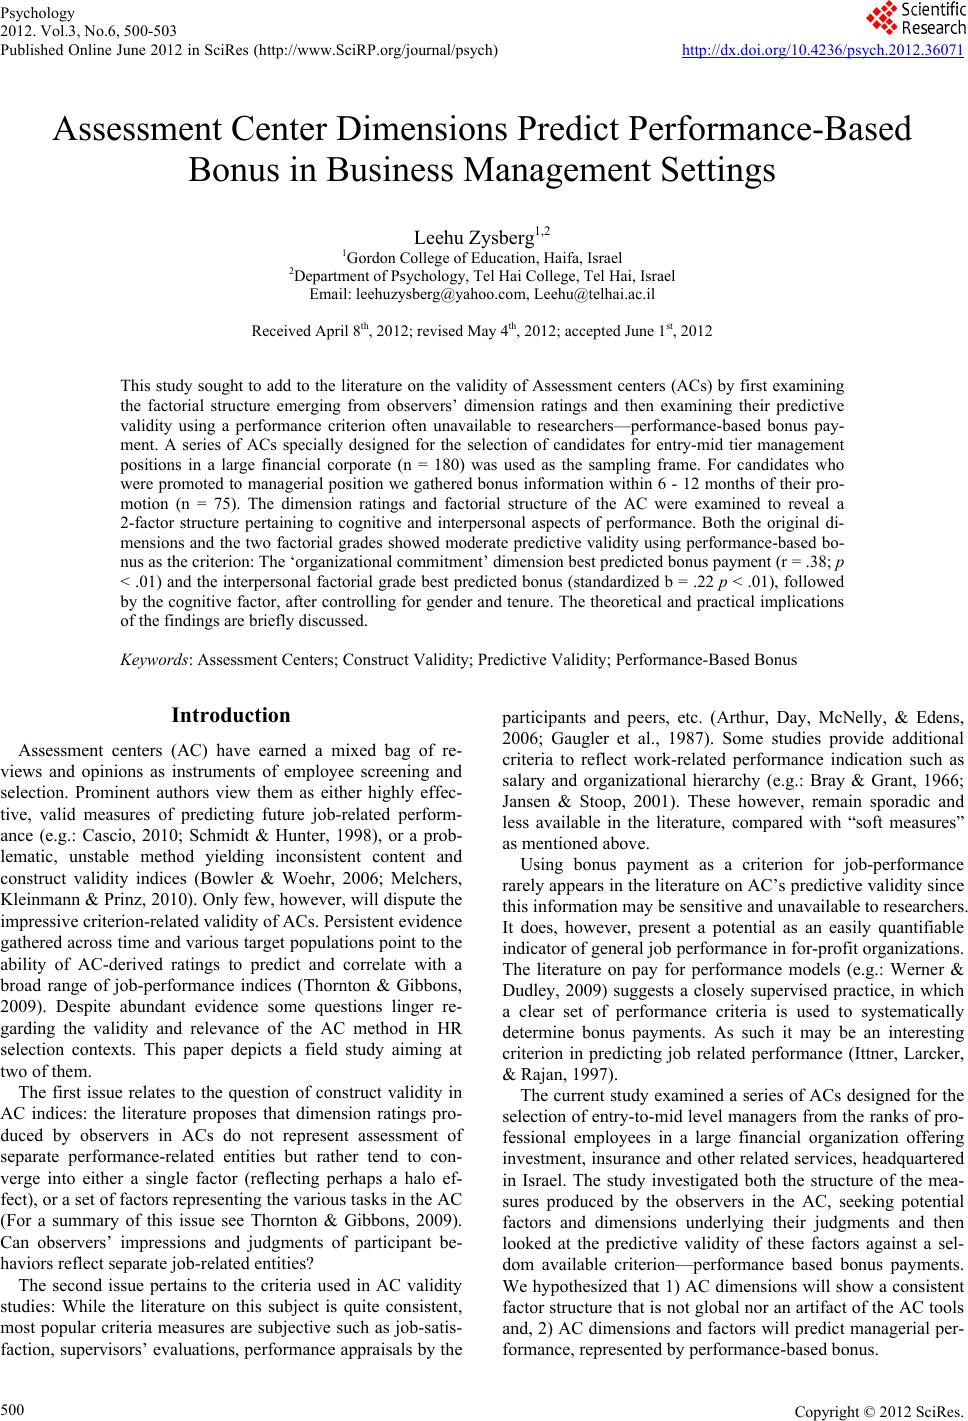
Table 1 summarizes descriptive statistics and Pearson’s corre-
lations between the study variables.
The results reveal a distribution of grades and the bonus units
allowing for parametric statistical analysis (Coolican, 2010).
The analysis shows that 5 of the 6 dimension ratings in the
AC correlated positively with the bonus criterion. “Organiza-
tional commitment” showed the strongest association while
“cognitive skills” did not associate with the criterion at all. The
correlations reveal association patterns within the AC dimen-
sions suggesting underlying factors. The correlations also indi-
cate moderate associations between various AC dimension
grades, the AC final recommendation grade and the bonus
value.
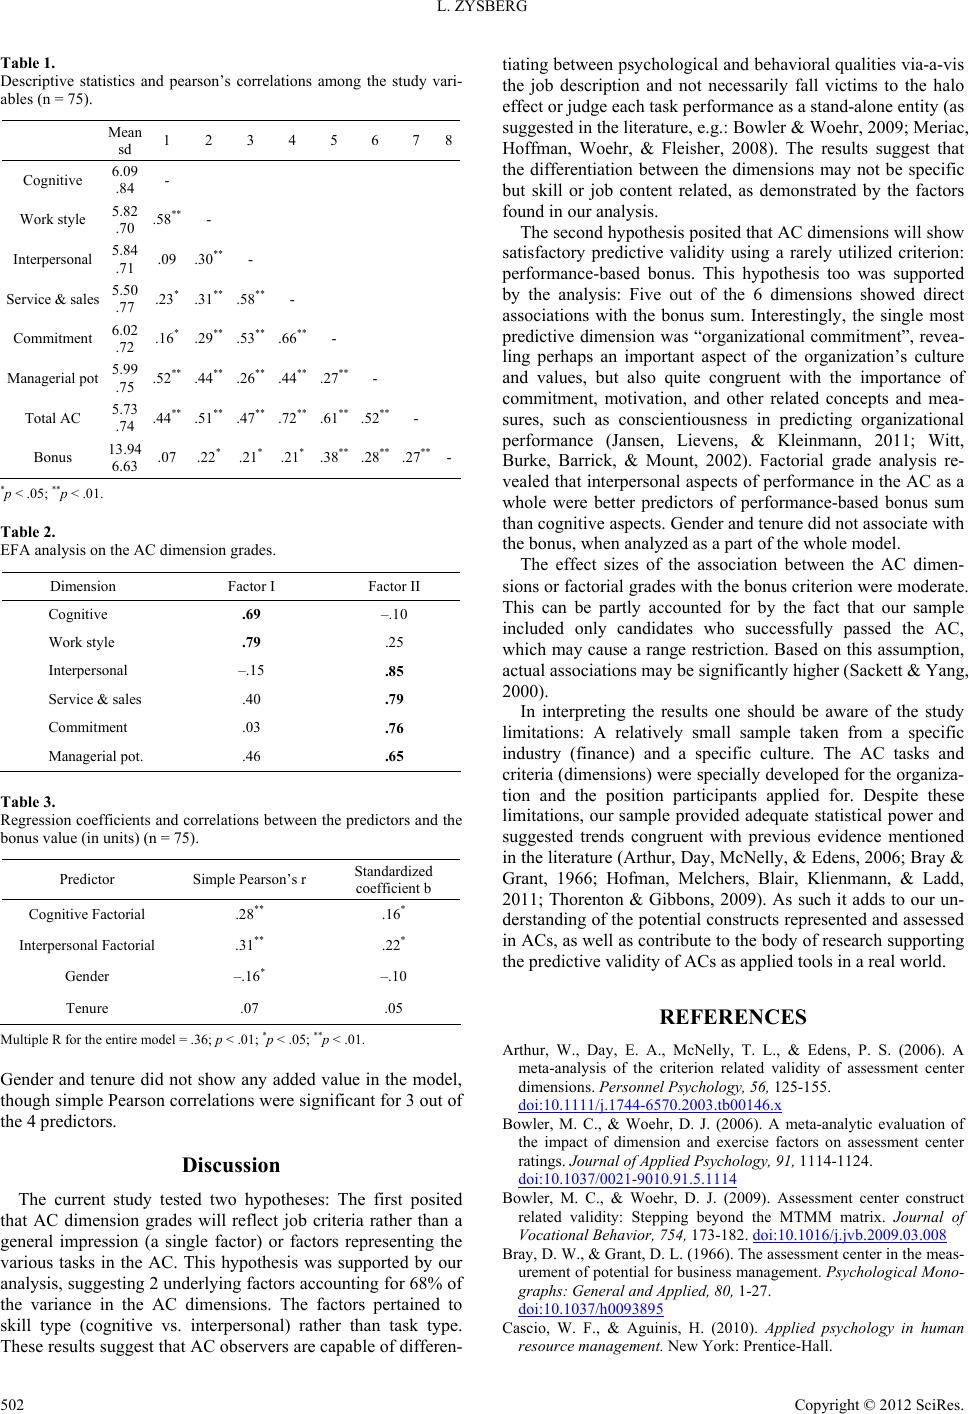
We then proceeded to conduct an exploratory factor analysis
(EFA) to reveal potential factors within the AC dimensions.
The Varimax rotated model accounted for 68% of the total
variance suggesting 2 factors. Table 2 depicts the EFA results.
The 2 factor structure matches a conceptual differentiation
between cognitive/intellectual aspects and interpersonal aspects
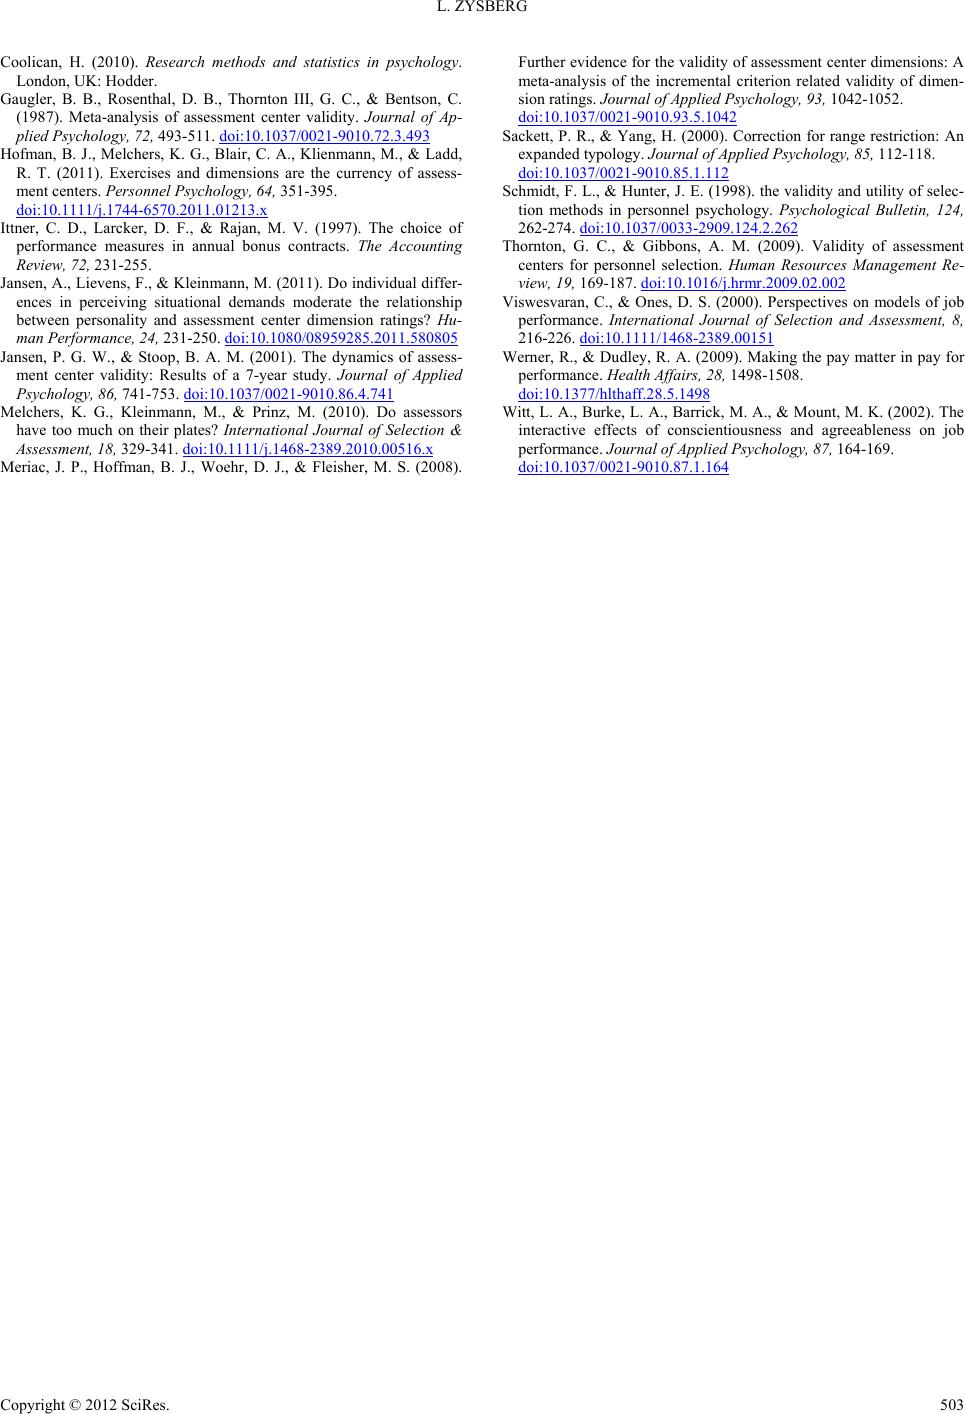
of performance in the AC. We then calculated a mean score for
dimensions loading on the Cognitive factor and the dimensions
loading on the Interpersonal factor. We used these factorial
scores in a regression analysis, as well as tenure and gender to
predict the bonus value. Table 3 summarizes the results of the
analysis.
The results show that a multiple R of .36 (p < .01) was ac-
counted for by the interpersonal and cognitive factor grades.
Copyright © 2012 SciRes. 501