 Psychology 2012. Vol.3, No.7, 518-524 Published Online July 2012 in SciRes (http://www.SciRP.org/journal/psych) http://dx.doi.org/10.4236/psych.2012.37075 Copyright © 2012 SciRes. 518 Multi-Informant Test Anxiety Assessment of Adolescents Jody Vincent Harpell, Jac J. W. Andrews Division of Applied Psychology, University of Calgary, Calgary, Canada Email: jharpel1@staff.ednet.ns.ca Received March 23rd, 2012; revised April 25th, 2012; accepted May 28th, 2012 A total of 263 junior and senior high school students (grades 7, 8, 9, 10, 11, 12; ages 12 to 19) with rela- tively more informants identifying as females (57.4%) than males (42.6%) and more junior high school students (68.3%) than high school students (31.7%), along with 267 parents and 167 teachers responded to a student, parent, and teacher version of the German Test Anxiety Inventory (TAI-G) (Hoddapp & Benson, 1997). All reliabilities for all TAI-G scales for all three samples were above .70. The resulting data were fitted to two, three, and four factor models of test anxiety based on theoretical and empirical evidence. The four factor model (worry, emotion, distraction, lack of confidence) of the reduced (17 item) version of the TAI-G (Hoddapp & Benson, 1997) yielded the best fitting model for students (comparative fit index = .97; residual mean square = .042), parents (comparative fit index = .95; residual mean square = .073), and teachers (comparative fit index = .96; residual mean square = .080), thus providing very strong support for the proposed model. Sex, age, grade, and informant differences are presented and dis- cussed. In conclusion, this study supports further research and use of a multi-informant assessment system of test anxiety. Keywords: Test Anxiety; Multi-Informant Assessment; Test Anxiety Assessment; Adolescents; Junior High Introduction The construct of Test Anxiety (TA) has undergone consider- able evolution since Sarason and Mandler’s (1952) early re- search demonstrating a link between anxiety and poor test per- formance. This foundational study was followed by the devel- opment of the Test Anxiety Scale for Children (TASC; Sarason et al., 1960) which measured TA among children as a unitary construct. Follow-up research suggested that TA was a multi- dimensional construct which could be divided into two funda- mental components: Worry and Emotionality (Liebert & Morris, 1967). Worry represented the cognitive concerns relating to failure and consequences of failure, whereas Emotionality rep- resented the physiological symptomatology associated with anxiety (e.g., heart racing). Later, several studies supported the inclusion of Cognitive Obstruction or Cognitive Interference (McKeachie, 1984; Swanson & Howell, 1996; Tyron, 1980; Wine, 1971). Sarason (1984) agreed, claiming that both worry (i.e., preoccupation with failure, negative self-talk) and cogni- tive interference (i.e., disruptive/blocking thoughts) could more accurately describe the cognitive domain of TA. As a result, this factor was represented in Sarason’s (1984) Reactions to Tests (RTT) scales, developed through factor analysis on a sample of undergraduate students. In an effort to further de- velop the construct of TA, Carver and Scheier (1984) proposed that Lack of Confidence should be included in the TA frame- work. Eventually, these contributions led to the development of a commonly utilized and accepted measure of TA in recent research: the German Test Anxiety Index (TAI-G; Hodapp, 1991, 1995). Research relative to the psychometric properties of the TAI-G in German and American populations has revealed high reliability and validity across the various sub-domains (Hodapp, 1991, 1995; Hodapp & Benson, 1997; Keith, Hodapp, Scher- meller-Engel, & Moosbrugger, 2003; Musch & Broder, 1999) and support for a four factor model of TA: Worry, Emotionality, Interference, and Lack of Confidence (Hodapp, 1991, 1995), with Worry consistently demonstrating a greater negative im- pact on test performance compared to the other factors (Def- fenbacher, 1980; Hembree, 1988; Liebert & Morris, 1967). Assessment of Test Anxiety Assessment of TA using scales designed to measure factors known to comprise the construct of TA has relied exclusively on self-reports. This practice continues despite the broad use of multi-informant procedures in the field of anxiety assessment at large. According to Zeidner (1998), there is some evidence that children report more internalizing symptoms than parents (Angold et al., 1987; Edelbrock et al., 1986). Reliance on self-reporting, however, is not the norm in the broad scheme of anxiety measurement. Typically, anxious symptomatology is assessed within a multi-informant assessment framework, whereby self-reports are compared to observations made by parents, teachers, and other sources (Jensen, Rubio-STipec, Canino, Bird, Dulcan, Schwab-Stone et al., 1999; Kazdin, 1986; Kendal & Flanery-Schroeder, 1998; Ollendick, 1986; Grills & Ollendick, 2003; Comer & Kendall, 2004). As outlined by Brown-Jacobsen, Wallace, & Whiteside (2011), the majority of researchers and clinicians support the utility of multi-in- formant approaches to general anxiety assessment, as they are held to enhance diagnostic accuracy and direct more informed treatment choices compared to self-evaluations alone. Despite this endorsement of multi-informant assessment for anxiety, TA assessment continues to rely upon self-evaluation proce- dures. 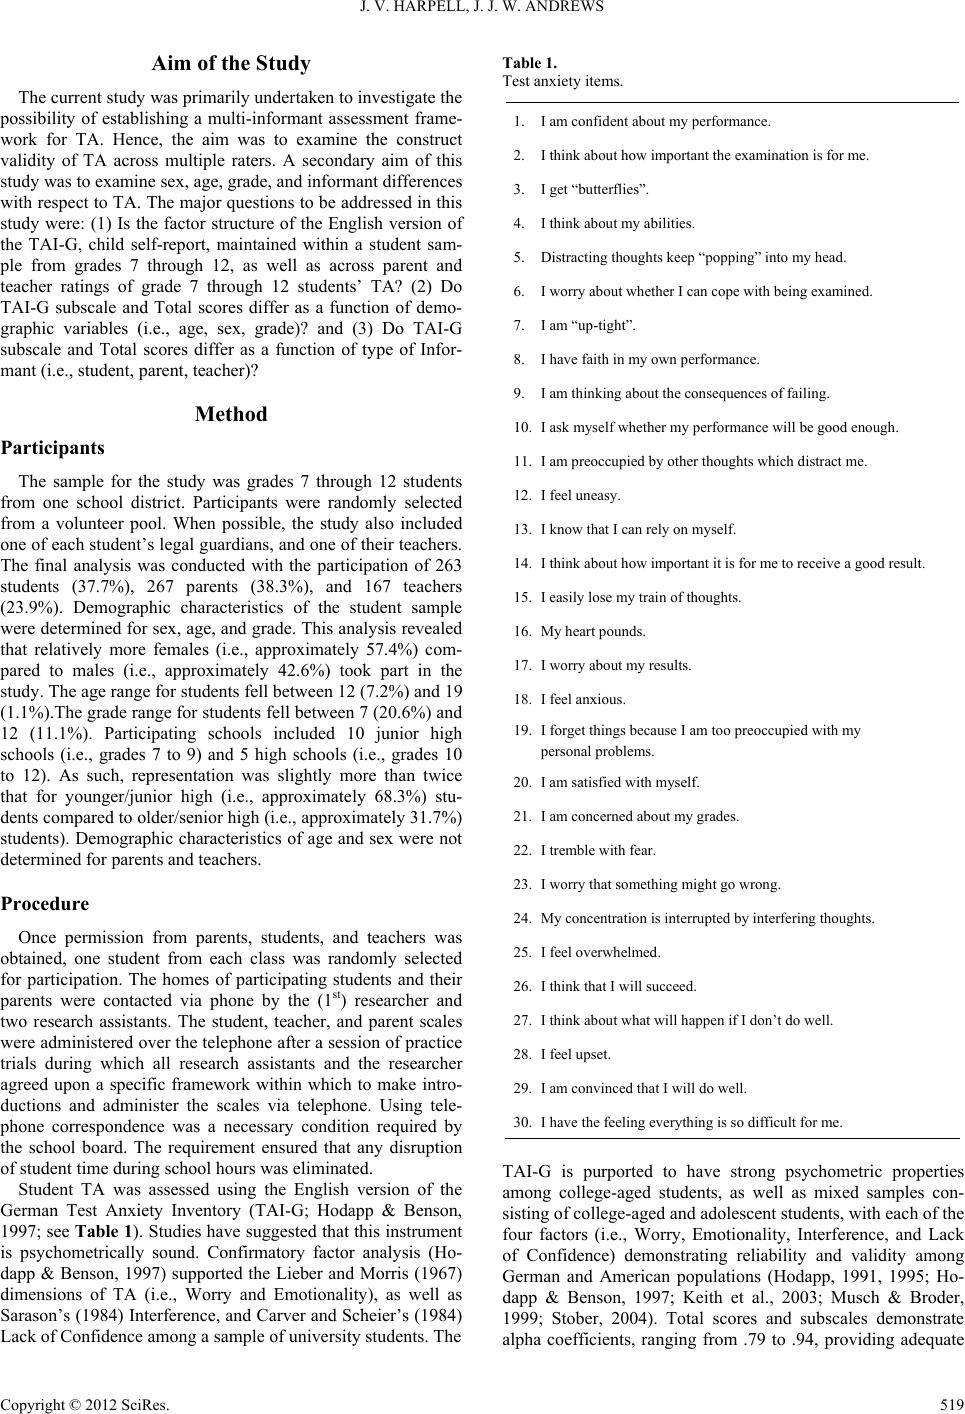 J. V. HARPELL, J. J. W. ANDREWS Aim of the Study The current study was primarily undertaken to investigate the possibility of establishing a multi-informant assessment frame- work for TA. Hence, the aim was to examine the construct validity of TA across multiple raters. A secondary aim of this study was to examine sex, age, grade, and informant differences with respect to TA. The major questions to be addressed in this study were: (1) Is the factor structure of the English version of the TAI-G, child self-report, maintained within a student sam- ple from grades 7 through 12, as well as across parent and teacher ratings of grade 7 through 12 students’ TA? (2) Do TAI-G subscale and Total scores differ as a function of demo- graphic variables (i.e., age, sex, grade)? and (3) Do TAI-G subscale and Total scores differ as a function of type of Infor- mant (i.e., student, parent, teacher)? Method Participants The sample for the study was grades 7 through 12 students from one school district. Participants were randomly selected from a volunteer pool. When possible, the study also included one of each student’s legal guardians, and one of their teachers. The final analysis was conducted with the participation of 263 students (37.7%), 267 parents (38.3%), and 167 teachers (23.9%). Demographic characteristics of the student sample were determined for sex, age, and grade. This analysis revealed that relatively more females (i.e., approximately 57.4%) com- pared to males (i.e., approximately 42.6%) took part in the study. The age range for students fell between 12 (7.2%) and 19 (1.1%).The grade range for students fell between 7 (20.6%) and 12 (11.1%). Participating schools included 10 junior high schools (i.e., grades 7 to 9) and 5 high schools (i.e., grades 10 to 12). As such, representation was slightly more than twice that for younger/junior high (i.e., approximately 68.3%) stu- dents compared to older/senior high (i.e., approximately 31.7%) students). Demographic characteristics of age and sex were not determined for parents and teachers. Procedure Once permission from parents, students, and teachers was obtained, one student from each class was randomly selected for participation. The homes of participating students and their parents were contacted via phone by the (1st) researcher and two research assistants. The student, teacher, and parent scales were administered over the telephone after a session of practice trials during which all research assistants and the researcher agreed upon a specific framework within which to make intro- ductions and administer the scales via telephone. Using tele- phone correspondence was a necessary condition required by the school board. The requirement ensured that any disruption of student time during school hours was eliminated. Student TA was assessed using the English version of the German Test Anxiety Inventory (TAI-G; Hodapp & Benson, 1997; see Table 1). Studies have suggested that this instrument is psychometrically sound. Confirmatory factor analysis (Ho- dapp & Benson, 1997) supported the Lieber and Morris (1967) dimensions of TA (i.e., Worry and Emotionality), as well as Sarason’s (1984) Interference, and Carver and Scheier’s (1984) Lack of Confidence among a sample of university students. The Table 1. Test anxiety items. 1. I am confident about my performance. 2. I think about how important the examination is for me. 3. I get “butterflies”. 4. I think about my abilities. 5. Distracting thoughts keep “popping” into my head. 6. I worry about whether I can cope with being examined. 7. I am “up-tight”. 8. I have faith in my own performance. 9. I am thinking about the consequences of failing. 10. I ask myself whether my performance will be good enough. 11. I am preoccupied by other thoughts which distract me. 12. I feel uneasy. 13. I know that I can rely on myself. 14. I think about how important it is for me to receive a good result. 15. I easily lose my train of thoughts. 16. My heart pounds. 17. I worry about my results. 18. I feel anxious. 19. I forget things because I am too preoccupied with my personal problems. 20. I am satisfied with myself. 21. I am concerned about my grades. 22. I tremble with fear. 23. I worry that something might go wrong. 24. My concentration is interrupted by interfering thoughts. 25. I feel overwhelmed. 26. I think that I will succeed. 27. I think about what will happen if I don’t do well. 28. I feel upset. 29. I am convinced that I will do well. 30. I have the feeling everything is so difficult for me. TAI-G is purported to have strong psychometric properties among college-aged students, as well as mixed samples con- sisting of college-aged and adolescent students, with each of the four factors (i.e., Worry, Emotionality, Interference, and Lack of Confidence) demonstrating reliability and validity among German and American populations (Hodapp, 1991, 1995; Ho- dapp & Benson, 1997; Keith et al., 2003; Musch & Broder, 1999; Stober, 2004). Total scores and subscales demonstrate alpha coefficients, ranging from .79 to .94, providing adequate Copyright © 2012 SciRes. 519 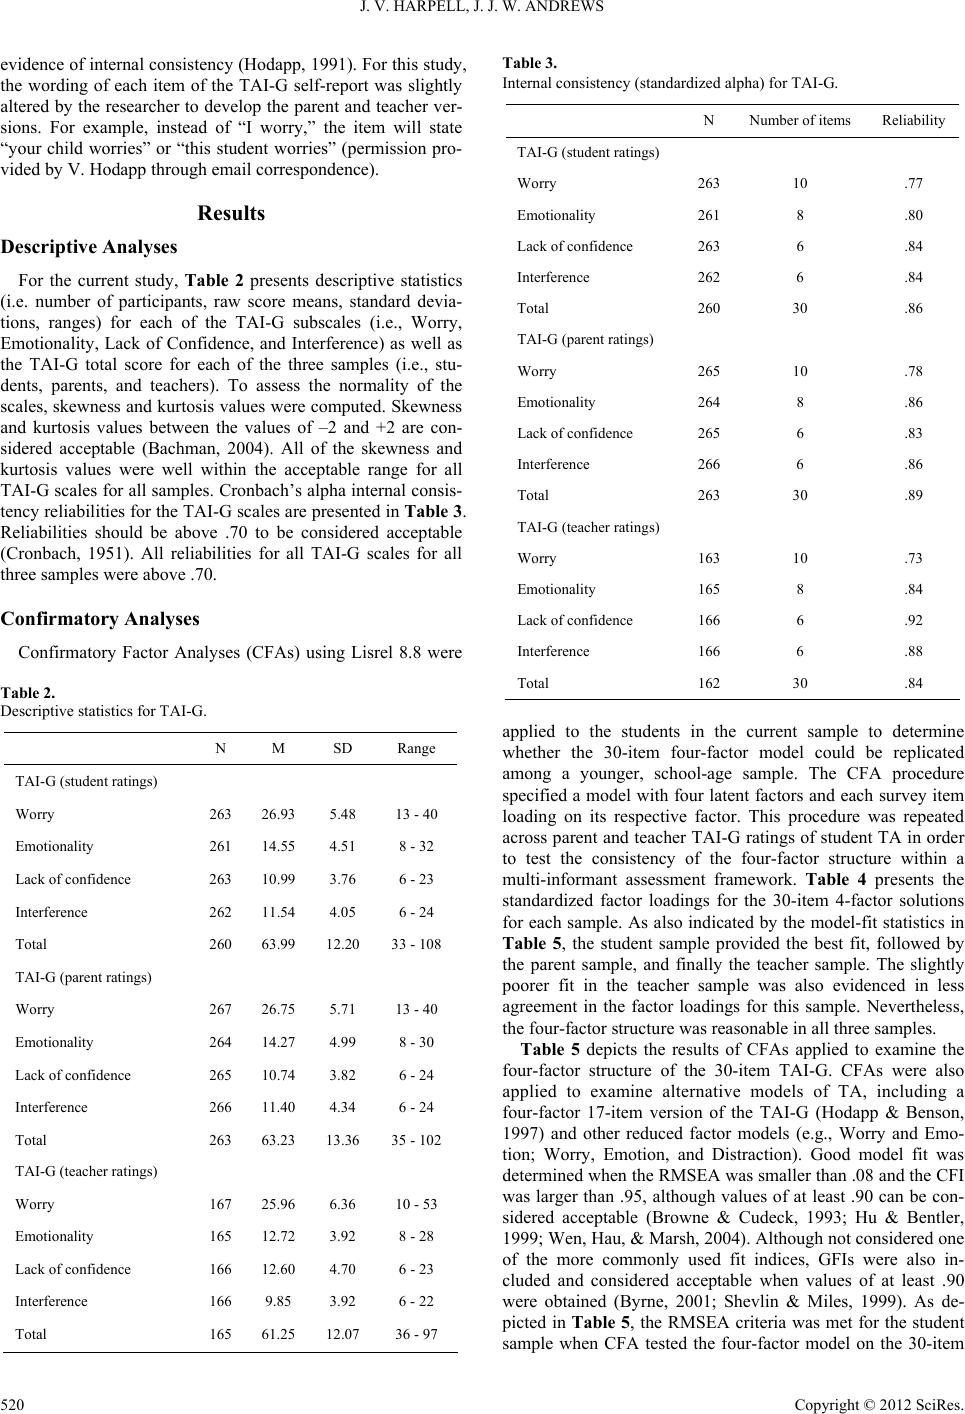 J. V. HARPELL, J. J. W. ANDREWS evidence of internal consistency (Hodapp, 1991). For this study, the wording of each item of the TAI-G self-report was slightly altered by the researcher to develop the parent and teacher ver- sions. For example, instead of “I worry,” the item will state “your child worries” or “this student worries” (permission pro- vided by V. Hodapp through email correspondence). Results Descripti ve A n a ly ses For the current study, Table 2 presents descriptive statistics (i.e. number of participants, raw score means, standard devia- tions, ranges) for each of the TAI-G subscales (i.e., Worry, Emotionality, Lack of Confidence, and Interference) as well as the TAI-G total score for each of the three samples (i.e., stu- dents, parents, and teachers). To assess the normality of the scales, skewness and kurtosis values were computed. Skewness and kurtosis values between the values of –2 and +2 are con- sidered acceptable (Bachman, 2004). All of the skewness and kurtosis values were well within the acceptable range for all TAI-G scales for all samples. Cronbach’s alpha internal consis- tency reliabilities for the TAI-G scales are presented in Table 3. Reliabilities should be above .70 to be considered acceptable (Cronbach, 1951). All reliabilities for all TAI-G scales for all three samples were above .70. Confir matory Analyses Confirmatory Factor Analyses (CFAs) using Lisrel 8.8 were Table 2. Descriptive statistics for TAI-G. N M SD Range TAI-G (student ratings) Worry 263 26.93 5.48 13 - 40 Emotionality 261 14.55 4.51 8 - 32 Lack of confidence 263 10.99 3.76 6 - 23 Interference 262 11.54 4.05 6 - 24 Total 260 63.99 12.20 33 - 108 TAI-G (parent ratings) Worry 267 26.75 5.71 13 - 40 Emotionality 264 14.27 4.99 8 - 30 Lack of confidence 265 10.74 3.82 6 - 24 Interference 266 11.40 4.34 6 - 24 Total 263 63.23 13.36 35 - 102 TAI-G (teacher ratings) Worry 167 25.96 6.36 10 - 53 Emotionality 165 12.72 3.92 8 - 28 Lack of confidence 166 12.60 4.70 6 - 23 Interference 166 9.85 3.92 6 - 22 Total 165 61.25 12.07 36 - 97 Table 3. Internal consistency (standardized alpha) for TAI-G. N Number of items Reliability TAI-G (student ratings) Worry 26310 .77 Emotionality 2618 .80 Lack of confidence 2636 .84 Interference 2626 .84 Total 26030 .86 TAI-G (parent ratings) Worry 26510 .78 Emotionality 2648 .86 Lack of confidence 2656 .83 Interference 2666 .86 Total 26330 .89 TAI-G (teacher ratings) Worry 16310 .73 Emotionality 1658 .84 Lack of confidence 1666 .92 Interference 1666 .88 Total 16230 .84 applied to the students in the current sample to determine whether the 30-item four-factor model could be replicated among a younger, school-age sample. The CFA procedure specified a model with four latent factors and each survey item loading on its respective factor. This procedure was repeated across parent and teacher TAI-G ratings of student TA in order to test the consistency of the four-factor structure within a multi-informant assessment framework. Table 4 presents the standardized factor loadings for the 30-item 4-factor solutions for each sample. As also indicated by the model-fit statistics in Table 5, the student sample provided the best fit, followed by the parent sample, and finally the teacher sample. The slightly poorer fit in the teacher sample was also evidenced in less agreement in the factor loadings for this sample. Nevertheless, the four-factor structure was reasonable in all three samples. Table 5 depicts the results of CFAs applied to examine the four-factor structure of the 30-item TAI-G. CFAs were also applied to examine alternative models of TA, including a four-factor 17-item version of the TAI-G (Hodapp & Benson, 1997) and other reduced factor models (e.g., Worry and Emo- tion; Worry, Emotion, and Distraction). Good model fit was determined when the RMSEA was smaller than .08 and the CFI was larger than .95, although values of at least .90 can be con- sidered acceptable (Browne & Cudeck, 1993; Hu & Bentler, 1999; Wen, Hau, & Marsh, 2004). Although not considered one of the more commonly used fit indices, GFIs were also in- cluded and considered acceptable when values of at least .90 were obtained (Byrne, 2001; Shevlin & Miles, 1999). As de- picted in Table 5, the RMSEA criteria was met for the student sample when CFA tested the four-factor model on the 30-item Copyright © 2012 SciRes. 520 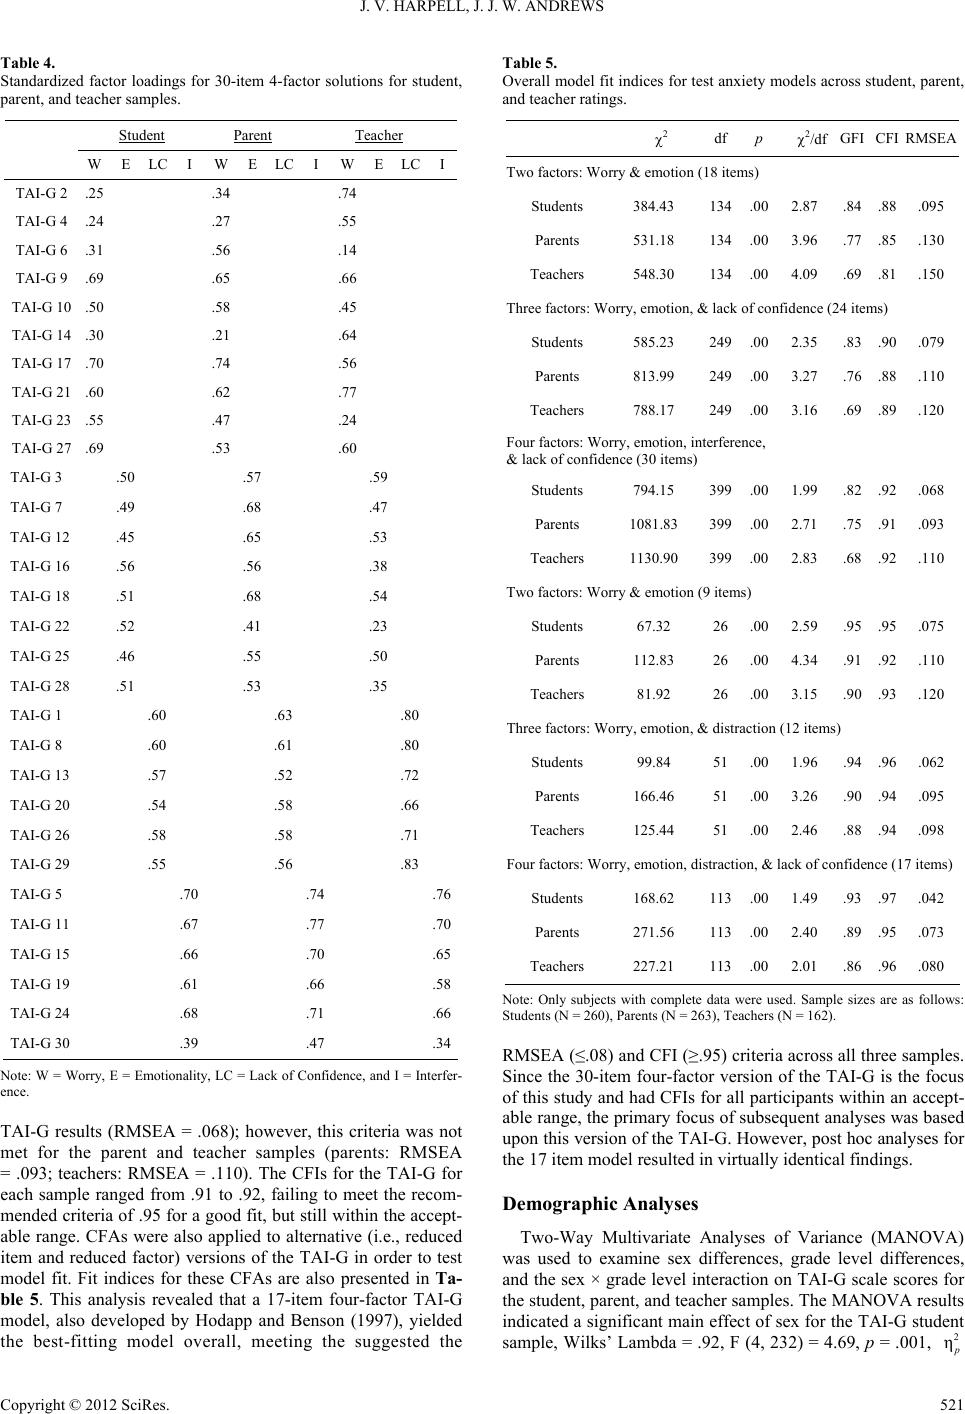 J. V. HARPELL, J. J. W. ANDREWS Table 4. Standardized factor loadings for 30-item 4-factor solutions for student, parent, and teacher samples. Student Parent Teacher W E LC I W E LC I W ELC I TAI-G 2 .25 .34 .74 TAI-G 4 .24 .27 .55 TAI-G 6 .31 .56 .14 TAI-G 9 .69 .65 .66 TAI-G 10 .50 .58 .45 TAI-G 14 .30 .21 .64 TAI-G 17 .70 .74 .56 TAI-G 21 .60 .62 .77 TAI-G 23 .55 .47 .24 TAI-G 27 .69 .53 .60 TAI-G 3 .50 .57 .59 TAI-G 7 .49 .68 .47 TAI-G 12 .45 .65 .53 TAI-G 16 .56 .56 .38 TAI-G 18 .51 .68 .54 TAI-G 22 .52 .41 .23 TAI-G 25 .46 .55 .50 TAI-G 28 .51 .53 .35 TAI-G 1 .60 .63 .80 TAI-G 8 .60 .61 .80 TAI-G 13 .57 .52 .72 TAI-G 20 .54 .58 .66 TAI-G 26 .58 .58 .71 TAI-G 29 .55 .56 .83 TAI-G 5 .70 .74 .76 TAI-G 11 .67 .77 .70 TAI-G 15 .66 .70 .65 TAI-G 19 .61 .66 .58 TAI-G 24 .68 .71 .66 TAI-G 30 .39 .47 .34 Note: W = Worry, E = Emotionality, LC = Lack of Confidence, and I = Interfer- ence. TAI-G results (RMSEA = .068); however, this criteria was not met for the parent and teacher samples (parents: RMSEA = .093; teachers: RMSEA = .110). The CFIs for the TAI-G for each sample ranged from .91 to .92, failing to meet the recom- mended criteria of .95 for a good fit, but still within the accept- able range. CFAs were also applied to alternative (i.e., reduced item and reduced factor) versions of the TAI-G in order to test model fit. Fit indices for these CFAs are also presented in Ta- ble 5. This analysis revealed that a 17-item four-factor TAI-G model, also developed by Hodapp and Benson (1997), yielded the best-fitting model overall, meeting the suggested the Table 5. Overall model fit indices for test anxiety models across student, parent, and teacher ratings. 2 df p 2/df GFI CFIRMSEA Two factors: Worry & emotion (18 items) Students 384.43 134 .00 2.87 .84 .88.095 Parents 531.18 134 .00 3.96 .77 .85.130 Teachers 548.30 134 .00 4.09 .69 .81.150 Three factors: Worry, emotion, & lack of confidence (24 items) Students 585.23 249 .00 2.35 .83 .90.079 Parents 813.99 249 .00 3.27 .76 .88.110 Teachers 788.17 249 .00 3.16 .69 .89.120 Four factors: Worry, emotion, interference, & lack of confidence (30 items) Students 794.15 399 .00 1.99 .82 .92.068 Parents 1081.83 399 .00 2.71 .75 .91.093 Teachers 1130.90 399 .00 2.83 .68 .92.110 Two factors: Worry & emotion (9 items) Students 67.32 26 .00 2.59 .95 .95.075 Parents 112.83 26 .00 4.34 .91 .92.110 Teachers 81.92 26 .00 3.15 .90 .93.120 Three factors: Worry, emotion, & distraction (12 items) Students 99.84 51 .00 1.96 .94 .96.062 Parents 166.46 51 .00 3.26 .90 .94.095 Teachers 125.44 51 .00 2.46 .88 .94.098 Four factors: Worry, emotion, distraction, & lack of confidence (17 items) Students 168.62 113 .00 1.49 .93 .97.042 Parents 271.56 113 .00 2.40 .89 .95.073 Teachers 227.21 113 .00 2.01 .86 .96.080 Note: Only subjects with complete data were used. Sample sizes are as follows: Students (N = 260), Parents (N = 263), Teachers (N = 162). RMSEA (≤.08) and CFI (≥.95) criteria across all three samples. Since the 30-item four-factor version of the TAI-G is the focus of this study and had CFIs for all participants within an accept- able range, the primary focus of subsequent analyses was based upon this version of the TAI-G. However, post hoc analyses for the 17 item model resulted in virtually identical findings. Demograp hi c Analyses Two-Way Multivariate Analyses of Variance (MANOVA) was used to examine sex differences, grade level differences, and the sex × grade level interaction on TAI-G scale scores for the student, parent, and teacher samples. The MANOVA results indicated a significant main effect of sex for the TAI-G student sample, Wilks’ Lambda = .92, F (4, 232) = 4.69, p = .001, 2 η Copyright © 2012 SciRes. 521 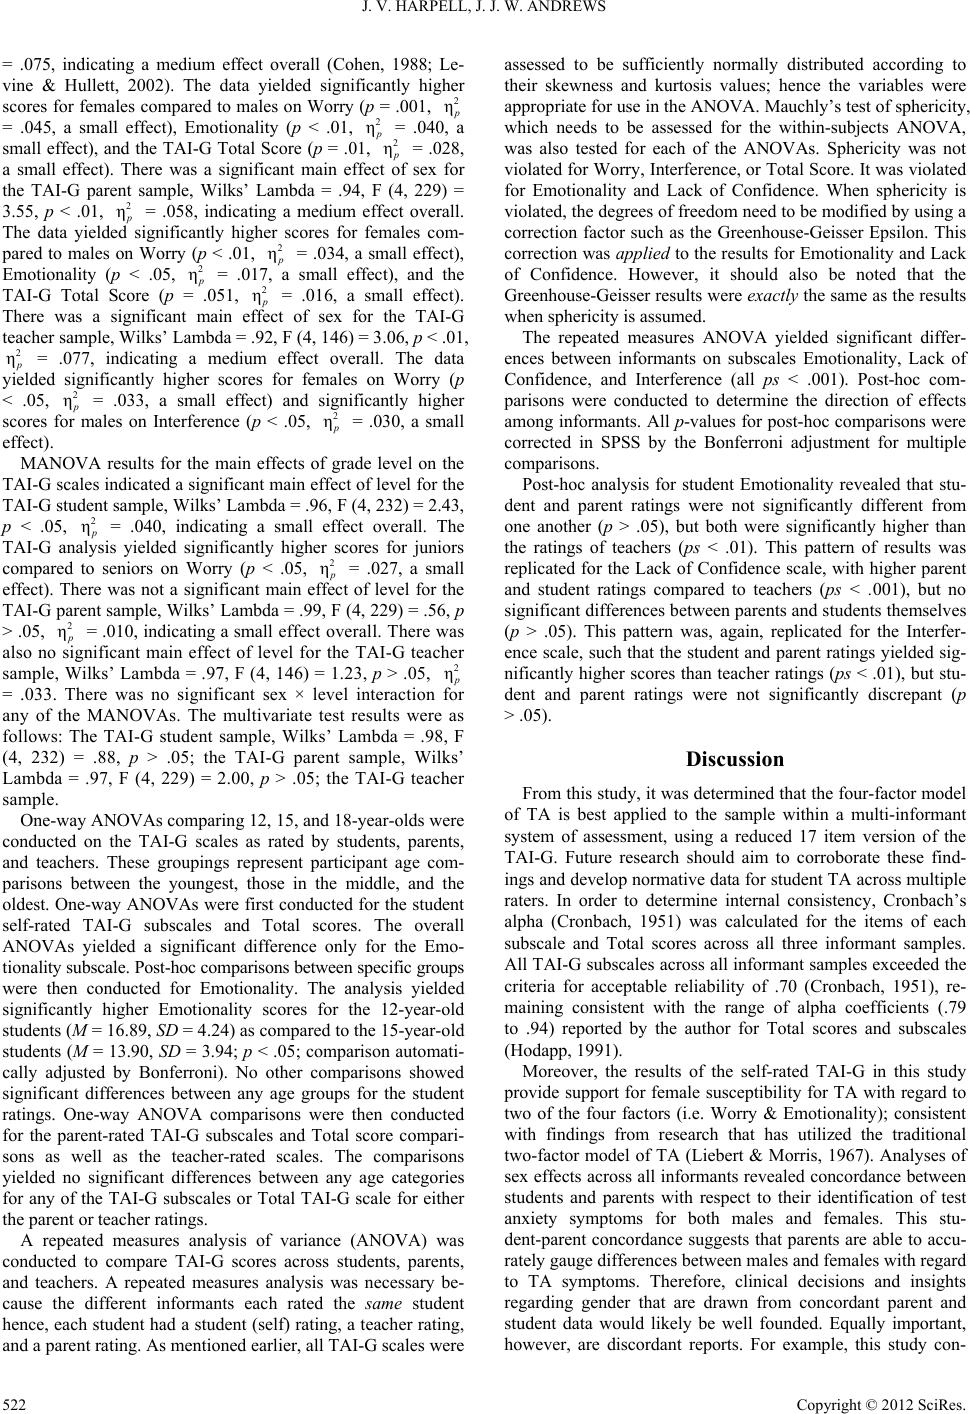 J. V. HARPELL, J. J. W. ANDREWS = .075, indicating a medium effect overall (Cohen, 1988; Le- vine & Hullett, 2002). The data yielded significantly higher scores for females compared to males on Worry (p = .001, 2 η = .045, a small effect), Emotionality (p < .01, 2 η = .040, a small effect), and the TAI-G Total Score (p = .01, 2 η = .028, a small effect). There was a significant main effect of sex for the TAI-G parent sample, Wilks’ Lambda = .94, F (4, 229) = 3.55, p < .01, 2 η = .058, indicating a medium effect overall. The data yielded significantly higher scores for females com- pared to males on Worry (p < .01, 2 η = .034, a small effect), Emotionality (p < .05, 2 η = .017, a small effect), and the TAI-G Total Score (p = .051, 2 η = .016, a small effect). There was a significant main effect of sex for the TAI-G teacher sample, Wilks’ Lambda = .92, F (4, 146) = 3.06, p < .01, 2 η = .077, indicating a medium effect overall. The data yielded significantly higher scores for females on Worry (p < .05, 2 η = .033, a small effect) and significantly higher scores for males on Interference (p < .05, 2 η = .030, a small effect). MANOVA results for the main effects of grade level on the TAI-G scales indicated a significant main effect of level for the TAI-G student sample, Wilks’ Lambda = .96, F (4, 232) = 2.43, p < .05, 2 η = .040, indicating a small effect overall. The TAI-G analysis yielded significantly higher scores for juniors compared to seniors on Worry (p < .05, 2 η = .027, a small effect). There was not a significant main effect of level for the TAI-G parent sample, Wilks’ Lambda = .99, F (4, 229) = .56, p > .05, 2 η = .010, indicating a small effect overall. There was also no significant main effect of level for the TAI-G teacher sample, Wilks’ Lambda = .97, F (4, 146) = 1.23, p > .05, 2 η = .033. There was no significant sex × level interaction for any of the MANOVAs. The multivariate test results were as follows: The TAI-G student sample, Wilks’ Lambda = .98, F (4, 232) = .88, p > .05; the TAI-G parent sample, Wilks’ Lambda = .97, F (4, 229) = 2.00, p > .05; the TAI-G teacher sample. One-way ANOVAs comparing 12, 15, and 18-year-olds were conducted on the TAI-G scales as rated by students, parents, and teachers. These groupings represent participant age com- parisons between the youngest, those in the middle, and the oldest. One-way ANOVAs were first conducted for the student self-rated TAI-G subscales and Total scores. The overall ANOVAs yielded a significant difference only for the Emo- tionality subscale. Post-hoc comparisons between specific groups were then conducted for Emotionality. The analysis yielded significantly higher Emotionality scores for the 12-year-old students (M = 16.89, SD = 4.24) as compared to the 15-year-old students (M = 13.90, SD = 3.94; p < .05; comparison automati- cally adjusted by Bonferroni). No other comparisons showed significant differences between any age groups for the student ratings. One-way ANOVA comparisons were then conducted for the parent-rated TAI-G subscales and Total score compari- sons as well as the teacher-rated scales. The comparisons yielded no significant differences between any age categories for any of the TAI-G subscales or Total TAI-G scale for either the parent or teacher ratings. A repeated measures analysis of variance (ANOVA) was conducted to compare TAI-G scores across students, parents, and teachers. A repeated measures analysis was necessary be- cause the different informants each rated the same student hence, each student had a student (self) rating, a teacher rating, and a parent rating. As mentioned earlier, all TAI-G scales were assessed to be sufficiently normally distributed according to their skewness and kurtosis values; hence the variables were appropriate for use in the ANOVA. Mauchly’s test of sphericity, which needs to be assessed for the within-subjects ANOVA, was also tested for each of the ANOVAs. Sphericity was not violated for Worry, Interference, or Total Score. It was violated for Emotionality and Lack of Confidence. When sphericity is violated, the degrees of freedom need to be modified by using a correction factor such as the Greenhouse-Geisser Epsilon. This correction was applied to the results for Emotionality and Lack of Confidence. However, it should also be noted that the Greenhouse-Geisser results were exactly the same as the results when sphericity is assumed. The repeated measures ANOVA yielded significant differ- ences between informants on subscales Emotionality, Lack of Confidence, and Interference (all ps < .001). Post-hoc com- parisons were conducted to determine the direction of effects among informants. All p-values for post-hoc comparisons were corrected in SPSS by the Bonferroni adjustment for multiple comparisons. Post-hoc analysis for student Emotionality revealed that stu- dent and parent ratings were not significantly different from one another (p > .05), but both were significantly higher than the ratings of teachers (ps < .01). This pattern of results was replicated for the Lack of Confidence scale, with higher parent and student ratings compared to teachers (ps < .001), but no significant differences between parents and students themselves (p > .05). This pattern was, again, replicated for the Interfer- ence scale, such that the student and parent ratings yielded sig- nificantly higher scores than teacher ratings (ps < .01), but stu- dent and parent ratings were not significantly discrepant (p > .05). Discussion From this study, it was determined that the four-factor model of TA is best applied to the sample within a multi-informant system of assessment, using a reduced 17 item version of the TAI-G. Future research should aim to corroborate these find- ings and develop normative data for student TA across multiple raters. In order to determine internal consistency, Cronbach’s alpha (Cronbach, 1951) was calculated for the items of each subscale and Total scores across all three informant samples. All TAI-G subscales across all informant samples exceeded the criteria for acceptable reliability of .70 (Cronbach, 1951), re- maining consistent with the range of alpha coefficients (.79 to .94) reported by the author for Total scores and subscales (Hodapp, 1991). Moreover, the results of the self-rated TAI-G in this study provide support for female susceptibility for TA with regard to two of the four factors (i.e. Worry & Emotionality); consistent with findings from research that has utilized the traditional two-factor model of TA (Liebert & Morris, 1967). Analyses of sex effects across all informants revealed concordance between students and parents with respect to their identification of test anxiety symptoms for both males and females. This stu- dent-parent concordance suggests that parents are able to accu- rately gauge differences between males and females with regard to TA symptoms. Therefore, clinical decisions and insights regarding gender that are drawn from concordant parent and student data would likely be well founded. Equally important, however, are discordant reports. For example, this study con- Copyright © 2012 SciRes. 522  J. V. HARPELL, J. J. W. ANDREWS tributes the unique, and unexpected, finding associated with teacher endorsement of male susceptibility to symptoms of Cognitive Interference. This is interesting because teachers provide the only analysis of TA symptoms that is based on first-hand observation, as well as a perspective that has never been studied in the field of TA. The possibility that males are more prone than females to developing Cognitive Interference represents a major shift from the traditional association between females and anxiety in general. Such discordant information is also very important in clinical practice, as it can be used as an indicator of possible informant biases such as self-preservation, avoidance, and resistance relative to their ratings. Results associated with age and grade level provided sub- stantiation of the four-factor model of TA across a sample of English speaking adolescents. Previous research substantiating the four-factor model was conducted on mixed age groups of American and German samples in different educational envi- ronments. The results of the student self-rated TAI-G analysis revealed that the youngest students demonstrated higher Emo- tionality compared to those in their mid-teens. The oldest teens, however, demonstrated higher Lack of Confidence compared to students in their mid-teens. For the Emotionality and Lack of Confidence factors, 12-year-old and 18-year-old students dem- onstrated no significant differences. The results suggest that early adolescence, as well as late adolescence represent periods that may render students particularly susceptible to developing Emotionality and Lack of Confidence (e.g., onset of adoles- cence, higher academic demands, and career decisions). This study also examined performance variation as a function of educational level (junior high vs. senior high) on the TAI-G across student, parent, and teacher samples. Main effects were only noted within the student samples, with significantly higher TAI-G Worry scores for junior high students compared to sen- ior high students. These results suggest that test-related Worry, compared to the other factors, should be given particular atten- tion, and that it should likely be attended to from an early age. Studies do suggest that TA increases slowly in the early school years, then levels off and eventually decreases in later school years. Studies vary, however, with regard to exactly when this occurs. Hembree (1998) suggested that a sharp increase occurs at grades 3 to 5, stabilizes in secondary school, and decreases in college. The data in the current study suggests that junior high students experience failure focused thoughts (i.e., Worry) to a greater degree than high school students when it comes to test- ing. This finding appears to corroborate a study by Manly and Rosemire (1972), which suggested that TA prevalence is high- est at the junior high level compared to senior high. TAI-G factor scores also varied as a function of Informant. With Emotionality, Lack of Confidence, and Interference, stu- dent and parent ratings were not significantly different from one another, however, the student and parent ratings were sig- nificantly higher than the teacher ratings. Since parents and students demonstrated more concordance across TA factors compared to teacher reports, it appears likely that students and parents are better reporters of TA symptomatology in three of four factor categories. However, teachers, students, and parents demonstrated concordance with regard to reporting student Worry. That Worry is considered the most robust of the four factors, it is clinically significant that all informants gauged this factor concordantly. Knowing that all informants, on average, recognize and endorse Worry in a consistent manner can en- hance clinical judgment relative to discordant reports. Conclusion This study contributes to the theory, extant empirical litera- ture, and practices related to TA. From a theoretical perspective, a valuable contribution is extended toward the substantiation of the four-factor model within a multi-informant framework of TA assessment. Empirically, this study substantiates and ex- tends claims made with regard to TA ratings as a function of demographic variables of gender, age, and grade level. Ulti- mately, this study supports further investigations and use of a multi-informant assessment system of TA. REFERENCES Angold, A., Weissman, M. M., John, K., Merikangas, K. R., Prusoff, B. A., Wickramaratne, P., Gammon, G. D., & Warner, V. (1987). Parent and child reports of depressive symptoms in children at low and high risk of depression. Journal of Child Psychology and Psychiatry, and Allied Disciplines, 28, 901-915. doi:10.1111/j.1469-7610.1987.tb00678.x Bachman, L. (2004). Statistical analyses for language assessment. Cambridge: Cambridge University Press. doi:10.1017/CBO9780511667350 Browne, M. W., & Cudeck, R. (1993). Alternative ways of assessing model fit. In K. A. Bollen, & J. S. Long (Eds.), Testing structural equation models (pp. 136-162). Beverly Hills, CA: Sage. Brown-Jacobsen, A. M., Wallace, D. P., & Whiteside, S. P. H. (2010). Multimethod, multi-informant agreement, and positive predictive value in the identification of child anxiety disorders using the SCAS and ADIS-C. Assessment, 18, 382-392. Byrne, B. M. (2001). Structural equation modeling with AMOS: Basic concepts, applications and programming. Mahway, NJ: Lawrence Erlbaum Associates. Carver, C. S., & Scheier, M. F. (1984). Self-focused attention in test- anxiety: A general theory applied to a specific phenomenon. In H. M. van der Ploeg, R. Schwartzer, & C. D. Spielberger (Eds.), Advances in test anxiety research (pp. 3-20). Lisse: Swets & Zeitlinger. Comer, J. S., & Kendall, P. C. (2004). A symptom-level examination of parent-child agreement in the diagnosis of anxious youths. Journal of the American Academy of Child & Adolescent Psychiatry, 43, 878- 886. doi:10.1097/01.chi.0000125092.35109.c5 Cronbach, L. J. (1951). Coefficient alpha and the internal structure of tests. Psychometrika, 16, 297-334. doi:10.1007/BF02310555 Deffenbacher, J. L. (1980). Worry and emotionality in test anxiety. In I. G. Sarason (Ed.), Test anxiety: Theory, research and application. Hillsdale, New Jersey: Erlbaum. Edelbrock, C., Costello, A. J., Dulcan, M. K., Conover, N. C., & Kalas, R. (1986). Parent-child agreement on child psychiatric symptoms assessed via structured interview. Journal of Child Psychology and Psychiatry, 27, 181-190. Grills, A. E., & Ollendick, T. H. (2003). Multiple informant agreement and the anxiety disorders interview schedule for parents and children. Journal of the American Academy of Child & Adolescent Psychiatry, 42, 30-40. doi:10.1097/00004583-200301000-00008 Hembree, R. (1988). Correlates, causes, effects, and treatment of test anxiety. Review of Educational Research, 58, 47-77. Hodapp, V. (1991). Das Prufungsangstlichkeitsinventar TAI-G: Eine erweiterte und modifizierte Version mit vier Komponenten [The Test Anxiety Inventory TAI-G: An extended and modified version with four components]. Zeitschrift fur Padagogische Psychologie, 5, 121- 130. Hodapp, V. (1995). The TAI-G: A multidimensional approach to the assessment of test anxiety. In C. Schwarzer, & M. Zeidner (Eds.), Stress, anxiety, and coping in academic settings (pp. 95-130). Tub- ingen: Francke,. Hodapp, V., & Benson, J. (1997).The multidimensionality of test anxi- ety: A test of different models. Anxiety, Stress and Coping, 10, 219- 244. doi:10.1080/10615809708249302 Hu, L., & Bentler, P. M. (1999). Cutoff criteria for fit indexes in co- Copyright © 2012 SciRes. 523  J. V. HARPELL, J. J. W. ANDREWS Copyright © 2012 SciRes. 524 variance structure analysis: Conventional criteria versus new alterna- tives. Structural Equation Modeling, 6, 1-55. doi:10.1080/10705519909540118 Jensen, P. S., Rubio-Stipec, M., Canino, G., Bird, H. R., Duncan, M. K., Schwab-Stone, M. E. et al. (1999). Parent and child contributions to diagnosis of mental disorder: Are both informants always necessary? Journal of the American Academy of Child and Adolescent Psychia- try, 38, 1569-1579. doi:10.1097/00004583-199912000-00019 Jewish Family Services (2004). Family front and centre: Anxiety. Health Agency of Canada. http://www.publichealth.gc.ca Kazdin, A. E. (1986). Research designs and methodology. In S. Gar- field, & A. Bergin (Eds.), Handbook of psychotherapy and behavior change. New York: Wiley. Keith, N., Hodapp, V., Schermelleh-Engel, K., & Moosbrugger, H. (2003). Cross-sectional and longitudinal confirmatory factor models for the German Test Anxiety Inventory: A construct validation. Anxiety, Stress, and Coping, 16, 251-270. doi:10.1080/1061580031000095416 Kendall, P. C., & Flannery-Schroeder, E. (1998). Methodological issues in treatment research for anxiety disorders in youth. Journal of the American Academy of Child and Adolescent Psychiatry, 40, 787-794. doi:10.1097/00004583-200107000-00013 Levine, T. R., & Hullett, C. (2002). Eta-square, partial eta-square, and misreporting of effect size in communication research. Human Com- munication Research, 28, 612-625. doi:10.1111/j.1468-2958.2002.tb00828.x Liebert, R. M., & Morris, L. W. (1967). Cognitive and emotional com- ponents of test anxiety: A distinction and some initial data. Psycho- logical Reports, 20, 975-978. doi:10.2466/pr0.1967.20.3.975 Manley, J., & Rosemier, R. (1972). Developmental trends in general and test anxiety among junior and senior high school students. The Journal of Genetic Psychology, 120 , 219-226. McKeachie, W. J. (1984). Does anxiety disrupt information processing or does poor information processing lead to anxiety? International Review of Applied Psychology, 33, 187-203. doi:10.1111/j.1464-0597.1984.tb01428.x Musch, J., & Broder, A. (1999). Psychometrische Eigenschaften und Validitat des multidimensionalen Prufungsangstlichkeitsinventars TAI-G [Psychometric properties and validity of the multidimensional test anxiety inventory TAI-G]. Zeitschrift fur Padagogische Psy- chologie, 13, 100-105. doi:10.1024//1010-0652.13.12.100 Ollendick, T. H. (1986). Child and adolescent behavior therapy. In S. L. Garfield, & A. E. Bergin (Eds.), Handbook of psychotherapy and behaviorchange (pp. 525-564). New York: John Wiley and Sons. Sarason, I. G. (1984). Stress, anxiety, and cognitive interference: Reac- tions to tests. Journal of Personality and Social Psychology, 46, 929- 938. Sarason, S. B., Davidson, K. S., Lughthall, F. F., Waite, R. R., & Rue- bush, B. K. (1960). Anxiety in elementary school children. New York, NY: Wiley. Sarason, S. B., & Mandler, G. (1952). Some correlates of test anxiety. Journal of Consulting and Clin ic al Psychology, 47, 810-817. Shevlin, M., & Miles, J. N. V. (1998). Effects of sample size, model specification and factor loadings on the GFI in confirmatory factor analysis. Personality and Individual Differences, 25, 85-90. doi:10.1016/S0191-8869(98)00055-5 Stober, J. (2004). Dimensions of test anxiety: Relations to ways of coping with pre-exam anxiety and uncertainty. Anxiety, Stress, & Coping, 17, 213-226. doi:10.1080/10615800412331292615 Swanson, S., & Howell, C. (1996). Test anxiety in adolescents with learning disabilities and behavior disorders. Exceptional Children, 62, 389-397. Tyron, G. S. (1980). The measurement and treatment of test anxiety. Review of Educational Research, 50 , 343-372. Wine, J. D. (1971). Test anxiety and direction of attention. Psycho- logical Bulletin, 76, 92-104. doi:10.1037/h0031332 Zeidner, M. (1998). Test anxiety: The state of the art. New York: Ple- num Press.
|