Paper Menu >>
Journal Menu >>
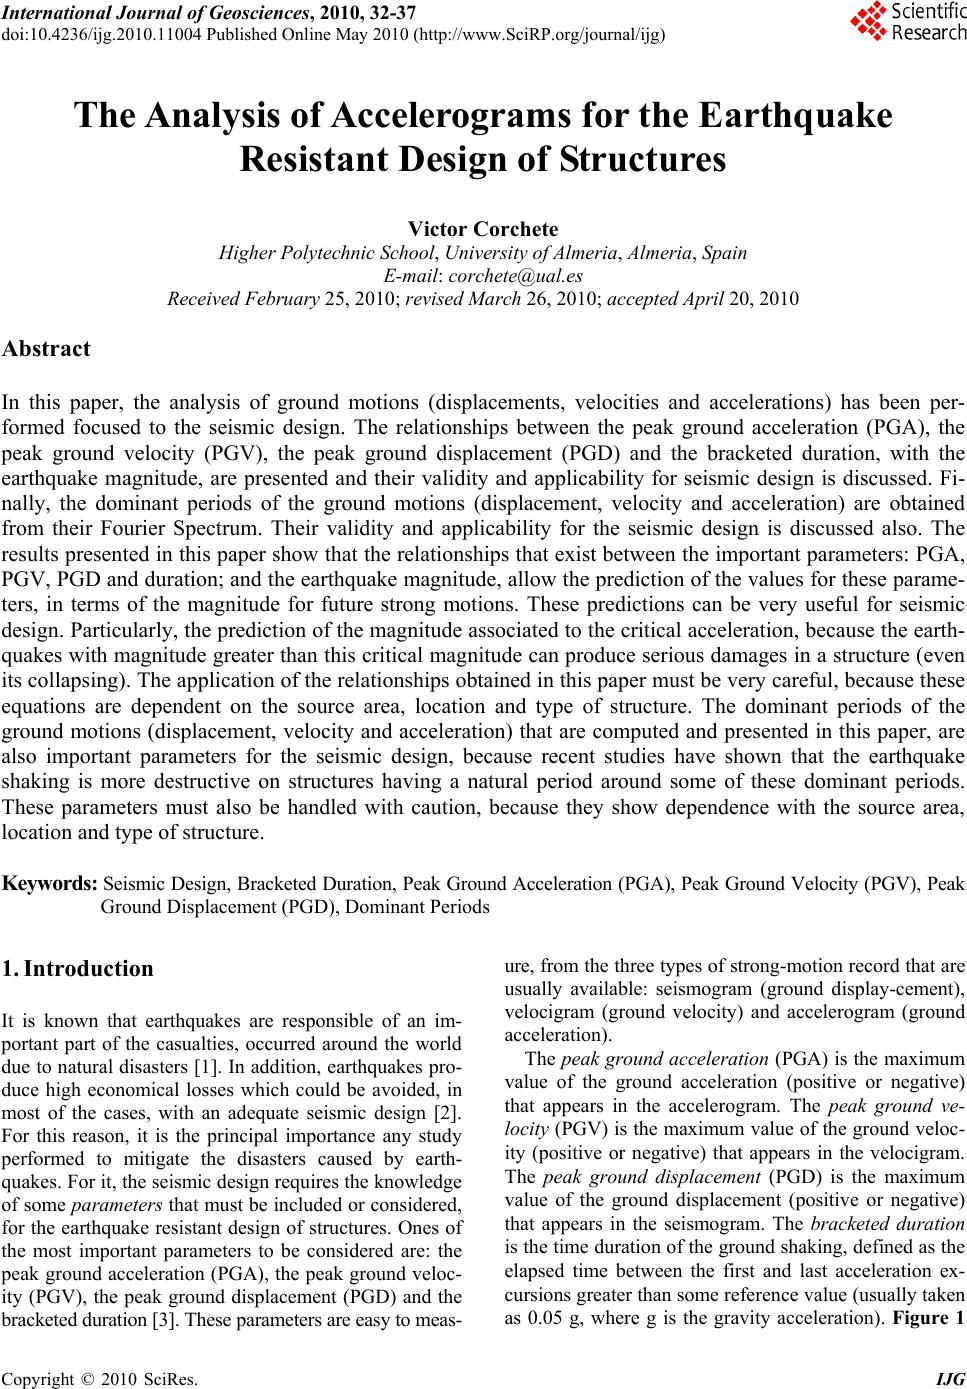 International Journal of Geosciences, 2010, 32-37 doi:10.4236/ijg.2010.11004 Published Online May 2010 (http://www.SciRP.org/journal/ijg) Copyright © 2010 SciRes. IJG The Analysis of Accelerograms for the Earthquake Resistant Design of Structures Victor Corchete Higher Polytechnic School, University of Almeria, Almeria, Spain E-mail: corchete@ual.es Received February 25, 2010; revised March 26, 2010; accepted April 20, 2010 Abstract In this paper, the analysis of ground motions (displacements, velocities and accelerations) has been per- formed focused to the seismic design. The relationships between the peak ground acceleration (PGA), the peak ground velocity (PGV), the peak ground displacement (PGD) and the bracketed duration, with the earthquake magnitude, are presented and their validity and applicability for seismic design is discussed. Fi- nally, the dominant periods of the ground motions (displacement, velocity and acceleration) are obtained from their Fourier Spectrum. Their validity and applicability for the seismic design is discussed also. The results presented in this paper show that the relationships that exist between the important parameters: PGA, PGV, PGD and duration; and the earthquake magnitude, allow the prediction of the values for these parame- ters, in terms of the magnitude for future strong motions. These predictions can be very useful for seismic design. Particularly, the prediction of the magnitude associated to the critical acceleration, because the earth- quakes with magnitude greater than this critical magnitude can produce serious damages in a structure (even its collapsing). The application of the relationships obtained in this paper must be very careful, because these equations are dependent on the source area, location and type of structure. The dominant periods of the ground motions (displacement, velocity and acceleration) that are computed and presented in this paper, are also important parameters for the seismic design, because recent studies have shown that the earthquake shaking is more destructive on structures having a natural period around some of these dominant periods. These parameters must also be handled with caution, because they show dependence with the source area, location and type of structure. Keywords: Seismic Design, Bracketed Duration, Peak Ground Acceleration (PGA), Peak Ground Velocity (PGV), Peak Ground Displacement (PGD), Dominant Periods 1. Introduction It is known that earthquakes are responsible of an im- portant part of the casualties, occurred around the world due to natural disasters [1]. In addition, earthquakes pro- duce high economical losses which could be avoided, in most of the cases, with an adequate seismic design [2]. For this reason, it is the principal importance any study performed to mitigate the disasters caused by earth- quakes. For it, the seismic design requires the knowledge of some parameters that must be included or considered, for the earthquake resistant design of structures. Ones of the most important parameters to be considered are: the peak ground acceleration (PGA), the peak ground veloc- ity (PGV), the peak ground displacement (PGD) and the bracketed duration [3]. These parameters are easy to meas- ure, from the three types of strong-motion record that are usually available: seismogram (ground display-cement), velocigram (ground velocity) and accelerogram (ground acceleration). The peak ground acceleration (PGA) is the maximum value of the ground acceleration (positive or negative) that appears in the accelerogram. The peak ground ve- locity (PGV) is the maximum value of the ground veloc- ity (positive or negative) that appears in the velocigram. The peak ground displacement (PGD) is the maximum value of the ground displacement (positive or negative) that appears in the seismogram. The bracketed duration is the time duration of the ground shaking, defined as the elapsed time between the first and last acceleration ex- cursions greater than some reference value (usually taken as 0.05 g, where g is the gravity acceleration). Figure 1 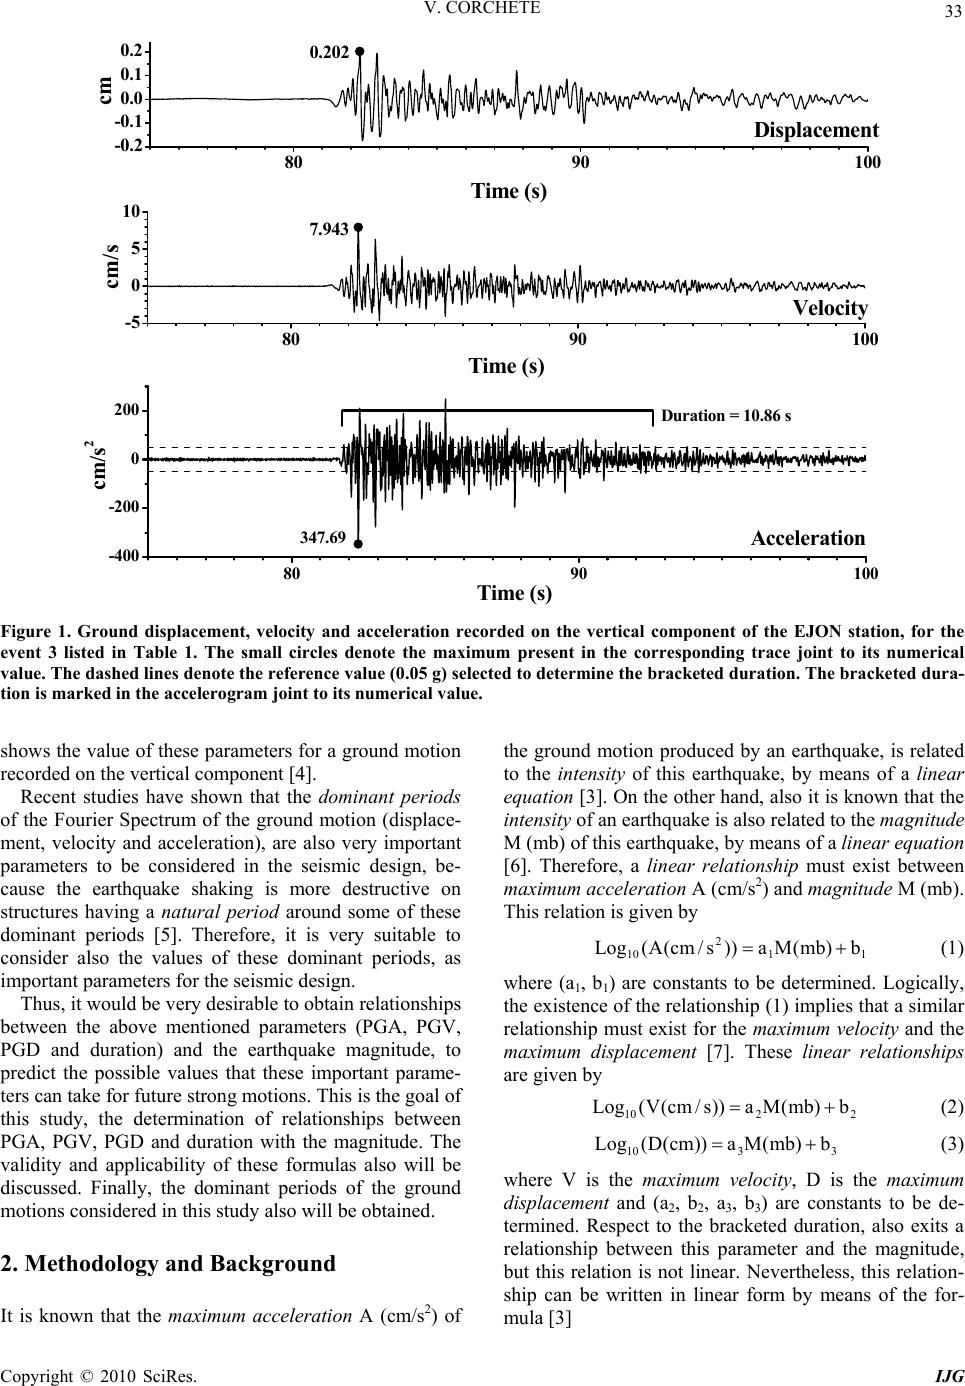 V. CORCHETE Copyright © 2010 SciRes. IJG 33 8090 100 -0.2 -0.1 0.0 0.1 0.2 8090 100 -5 0 5 10 8090 100 -400 -200 0 200 cm Time (s) Displacement 0.202 7.943 cm/s Time (s) Velocity Duration = 10.86 s 347.69 cm/s2 Time (s) Acceleration Figure 1. Ground displacement, velocity and acceleration recorded on the vertical component of the EJON station, for the event 3 listed in Table 1. The small circles denote the maximum present in the corresponding trace joint to its numerical value. The dashed lines denote the reference value (0.05 g) selected to determine the bracketed duration. The bracketed dura- tion is marked in the accelerogram joint to its numerical value. shows the value of these parameters for a ground motion recorded on the vertical component [4]. Recent studies have shown that the dominant periods of the Fourier Spectrum of the ground motion (displace- ment, velocity and acceleration), are also very important parameters to be considered in the seismic design, be- cause the earthquake shaking is more destructive on structures having a natural period around some of these dominant periods [5]. Therefore, it is very suitable to consider also the values of these dominant periods, as important parameters for the seismic design. Thus, it would be very desirable to obtain relationships between the above mentioned parameters (PGA, PGV, PGD and duration) and the earthquake magnitude, to predict the possible values that these important parame- ters can take for future strong motions. This is the goal of this study, the determination of relationships between PGA, PGV, PGD and duration with the magnitude. The validity and applicability of these formulas also will be discussed. Finally, the dominant periods of the ground motions considered in this study also will be obtained. 2. Methodology and Background It is known that the maximum acceleration A (cm/s2) of the ground motion produced by an earthquake, is related to the intensity of this earthquake, by means of a linear equation [3]. On the other hand, also it is known that the intensity of an earthquake is also related to the magnitude M (mb) of this earthquake, by means of a linear equation [6]. Therefore, a linear relationship must exist between maximum acceleration A (cm/s2) and magnitude M (mb). This relation is given by 11 2 10 b)mb(Ma))s/cm(A(Log (1) where (a1, b1) are constants to be determined. Logically, the existence of the relationship (1) implies that a similar relationship must exist for the maximum velocity and the maximum displacement [7]. These linear relationships are given by 2210 b)mb(Ma))s/cm(V(Log (2) 3310 b)mb(Ma))cm(D(Log (3) where V is the maximum velocity, D is the maximum displacement and (a2, b2, a3, b3) are constants to be de- termined. Respect to the bracketed duration, also exits a relationship between this parameter and the magnitude, but this relation is not linear. Nevertheless, this relation- ship can be written in linear form by means of the for- mula [3] 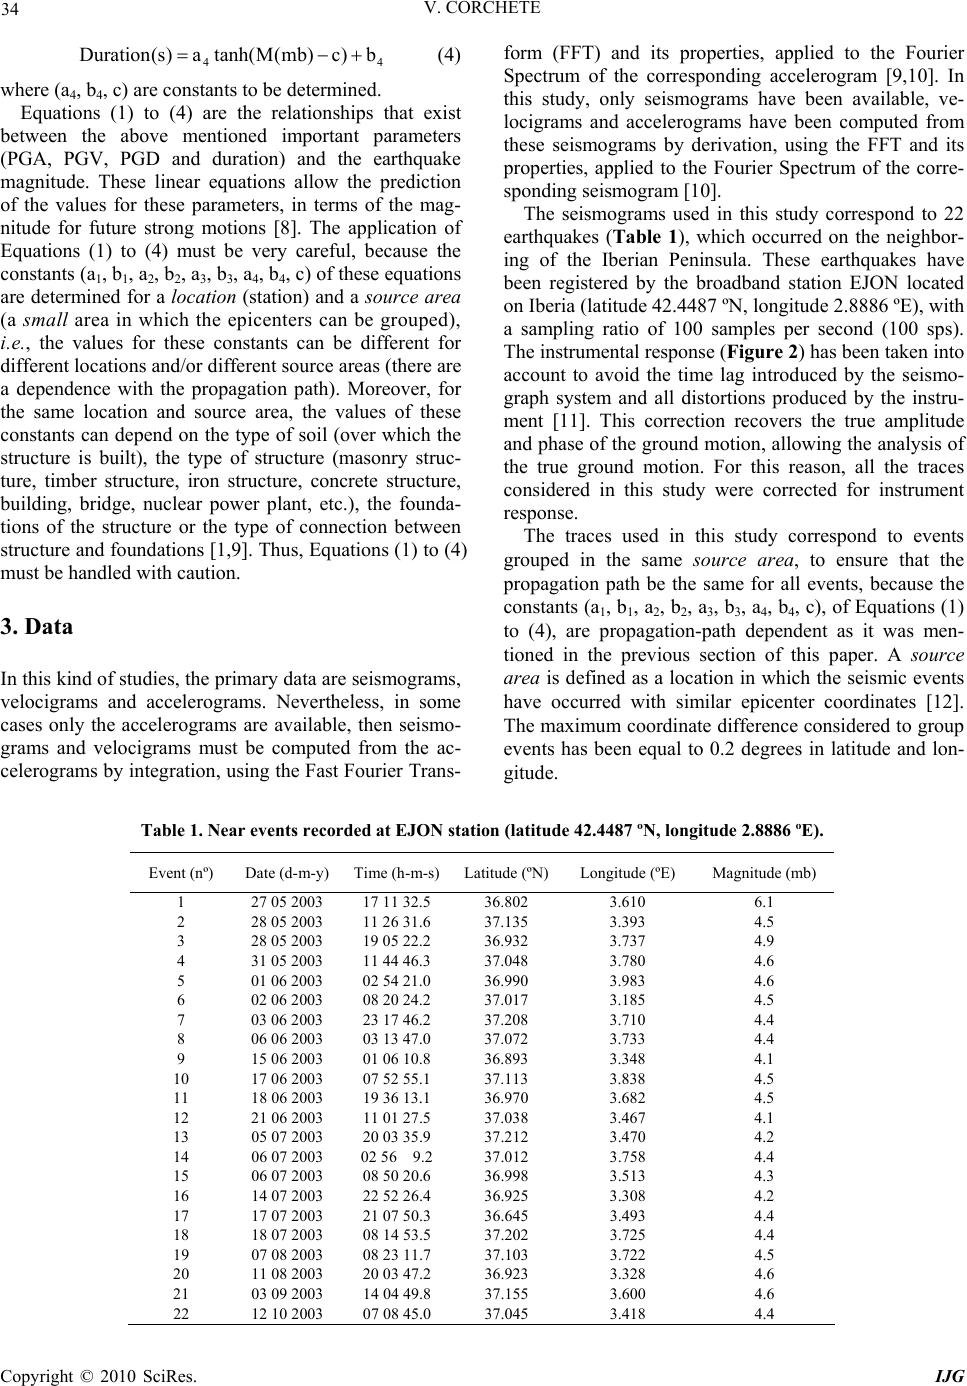 34 V. CORCHETE 44 b)c)mb(Mtanh(a)s(Duration (4) where (a4, b4, c) are constants to be determined. Equations (1) to (4) are the relationships that exist between the above mentioned important parameters (PGA, PGV, PGD and duration) and the earthquake magnitude. These linear equations allow the prediction of the values for these parameters, in terms of the mag- nitude for future strong motions [8]. The application of Equations (1) to (4) must be very careful, because the constants (a1, b1, a2, b2, a3, b3, a4, b4, c) of these equations are determined for a location (station) and a source area (a small area in which the epicenters can be grouped), i.e., the values for these constants can be different for different locations and/or different source areas (there are a dependence with the propagation path). Moreover, for the same location and source area, the values of these constants can depend on the type of soil (over which the structure is built), the type of structure (masonry struc- ture, timber structure, iron structure, concrete structure, building, bridge, nuclear power plant, etc.), the founda- tions of the structure or the type of connection between structure and foundations [1,9]. Thus, Equations (1) to (4) must be handled with caution. 3. Data In this kind of studies, the primary data are seismograms, velocigrams and accelerograms. Nevertheless, in some cases only the accelerograms are available, then seismo- grams and velocigrams must be computed from the ac- celerograms by integration, using the Fast Fourier Trans- form (FFT) and its properties, applied to the Fourier Spectrum of the corresponding accelerogram [9,10]. In this study, only seismograms have been available, ve- locigrams and accelerograms have been computed from these seismograms by derivation, using the FFT and its properties, applied to the Fourier Spectrum of the corre- sponding seismogram [10]. The seismograms used in this study correspond to 22 earthquakes (Table 1), which occurred on the neighbor- ing of the Iberian Peninsula. These earthquakes have been registered by the broadband station EJON located on Iberia (latitude 42.4487 ºN, longitude 2.8886 ºE), with a sampling ratio of 100 samples per second (100 sps). The instrumental response (Figure 2) has been taken into account to avoid the time lag introduced by the seismo- graph system and all distortions produced by the instru- ment [11]. This correction recovers the true amplitude and phase of the ground motion, allowing the analysis of the true ground motion. For this reason, all the traces considered in this study were corrected for instrument response. The traces used in this study correspond to events grouped in the same source area, to ensure that the propagation path be the same for all events, because the constants (a1, b1, a2, b2, a3, b3, a4, b4, c), of Equations (1) to (4), are propagation-path dependent as it was men- tioned in the previous section of this paper. A source area is defined as a location in which the seismic events have occurred with similar epicenter coordinates [12]. The maximum coordinate difference considered to group events has been equal to 0.2 degrees in latitude and lon- gitude. Table 1. Near events recorded at EJON station (latitude 42.4487 ºN, longitude 2.8886 ºE). Event (nº) Date (d-m-y) Time (h-m-s)Latitude (ºN)Longitude (ºE) Magnitude (mb) 1 27 05 2003 17 11 32.5 36.802 3.610 6.1 2 28 05 2003 11 26 31.6 37.135 3.393 4.5 3 28 05 2003 19 05 22.2 36.932 3.737 4.9 4 31 05 2003 11 44 46.3 37.048 3.780 4.6 5 01 06 2003 02 54 21.0 36.990 3.983 4.6 6 02 06 2003 08 20 24.2 37.017 3.185 4.5 7 03 06 2003 23 17 46.2 37.208 3.710 4.4 8 06 06 2003 03 13 47.0 37.072 3.733 4.4 9 15 06 2003 01 06 10.8 36.893 3.348 4.1 10 17 06 2003 07 52 55.1 37.113 3.838 4.5 11 18 06 2003 19 36 13.1 36.970 3.682 4.5 12 21 06 2003 11 01 27.5 37.038 3.467 4.1 13 05 07 2003 20 03 35.9 37.212 3.470 4.2 14 06 07 2003 02 56 9.2 37.012 3.758 4.4 15 06 07 2003 08 50 20.6 36.998 3.513 4.3 16 14 07 2003 22 52 26.4 36.925 3.308 4.2 17 17 07 2003 21 07 50.3 36.645 3.493 4.4 18 18 07 2003 08 14 53.5 37.202 3.725 4.4 19 07 08 2003 08 23 11.7 37.103 3.722 4.5 20 11 08 2003 20 03 47.2 36.923 3.328 4.6 21 03 09 2003 14 04 49.8 37.155 3.600 4.6 22 12 10 2003 07 08 45.0 37.045 3.418 4.4 Copyright © 2010 SciRes. IJG 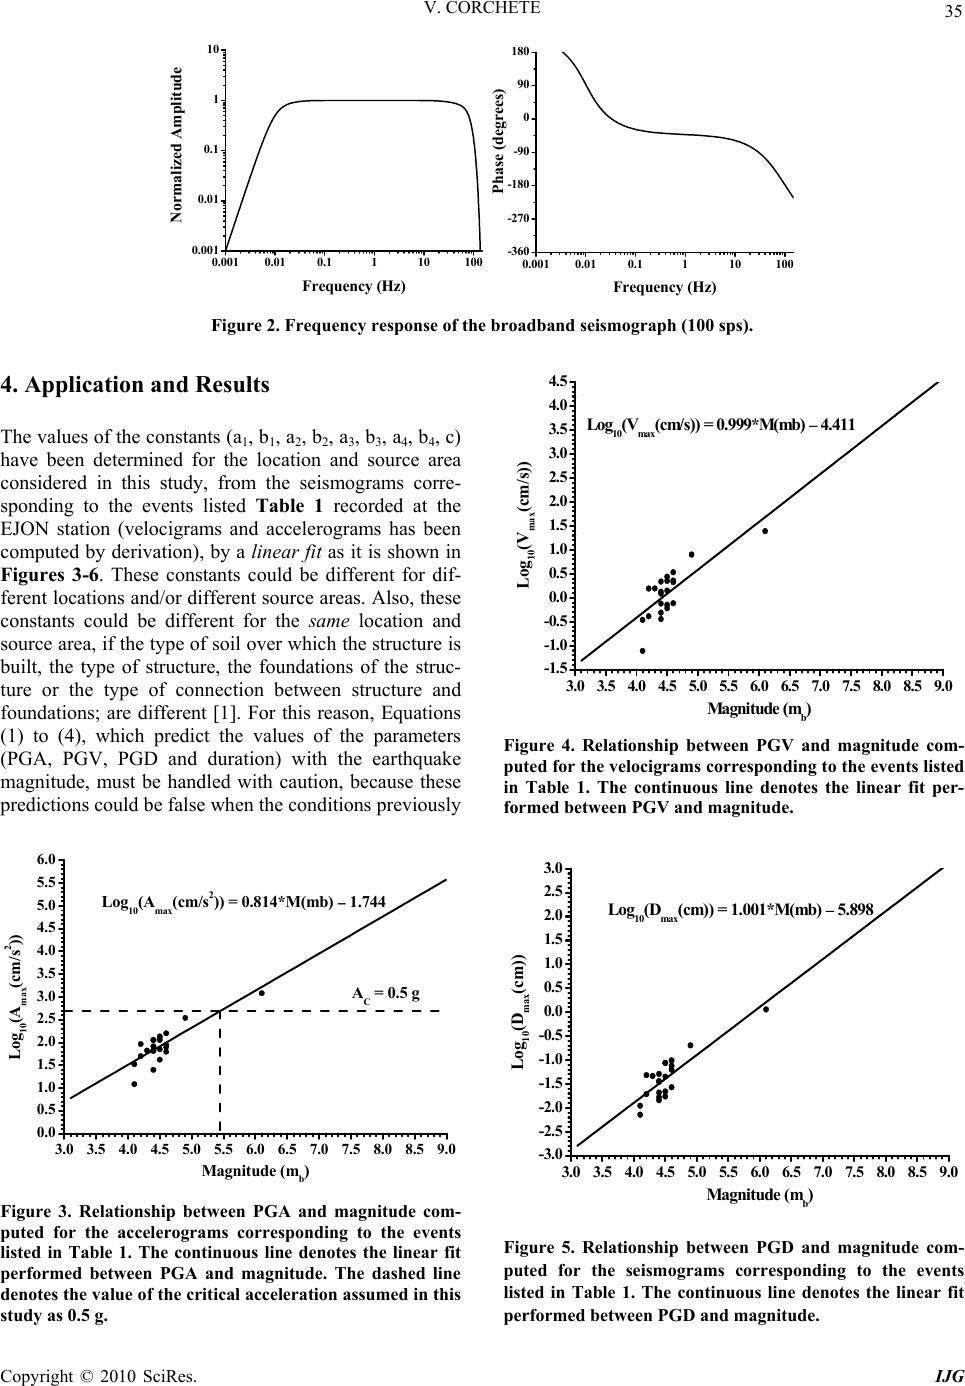 V. CORCHETE 35 0.001 0.010.1110100 0.001 0.01 0.1 1 10 0.001 0.010.1110100 -360 -270 -180 -90 0 90 180 Normalized Amplitude Frequency (Hz) Phase (degrees) Frequency (Hz) Figure 2. Frequency response of the broadband seismograph (100 sps). 4. Application and Results The values of the constants (a1, b1, a2, b2, a3, b3, a4, b4, c) have been determined for the location and source area considered in this study, from the seismograms corre- sponding to the events listed Table 1 recorded at the EJON station (velocigrams and accelerograms has been computed by derivation), by a linear fit as it is shown in Figures 3-6. These constants could be different for dif- ferent locations and/or different source areas. Also, these constants could be different for the same location and source area, if the type of soil over which the structure is built, the type of structure, the foundations of the struc- ture or the type of connection between structure and foundations; are different [1]. For this reason, Equations (1) to (4), which predict the values of the parameters (PGA, PGV, PGD and duration) with the earthquake magnitude, must be handled with caution, because these predictions could be false when the conditions previously 3.0 3.5 4.0 4.5 5.0 5.5 6.0 6.5 7.0 7.5 8.0 8.5 9.0 0.0 0.5 1.0 1.5 2.0 2.5 3.0 3.5 4.0 4.5 5.0 5.5 6.0 Log10(Amax(cm/s2)) Magnitude (mb) Log10(Amax(cm/s2)) = 0.814*M(mb) 1.744 AC = 0.5 g Figure 3. Relationship between PGA and magnitude com- puted for the accelerograms corresponding to the events listed in Table 1. The continuous line denotes the linear fit performed between PGA and magnitude. The dashed line denotes the value of the critical acceleration assumed in this study as 0.5 g. 3.03.54.04.55.05.56.06.57.07.58.08.59.0 -1.5 -1.0 -0.5 0. 0 0. 5 1. 0 1. 5 2. 0 2. 5 3. 0 3. 5 4. 0 4. 5 Log10(Vmax(cm/s)) Magnitude (m b ) Log10(Vmax(cm/s)) = 0.999*M(mb) 4.411 Figure 4. Relationship between PGV and magnitude com- puted for the velocigrams corresponding to the events listed in Table 1. The continuous line denotes the linear fit per- formed between PGV and magnitude. 3.03.54.04.55.05.56.06.57.07.58.08.59.0 -3.0 -2.5 -2.0 -1.5 -1.0 -0.5 0.0 0.5 1.0 1.5 2.0 2.5 3. 0 Log10(Dmax(cm)) Magnitude (mb) Log10(Dmax(cm)) = 1.001*M(mb) 5.898 Figure 5. Relationship between PGD and magnitude com- puted for the seismograms corresponding to the events listed in Table 1. The continuous line denotes the linear fit performed between PGD and magnitude. Copyright © 2010 SciRes. IJG 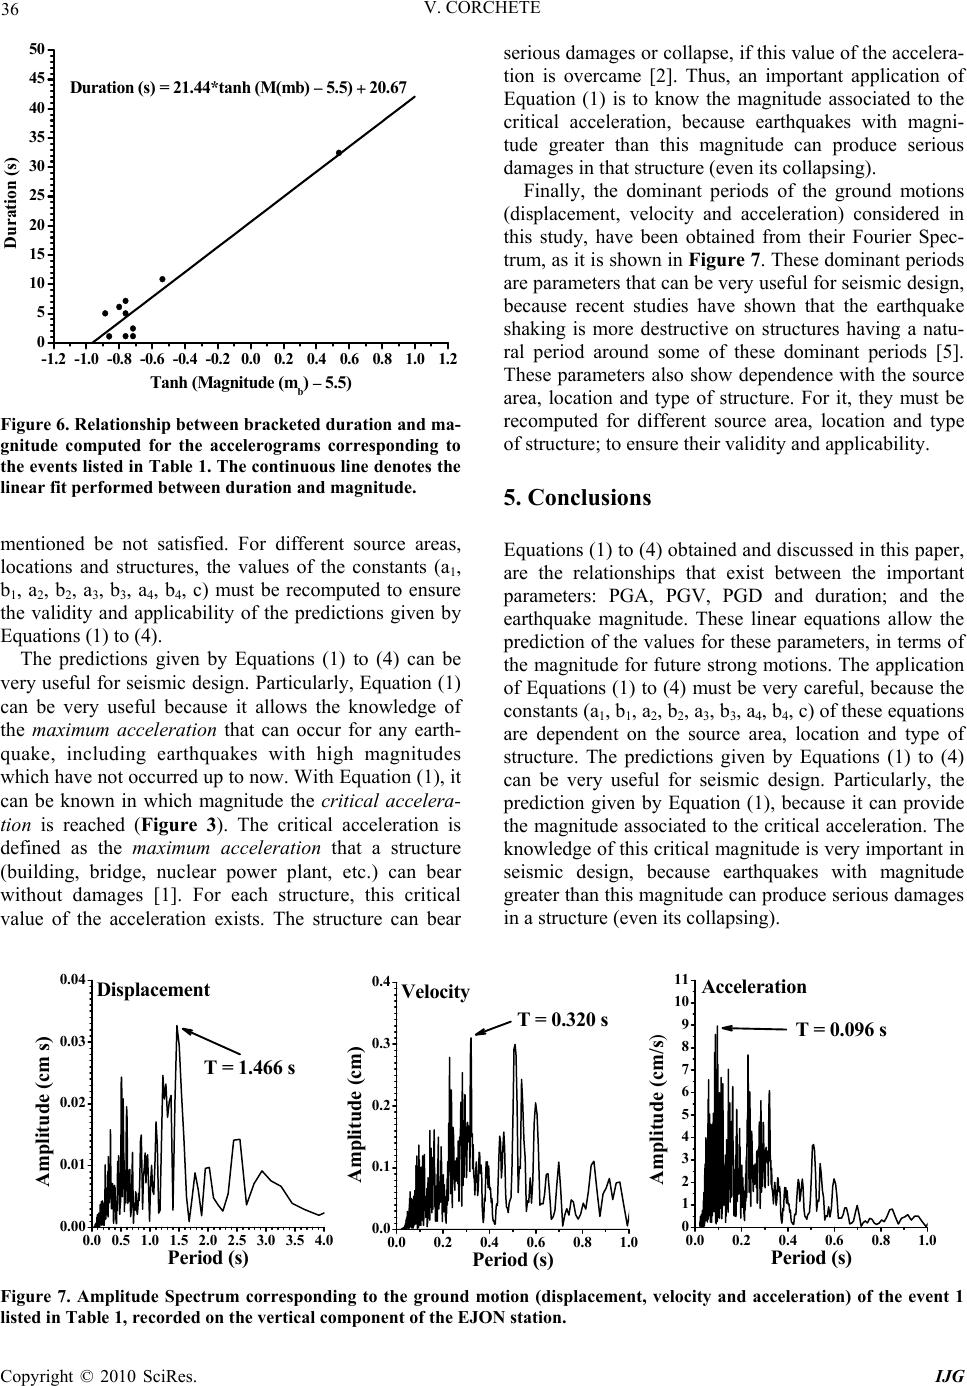 36 V. CORCHETE -1.2-1.0-0.8-0.6-0.4-0.20.0 0.2 0.4 0.6 0.8 1.0 1.2 0 5 10 15 20 25 30 35 40 45 50 Duration (s) Tanh (Magnitude (mb) 5.5) Duration (s) = 21.44*tanh (M(mb) 5.5) 20.67 Figure 6. Relationship between bracketed duration and ma- gnitude computed for the accelerograms corresponding to the events listed in Table 1. The continuous line denotes the linear fit performed between duration and magnitude. mentioned be not satisfied. For different source areas, locations and structures, the values of the constants (a1, b1, a2, b2, a3, b3, a4, b4, c) must be recomputed to ensure the validity and applicability of the predictions given by Equations (1) to (4). The predictions given by Equations (1) to (4) can be very useful for seismic design. Particularly, Equation (1) can be very useful because it allows the knowledge of the maximum acceleration that can occur for any earth- quake, including earthquakes with high magnitudes which have not occurred up to now. With Equation (1), it can be known in which magnitude the critical accelera- tion is reached (Figure 3). The critical acceleration is defined as the maximum acceleration that a structure (building, bridge, nuclear power plant, etc.) can bear without damages [1]. For each structure, this critical value of the acceleration exists. The structure can bear serious damages or collapse, if this value of the accelera- tion is overcame [2]. Thus, an important application of Equation (1) is to know the magnitude associated to the critical acceleration, because earthquakes with magni- tude greater than this magnitude can produce serious damages in that structure (even its collapsing). Finally, the dominant periods of the ground motions (displacement, velocity and acceleration) considered in this study, have been obtained from their Fourier Spec- trum, as it is shown in Figure 7. These dominant periods are parameters that can be very useful for seismic design, because recent studies have shown that the earthquake shaking is more destructive on structures having a natu- ral period around some of these dominant periods [5]. These parameters also show dependence with the source area, location and type of structure. For it, they must be recomputed for different source area, location and type of structure; to ensure their validity and applicability. 5. Conclusions Equations (1) to (4) obtained and discussed in this paper, are the relationships that exist between the important parameters: PGA, PGV, PGD and duration; and the earthquake magnitude. These linear equations allow the prediction of the values for these parameters, in terms of the magnitude for future strong motions. The application of Equations (1) to (4) must be very careful, because the constants (a1, b1, a2, b2, a3, b3, a4, b4, c) of these equations are dependent on the source area, location and type of structure. The predictions given by Equations (1) to (4) can be very useful for seismic design. Particularly, the prediction given by Equation (1), because it can provide the magnitude associated to the critical acceleration. The knowledge of this critical magnitude is very important in seismic design, because earthquakes with magnitude greater than this magnitude can produce serious damages in a structure (even its collapsing). 0.0 0.5 1.0 1.5 2.0 2.5 3.0 3.5 4.0 0.00 0.01 0.02 0.03 0.04 0.00.20.40.60.81.0 0.0 0.1 0.2 0.3 0.4 0.00.20.40.60.81. 0 1 2 3 4 5 6 7 8 9 10 11 0 Displa cement Amplitude (cm s) Period (s) Veloci ty Amplitude (cm) Period (s) T = 1.466 s T = 0.320 sT = 0.096 s Accelera tio n Amplitude (cm/s) Period (s) Figure 7. Amplitude Spectrum corresponding to the ground motion (displacement, velocity and acceleration) of the event 1 listed in Table 1, recorded on the vertical component of the EJON station. Copyright © 2010 SciRes. IJG 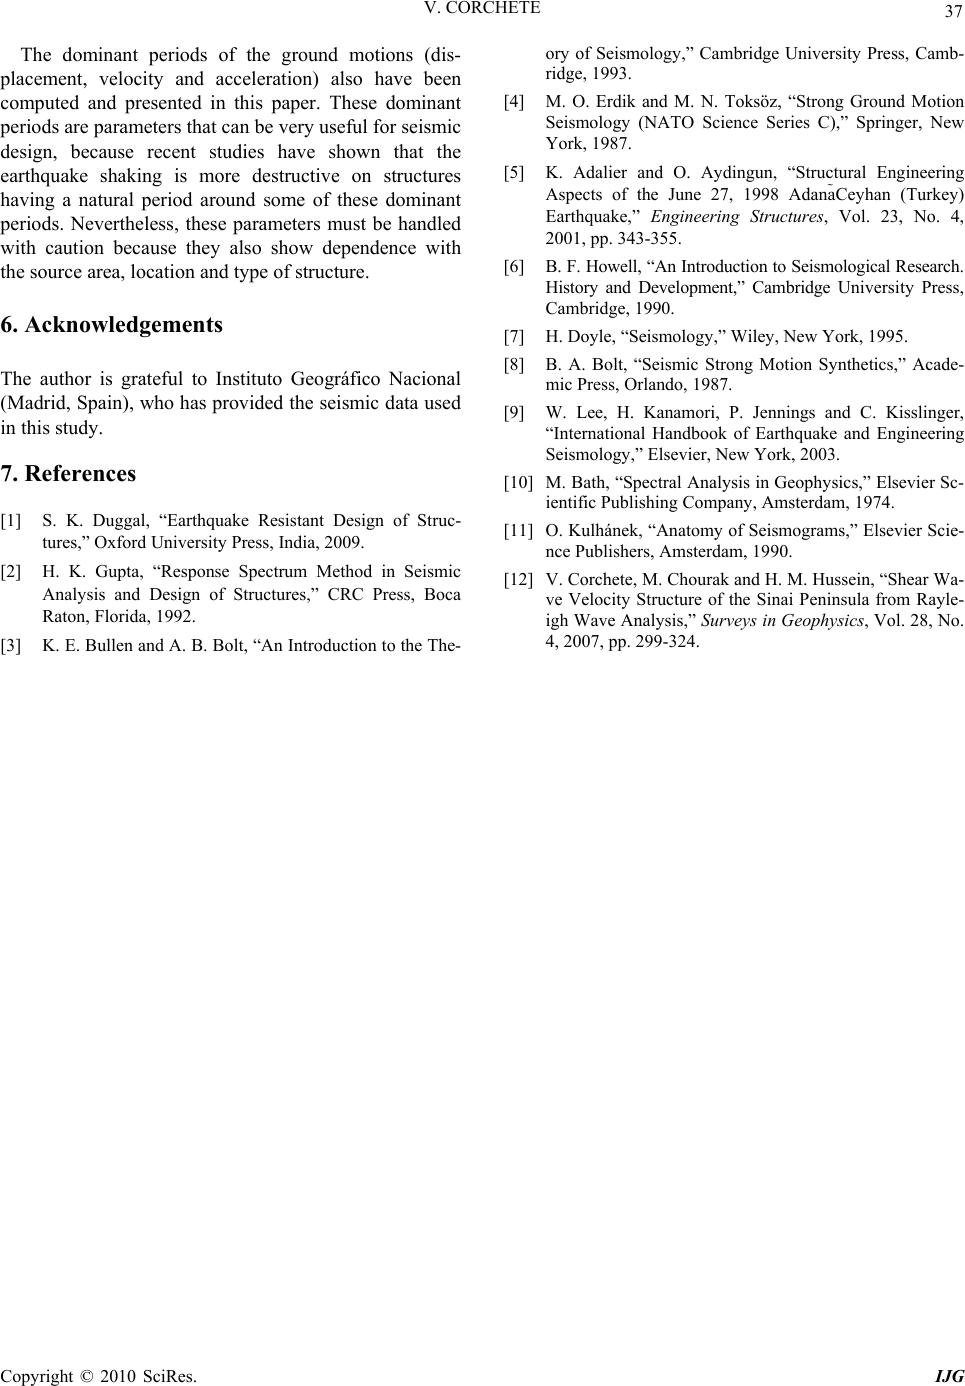 V. CORCHETE Copyright © 2010 SciRes. IJG 37 The dominant periods of the ground motions (dis- placement, velocity and acceleration) also have been computed and presented in this paper. These dominant periods are parameters that can be very useful for seismic design, because recent studies have shown that the earthquake shaking is more destructive on structures having a natural period around some of these dominant periods. Nevertheless, these parameters must be handled with caution because they also show dependence with the source area, location and type of structure. 6. Acknowledgements The author is grateful to Instituto Geográfico Nacional (Madrid, Spain), who has provided the seismic data used in this study. 7. References [1] S. K. Duggal, “Earthquake Resistant Design of Struc- tures,” Oxford University Press, India, 2009. [2] H. K. Gupta, “Response Spectrum Method in Seismic Analysis and Design of Structures,” CRC Press, Boca Raton, Florida, 1992. [3] K. E. Bullen and A. B. Bolt, “An Introduction to the The- ory of Seismology,” Cambridge University Press, Camb- ridge, 1993. [4] M. O. Erdik and M. N. Toksöz, “Strong Ground Motion Seismology (NATO Science Series C),” Springer, New York, 1987. [5] K. Adalier and O. Aydingun, “Structural Engineering Aspects of the June 27, 1998 AdanaCeyhan (Turkey) Earthquake,” Engineering Structures, Vol. 23, No. 4, 2001, pp. 343-355. [6] B. F. Howell, “An Introduction to Seismological Research. History and Development,” Cambridge University Press, Cambridge, 1990. [7] H. Doyle, “Seismology,” Wiley, New York, 1995. [8] B. A. Bolt, “Seismic Strong Motion Synthetics,” Acade- mic Press, Orlando, 1987. [9] W. Lee, H. Kanamori, P. Jennings and C. Kisslinger, “International Handbook of Earthquake and Engineering Seismology,” Elsevier, New York, 2003. [10] M. Bath, “Spectral Analysis in Geophysics,” Elsevier Sc- ientific Publishing Company, Amsterdam, 1974. [11] O. Kulhánek, “Anatomy of Seismograms,” Elsevier Scie- nce Publishers, Amsterdam, 1990. [12] V. Corchete, M. Chourak and H. M. Hussein, “Shear Wa- ve Velocity Structure of the Sinai Peninsula from Rayle- igh Wave Analysis,” Surveys in Geophysics, Vol. 28, No. 4, 2007, pp. 299-324. |