Paper Menu >>
Journal Menu >>
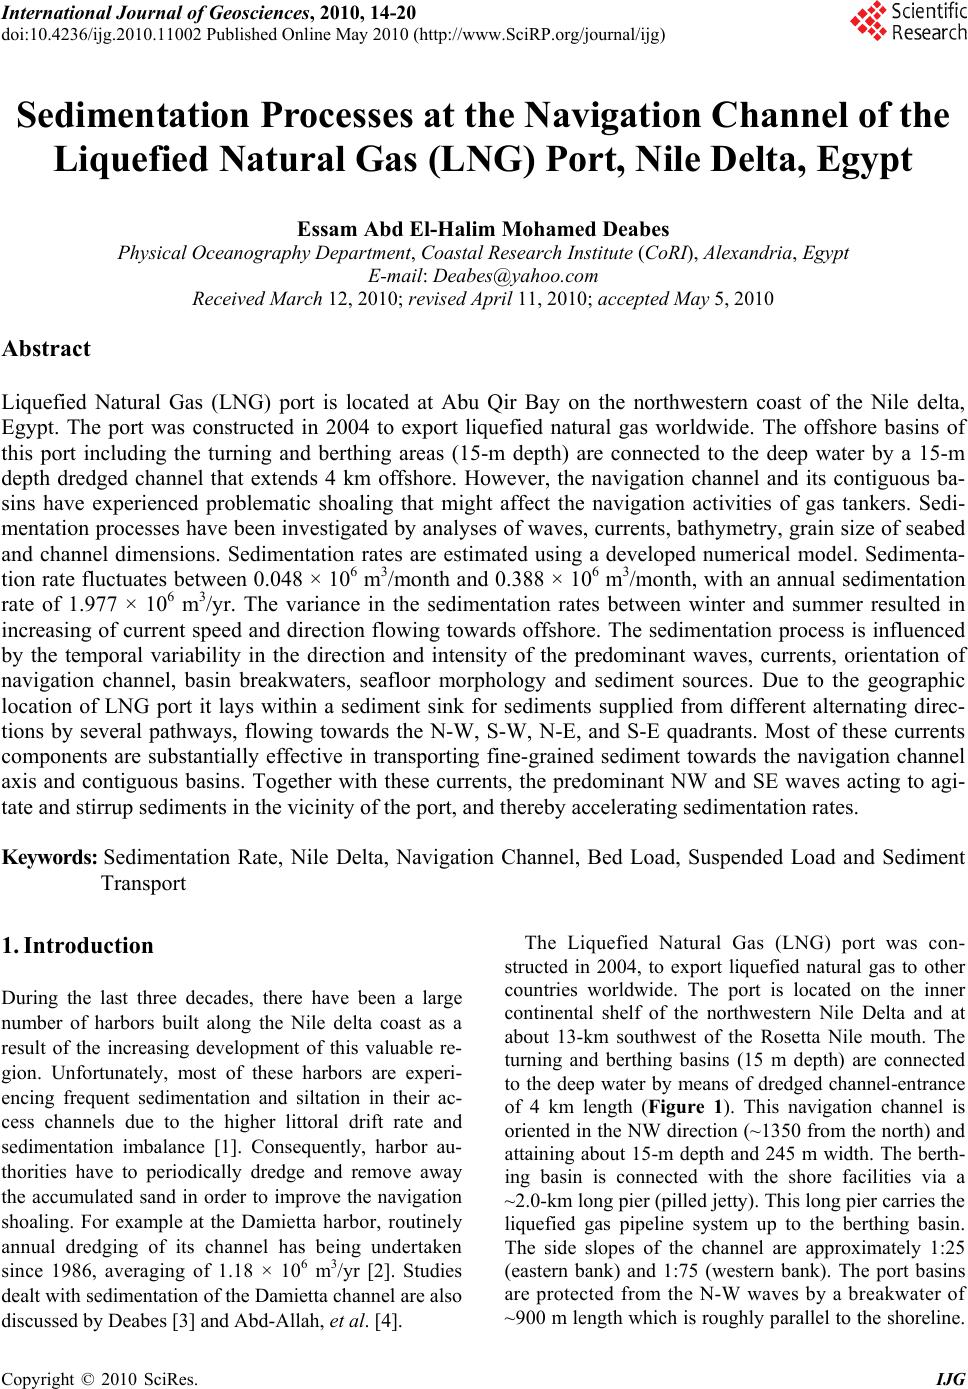 International Journal of Geosciences, 2010, 14-20 doi:10.4236/ijg.2010.11002 Published Online May 2010 (http://www.SciRP.org/journal/ijg) Copyright © 2010 SciRes. IJG Sedimentation Processes at the Navigation Channel of the Liquefied Natural Gas (LNG) Port, Nile Delta, Egypt Essam Abd El-Halim Mohamed Deabes Physical Oceanography Department, Coastal Research Institute (CoRI), Alexandria, Egypt E-mail: Deabes@yahoo.com Received March 12, 2010; revised April 11, 2010; accepted May 5, 2010 Abstract Liquefied Natural Gas (LNG) port is located at Abu Qir Bay on the northwestern coast of the Nile delta, Egypt. The port was constructed in 2004 to export liquefied natural gas worldwide. The offshore basins of this port including the turning and berthing areas (15-m depth) are connected to the deep water by a 15-m depth dredged channel that extends 4 km offshore. However, the navigation channel and its contiguous ba- sins have experienced problematic shoaling that might affect the navigation activities of gas tankers. Sedi- mentation processes have been investigated by analyses of waves, currents, bathymetry, grain size of seabed and channel dimensions. Sedimentation rates are estimated using a developed numerical model. Sedimenta- tion rate fluctuates between 0.048 × 10⁶ m3/month and 0.388 × 10⁶ m3/month, with an annual sedimentation rate of 1.977 × 10⁶ m3/yr. The variance in the sedimentation rates between winter and summer resulted in increasing of current speed and direction flowing towards offshore. The sedimentation process is influenced by the temporal variability in the direction and intensity of the predominant waves, currents, orientation of navigation channel, basin breakwaters, seafloor morphology and sediment sources. Due to the geographic location of LNG port it lays within a sediment sink for sediments supplied from different alternating direc- tions by several pathways, flowing towards the N-W, S-W, N-E, and S-E quadrants. Most of these currents components are substantially effective in transporting fine-grained sediment towards the navigation channel axis and contiguous basins. Together with these currents, the predominant NW and SE waves acting to agi- tate and stirrup sediments in the vicinity of the port, and thereby accelerating sedimentation rates. Keywords: Sedimentation Rate, Nile Delta, Navigation Channel, Bed Load, Suspended Load and Sediment Transport 1. Introduction During the last three decades, there have been a large number of harbors built along the Nile delta coast as a result of the increasing development of this valuable re- gion. Unfortunately, most of these harbors are experi- encing frequent sedimentation and siltation in their ac- cess channels due to the higher littoral drift rate and sedimentation imbalance [1]. Consequently, harbor au- thorities have to periodically dredge and remove away the accumulated sand in order to improve the navigation shoaling. For example at the Damietta harbor, routinely annual dredging of its channel has being undertaken since 1986, averaging of 1.18 × 10⁶ m 3/yr [2]. Studies dealt with sedimentation of the Damietta channel are also discussed by Deabes [3] and Abd-Allah, et al. [4]. The Liquefied Natural Gas (LNG) port was con- structed in 2004, to export liquefied natural gas to other countries worldwide. The port is located on the inner continental shelf of the northwestern Nile Delta and at about 13-km southwest of the Rosetta Nile mouth. The turning and berthing basins (15 m depth) are connected to the deep water by means of dredged channel-entrance of 4 km length (Figure 1). This navigation channel is oriented in the NW direction (~1350 from the north) and attaining about 15-m depth and 245 m width. The berth- ing basin is connected with the shore facilities via a ~2.0-km long pier (pilled jetty). This long pier carries the liquefied gas pipeline system up to the berthing basin. The side slopes of the channel are approximately 1:25 (eastern bank) and 1:75 (western bank). The port basins are protected from the N-W waves by a breakwater of ~900 m length which is roughly parallel to the shoreline. 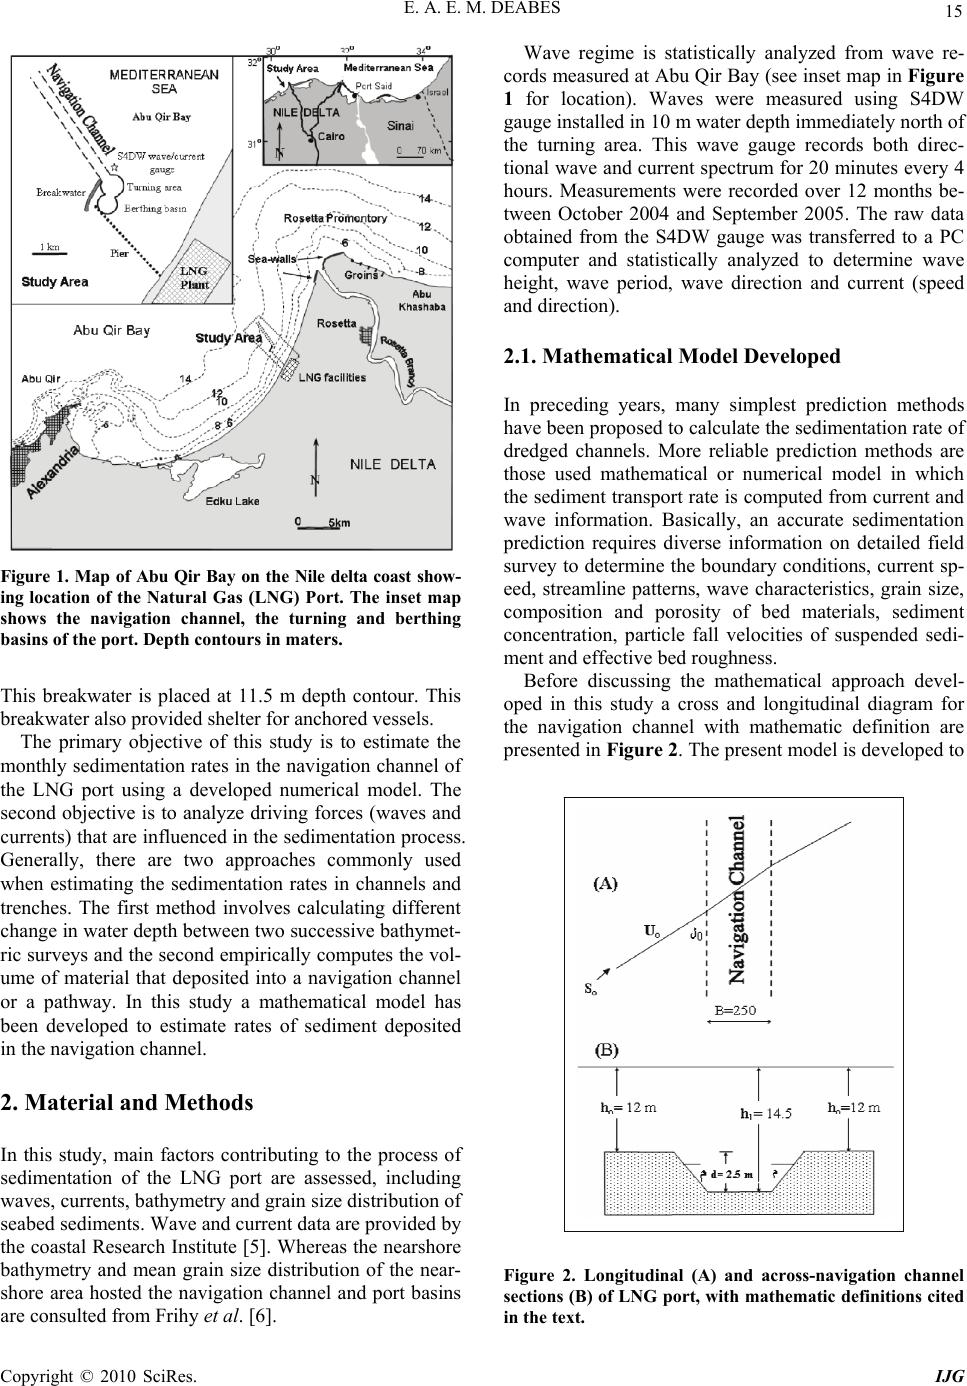 E. A. E. M. DEABES 15 Figure 1. Map of Abu Qir Bay on the Nile delta coast show- ing location of the Natural Gas (LNG) Port. The inset map shows the navigation channel, the turning and berthing basins of the port. Depth contours in maters. This breakwater is placed at 11.5 m depth contour. This breakwater also provided shelter for anchored vessels. The primary objective of this study is to estimate the monthly sedimentation rates in the navigation channel of the LNG port using a developed numerical model. The second objective is to analyze driving forces (waves and currents) that are influenced in the sedimentation process. Generally, there are two approaches commonly used when estimating the sedimentation rates in channels and trenches. The first method involves calculating different change in water depth between two successive bathymet- ric surveys and the second empirically computes the vol- ume of material that deposited into a navigation channel or a pathway. In this study a mathematical model has been developed to estimate rates of sediment deposited in the navigation channel. 2. Material and Methods In this study, main factors contributing to the process of sedimentation of the LNG port are assessed, including waves, currents, bathymetry and grain size distribution of seabed sediments. Wave and current data are provided by the coastal Research Institute [5]. Whereas the nearshore bathymetry and mean grain size distribution of the near- shore area hosted the navigation channel and port basins are consulted from Frihy et al. [6]. Wave regime is statistically analyzed from wave re- cords measured at Abu Qir Bay (see inset map in Figure 1 for location). Waves were measured using S4DW gauge installed in 10 m water depth immediately north of the turning area. This wave gauge records both direc- tional wave and current spectrum for 20 minutes every 4 hours. Measurements were recorded over 12 months be- tween October 2004 and September 2005. The raw data obtained from the S4DW gauge was transferred to a PC computer and statistically analyzed to determine wave height, wave period, wave direction and current (speed and direction). 2.1. Mathematical Model Developed In preceding years, many simplest prediction methods have been proposed to calculate the sedimentation rate of dredged channels. More reliable prediction methods are those used mathematical or numerical model in which the sediment transport rate is computed from current and wave information. Basically, an accurate sedimentation prediction requires diverse information on detailed field survey to determine the boundary conditions, current sp- eed, streamline patterns, wave characteristics, grain size, composition and porosity of bed materials, sediment concentration, particle fall velocities of suspended sedi- ment and effective bed roughness. Before discussing the mathematical approach devel- oped in this study a cross and longitudinal diagram for the navigation channel with mathematic definition are presented in Figure 2. The present model is developed to Figure 2. Longitudinal (A) and across-navigation channel sections (B) of LNG port, with mathematic definitions cited in the text. Copyright © 2010 SciRes. IJG  16 E. A. E. M. DEABES compute the sediment transport rate (bed-load and sus- pended-load) from the current and wave characteristics according to the transport law derived by Bailard [7] and Bailard and Inman [8], their formulae are given as fol- low: 3 3 s bw bU γ β U γgρρ efρ qtan tan tan (1) 5 tan U W e UU Wgρρ efρ q s s 3 ss sw s (2) in which : qb = instantaneous bed-load transport rate per unit length (m 2/sec) qs = instantaneous suspended-load transport rate per unit length (m 2/sec) fw = friction factor eb = efficiency factor for bed load transport ( = 0.11-0.15 ) es = efficiency factor for suspended load transport ( = 0.016-0.024 ) β = local bottom slope ( o ) γ = dynamic friction angle ( o ) γ = 0.75 for Φ = 0o , γ = 0.75 for Φ = 90o and γ = 1.1 for Φ = 180o (liner interpolation for intermediate values) Ws= particle fall velocity (m/sec) U = | U2w + U2 c + 2 Uw Uc cos Φ |0.5 (m/sec) = instantaneous near-bed velocity vector Uw= ûδ sin ( t) = near-bed orbital velocity (m/sec) Uc = near-bed current velocity (m/sec) Φ = angle between current direction and wave propa- gation direction ûδ = veloity at the edge of the wave boundary layer c = ω A (m/sec) ω = 2 л / T = angular velocity The friction factor fw is calculated as follows. 19.0 2.56exp sw KAf (3) in which: )kh(h H Asin2 = the peak value of the orbital excursion (m) H = wave height (m) k = wave number (m -1) h = water depth (m) Ks = bed roughness (m) Ks= 2 d50 d50 = is the diameter of grain size The particle fall velocity is calculated as follows. 1 )1(01.0 1 10 5.0 2 3 v gdS d Ws (4) for 100 < d < 1000 µm in which: d = d50 = sieve diameter (m) S = specific gravity (= 2.65) ν = kinematic viscosity coefficient (m2/sec) ν = 1.011 × 10⁻⁶ m 2/sec at T=20℃ ν = [1.14 – 0.031 (T – 15) + 0.00068 (T – 15)2] × 10–6 The sedimentation rate per unit length of the naviga- tion channel of LNG port is equal to sum of the bed-load transport which was completely deposited in the channel plus a small portion of suspended-load deposited in the channel (S). According to Sutrench model [9], the sedimentation rate (S) per unit length of channel result- ing from the incoming suspended-load sediment trans- port can be calculated by the following equation: 00 sin SeS in which: e = the trapping efficiency factor S0 = incoming suspended load transport α0 = the approach angle (angle between the direction of current and channel axis) The trapping efficiency factor (e) is defined as the relative difference of the incoming suspended load trans- port and the minimum suspended load transport in the channel. In the present study the trapping efficiency fac- tor (e) for the navigation channel of the LNG port has been determined using the graphs constructed by the application of Sutrench model [9]. 3. Results and Discussion The first requirement in dealing with harbor sedimenta- tion is to understand the processes and hydrodynamic forces dominated, such as waves, water circulation, sed- iment sources, seabed topography and port orientation. 3.1. Wave Characteristics Waves and currents are the principal driving forces for the transport of sediments on the most of the coasts and adjacent shelves. The main function of waves is to agi- tate the sediments and put them in suspension case. They are also responsible for driving sediment along shoreline and/or in the on-offshore directions. So characterization of waves and currents is necessary to understand their role in inducing shoreline changes and sedimentation pr- ocess in channels and waterways. Results yielded from statistical analysis of wave data recorded at the LNG port are depicted as monthly and Copyright © 2010 SciRes. IJG 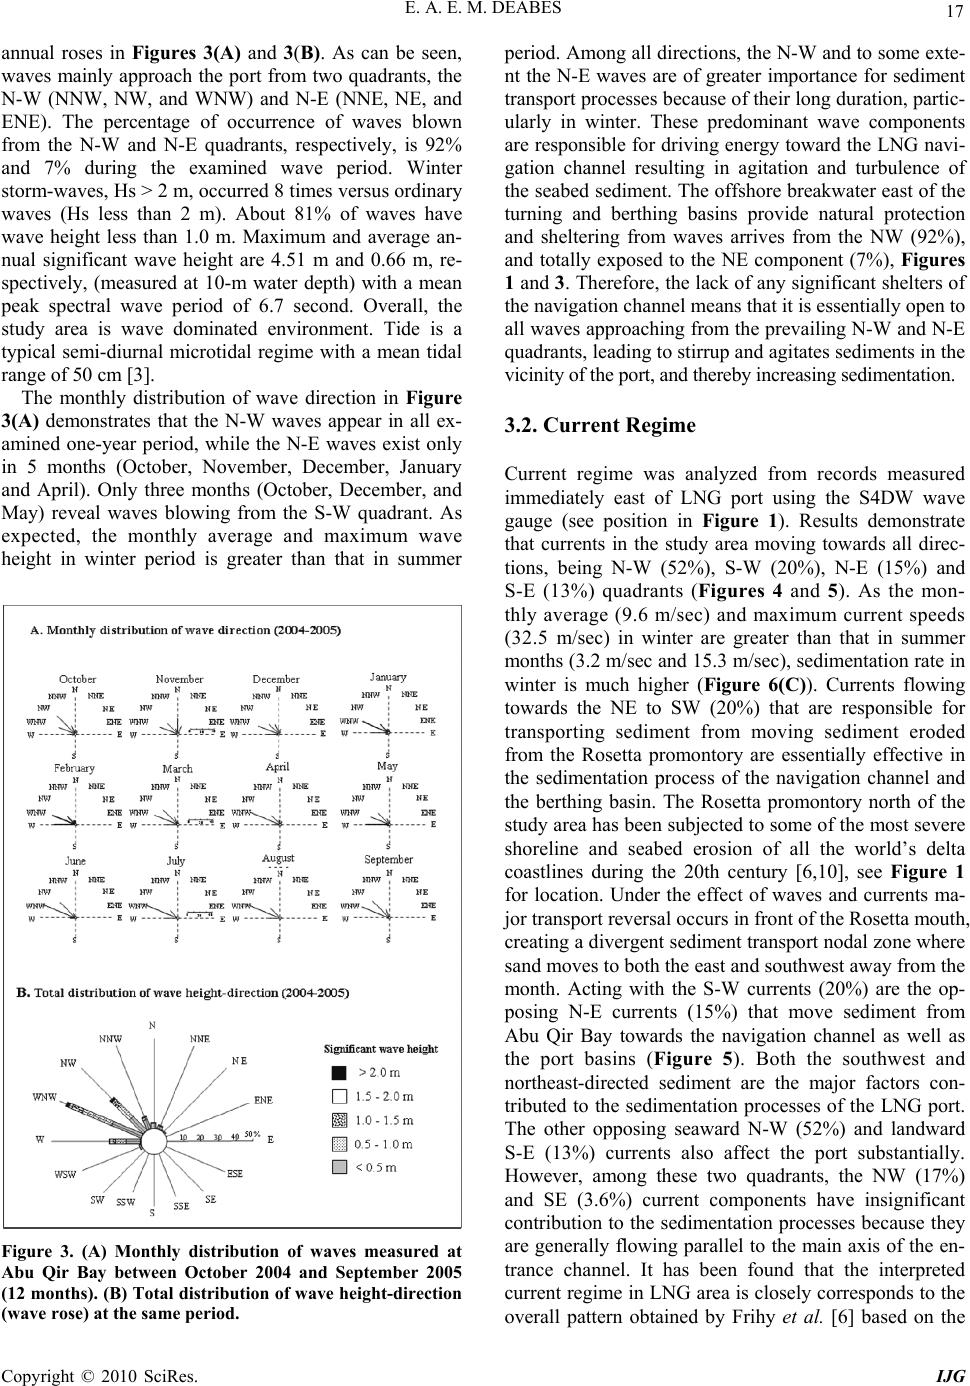 E. A. E. M. DEABES 17 annual roses in Figures 3(A) and 3(B). As can be seen, waves mainly approach the port from two quadrants, the N-W (NNW, NW, and WNW) and N-E (NNE, NE, and ENE). The percentage of occurrence of waves blown from the N-W and N-E quadrants, respectively, is 92% and 7% during the examined wave period. Winter storm-waves, Hs > 2 m, occurred 8 times versus ordinary waves (Hs less than 2 m). About 81% of waves have wave height less than 1.0 m. Maximum and average an- nual significant wave height are 4.51 m and 0.66 m, re- spectively, (measured at 10-m water depth) with a mean peak spectral wave period of 6.7 second. Overall, the study area is wave dominated environment. Tide is a typical semi-diurnal microtidal regime with a mean tidal range of 50 cm [3]. The monthly distribution of wave direction in Figure 3(A) demonstrates that the N-W waves appear in all ex- amined one-year period, while the N-E waves exist only in 5 months (October, November, December, January and April). Only three months (October, December, and May) reveal waves blowing from the S-W quadrant. As expected, the monthly average and maximum wave height in winter period is greater than that in summer Figure 3. (A) Monthly distribution of waves measured at Abu Qir Bay between October 2004 and September 2005 (12 months). (B) Total distribution of wave height-direction (wave rose) at the same period. period. Among all directions, the N-W and to some exte- nt the N-E waves are of greater importance for sediment transport processes because of their long duration, partic- ularly in winter. These predominant wave components are responsible for driving energy toward the LNG navi- gation channel resulting in agitation and turbulence of the seabed sediment. The offshore breakwater east of the turning and berthing basins provide natural protection and sheltering from waves arrives from the NW (92%), and totally exposed to the NE component (7%), Figures 1 and 3. Therefore, the lack of any significant shelters of the navigation channel means that it is essentially open to all waves approaching from the prevailing N-W and N-E quadrants, leading to stirrup and agitates sediments in the vicinity of the port, and thereby increasing sedimentation. 3.2. Current Regime Current regime was analyzed from records measured immediately east of LNG port using the S4DW wave gauge (see position in Figure 1). Results demonstrate that currents in the study area moving towards all direc- tions, being N-W (52%), S-W (20%), N-E (15%) and S-E (13%) quadrants (Figures 4 and 5). As the mon- thly average (9.6 m/sec) and maximum current speeds (32.5 m/sec) in winter are greater than that in summer months (3.2 m/sec and 15.3 m/sec), sedimentation rate in winter is much higher (Figure 6(C)). Currents flowing towards the NE to SW (20%) that are responsible for transporting sediment from moving sediment eroded from the Rosetta promontory are essentially effective in the sedimentation process of the navigation channel and the berthing basin. The Rosetta promontory north of the study area has been subjected to some of the most severe shoreline and seabed erosion of all the world’s delta coastlines during the 20th century [6,10], see Figure 1 for location. Under the effect of waves and currents ma- jor transport reversal occurs in front of the Rosetta mouth, creating a divergent sediment transport nodal zone where sand moves to both the east and southwest away from the month. Acting with the S-W currents (20%) are the op- posing N-E currents (15%) that move sediment from Abu Qir Bay towards the navigation channel as well as the port basins (Figure 5). Both the southwest and northeast-directed sediment are the major factors con- tributed to the sedimentation processes of the LNG port. The other opposing seaward N-W (52%) and landward S-E (13%) currents also affect the port substantially. However, among these two quadrants, the NW (17%) and SE (3.6%) current components have insignificant contribution to the sedimentation processes because they are generally flowing parallel to the main axis of the en- trance channel. It has been found that the interpreted current regime in LNG area is closely corresponds to the overall pattern obtained by Frihy et al. [6] based on the Copyright © 2010 SciRes. IJG  18 E. A. E. M. DEABES Figure 4. (A) Monthly distribution of current directions at Abu Qir Bay between October 2004 and September 2005 (12 months). (B) Total distribution of current speed direc- tion (current rose) at the same period. spatial dispersion of mean grain size and magnetic min- erals in the seabed sediments. 3.3. Sedimentation Process Grain size distribution of sediments hosting LNG port has been described by Frihy et al. [6]. Accordingly, cross-shelf sediment pattern shows fining trends in two directions. A seaward fining trend starts from the shore- line to a distance of 10 km at 15 m water depth (Mz = 0.004-0.063-mm). This fining pattern indicates sediment transport to the NW and is mainly caused by a shoreward increase of wave energy dissipation induced by shoaling and current-driven sediment transport processes. Unlike this pattern, cross-contour clay and silt belts (0.01 to 0.06 mm) truncate the sand belts at the north sector of the area. This sediment pattern suggests that the fine-grained sand and mud flooring the vicinity of the port area are able to be bypassed to the navigation channel and basins and thereby inducing sedimentation. The data required to run the developed include time series of waves and currents, grain size of seabed sediment (Mz = 0.09), channel width (250 m), length (4000 m), ori- entation of channel axis (135o from north) and bathymet- ric map of (see Figure 5). Results obtained from running the developed numerical model are listed in Table 1. As can be noticed the sedimentation rate calculated during winter (October 2004-March 2005) is greater than that of summer (April 2005-September 2005). Winter period is generally characterized by higher monthly sedimentation rates (> 0.1 × 10⁶ m 3/month), with a maximum rate of 0.388 × 10⁶ m 3/month occurred in January 2005. Whe- reas, lower rates (< 0.1 × 10⁶ m 3/month) occurred in summer, with a lowest value 0.048 × 10⁶ m3/month in July 2005. The annual rate of sedimentation is 1.977 × 10⁶ m3/yr. The proportion of bed-load sediments fluctuates be- tween 68.2 and 83.9%, with an average of 78%. Sus- pended-load varies from 16.1 to 31.8%, with an average 22%. This means that suspended-load sediments contrib- uted to about 22% of the volume of deposited sands, while bed-load sediments represent about 78% of that volume. Figure 5. Map of the nearshore area of the study LNG port showing spatial distribution of mean grain size of bottom sediments and bathymetry (modified from Frihy et al. [6]). Sediment transport paths involved in the sedimentation processes of the port channel and basins are depicted as arrows. The size of arrows quantitatively represents wave and current proportions. The general transport paths indi- cate that the port area is interpreted as a sediment sink for several current pathways towards the N-W, S-W, N-E, and S-E quadrants. Depth contours in meters. Copyright © 2010 SciRes. IJG  E. A. E. M. DEABES 19 Figure 6. Monthly average and maximum values of signif- icant wave height (A) and current speed (B). (C) Sediments involved in the processes of sedimentation of the navigation cannel and port basins are suspended matters (Ss) and bedload modes (Sb). Results estimated using the model developed in the present study between October 2004 and September 2005. Table 1. Calculated monthly volume, suspended and bed load sediments acting in the navigation channel of LNG port between october 2004 and september 2005. Months Sb (m3) Ss (m3)total Qs (m 3) Sb%Ss% Oct. 2004 91702.58 33745.54125448.12 73.1026.9 Nov. 2004 274124.91 103036.86377161.77 72.6827.32 Dec. 2004 169666.30 79275.65248941.95 68.1531.85 Jan. 2005 290910.17 97072.49387982.66 74.9825.02 Feb. 2005 209939.43 44601.09254540.52 82.4817.52 Mar. 2005 89237.03 17067.55106304.58 83.9416.06 Apr. 2005 91493.67 20765.84112259.51 81.5018.50 May 2005 56443.38 13660.2270103.60 80.5119.49 Jun. 2005 49917.33 13782.3163699.64 78.3621.64 Jul. 2005 35261.74 12871.4348133.16 73.2626.74 Aug. 2005 60384.48 12040.2672424.74 83.3816.62 Sept. 2005 85948.23 24332.42110280.65 77.9422.06 Total period 1505029.24 472251.661977280.9 77.6022.40 (Sb = bed-load sedimentation rate Ss = suspended-load sedimentation rate) 4. Summary and Conclusions The two port basins (turning and berthing areas) and the contiguous navigation channel of LNG port are located at Abu Qir Bay on the northwest margin of the Nile delta. This port is of considerable socioeconomic importance, supporting exporting gas industry that relies on the shel- tered port areas to serve as mooring points for the inter- national gas tankers. Presently, the channel entrance and the two basins (15-m water depth) are experiencing con- siderable sedimentation; therefore they are dredged pe- riodically to insure safety navigation for LNG vessels. A dataset of waves, current and texture of seabed are interpreted to precisely evaluate sedimentation processes taking place in this port. Waves approach the port blow- ing from two main dominant quadrants, the N-W and N-E. These waves actively act to agitate and stirrup sedi- ments as bead-load and suspended modes, directly to- ward the navigation channel and port basins. However, the port basins are protected from wave exposure from the N-W waves by a 900-m breakwater and not from the N-E waves. Wind and wave-driven currents are responsible to ac- cumulate large portion of sediments (very fine sand and mud) in the port vicinity and subsequently negatively affecting the navigation channel and basins. Both the opposing S-W and N-E current paths produce sand and mud accumulation in the nearshore area hosting the port channel and basins. The principal sources of sediment contributed to the processes of sedimentation of the LNG are the eroded Rosetta promontory and the inner shelf of Abu Qir Bay. These sediment sources supply large quan- tities of fine-grained sand and mud to the basins and channel via opposing S-W and N-E currents. Other op- posing N-W (seaward) and S-E (landward) currents have also significance effect, with exception of the NW and SE components which are flowing parallel to the channel axis. The seaward current moves sediment from the sur- fzone whereas landward one from offshore sources, both toward the port. This generally implies that the naviga- tion channel and its adjacent basins are apparently acting effectively as a sediment sink for sediments supplied from the four quadrants. The dataset interpreted in this study are also incorpo- rated into a mathematical procedure for calculating rate of sedimentation in the port facilities. Monthly sedimenta- tion rates yielded from applying the developed model fluctuate between 0.048 × 10⁶ and 0.388 × 10⁶ m3/month, with an annual rate of 1.977 × 10⁶ m3/yr. This annual rate is closely comparable to the sediments accumulated in the port as estimated by HR Wallingford (2004) based on bathymetric survey and numerical model. Sus- pended-load sediment contributed to about one-fifth of the total of sediments, while the bed-load mode is ap- Copyright © 2010 SciRes. IJG  E. A. E. M. DEABES Copyright © 2010 SciRes. IJG 20 proximately four-fifth of the sediments that deposited in the navigation channel. In comparison, these estimated proportions are found to be in agreement with results obtained by Komar and Inman [11], Komar [12] and Inman, et al. [13]. 5. Acknowledgements The author appreciates the assistance of the staff of the Coastal Research Institute for the field and laboratory activities of this study. Appreciation is also given to Drs. Omran Frihy, Abdel Monaam Badr and Abu Bakr. 6. References [1] O. E. Frihy and D. Lawrence, “Evaluation of the Mod- ern Nile Delta Promontories: Development of Accretional Features during Shoreline Retreat,” Environmental Geology, Vol. 46, No. 6, 2004, pp. 914-931. [2] O. E. Frihy, A. M. Badr and M. S. Hassan, “Sedimenta- tion Processes at the Navigation Channel of the Damietta Harbour on the Northeastern Nile Delta Coast of Egypt,” Journal of Coastal Research, Vol. 18, No. 3, 2002, pp. 459-469. [3] E. A. M. Deabes, “The Study of Sea Level Changes and Current at Rosetta and Damietta Outlets and Abu Qir Bay,” M. Sc. thesis, Faculty of science, University of Alexandria, 2002. [4] M. A. Abd-Allah, A. H. El-Gindy and E. A. M. Deabes, “Estimation of Sedimentation Rates in the Navigation Channel of Damietta Harbour, Egypt,” Journal of Arab Academy for Science, technology and Marine Transport, Vol. 30, No. 59, 2005, pp. 54-61. [5] CoRI, “Sea Waves and Currents Characteristics at West Side of Loading ARMS, ELNG Port-Idku Site,” Technical Reports, Coastal Research Institute, 2004-2006. [6] O. E. Frihy, M. S. Hassan, E. A. Deabes and A. M. Badr, “Seasonal Wave Changes and the Morphodynamic Res- ponse of the Beach-Inner Shelf of Abu Qir Bay, Mediter- ranean Coast, Egypt,” Marine Geology, Vol. 247, No. 3-4, 2008, pp. 145-158. [7] J. A. Bailard, “Total Load Sediment Transport Model for Plane Sloping Beach,” Journal of Geophysical research, Vol. 86, No. C11, 1981, pp. 10938-10954. [8] J. A. Bailard and D. L. Inman, “An Energetics Bed Load Model for Plane Sloping Beach,” Journal of Geophysical research, Vol. 86, No. C3, 1981, pp. 2035-2043. [9] L. C. Van Rijn, “Sedimentation of Dredged Channels and Trenches,” In: Herbich, J. B., Ed., Handbook of Coastal Ocean Engineering, Gulf Pub., Co., Houston, TX, 1991, pp. 609-650. [10] M. A. El Sayed, N. A. Younan, A. M. Fanos and K. H. Baghdady, “Accretion and Erosion Patterns along Rosetta Promontory, Nile Delta coast,” Journal of Coastal Rese- arch, Vol. 21, No. 3, 2005, pp. 412-420. [11] P. D. Komar and D. L. Inman, “Longshore Sand Tran- sport on Beaches,” Journal of Geophysical Research, Vol. 75, No. 30, 1969, pp. 5514-5527. [12] P. D. Komar, “The Relative Significance of Suspension Versus Bed-Load on Beaches,” Journal of Sedimentary petrology, Vol. 48, 1978, pp. 921-932. [13] D. L. Inman, J. A. Zampol, T. E. White, D. M. Hanes, B. W. Waldorf and K. A. Kastens, “Field Measurement of Sand Motion in the Surf Zone,” Proceedings of 17th International Conference on Coastal Engineeering, ASCE, New York, 1980, pp. 1215-1234. |