 Psychology 2012. Vol.3, No.5, 410-418 Published Online May 2012 in SciRes (http://www.SciRP.org/journal/psych) http://dx.doi.org/10.4236/psych.2012.35058 Copyright © 2012 SciRes. 410 Enhancing Accessibility of Visual Information via Sound: Metaphoric Association versus Rule-Based Mapping* Orit Shenkar1,2#, Daniel Algom3 1Department of Occupational Therapy, Ono Academic College, Kiryat Ono, Israel 2The Hebrew University of Jerusalem, Jerusalem, Israel 3Department of Psychology , Tel-Aviv University, T e l -A viv , Israel Email: #orit.shenkar@ono.ac.il Received March 6th, 2012; revised April 5th, 2012; accepted May 4th, 2012 The goal of this study was to develop and test methods for enhancing accessibility of visual information through conversion to sound. In three experiments, normally sighted and visually impaired participants learned to associate sounds to referent visual stimuli. The conversion included an experience-based method that made use of natural sounds of objects and a rule-based method, which produced an appropri- ate “auditory graph” via a precise function. Learning was easier with the first method but an appreciable transfer of learning was only observed with the second method. Rendering the visual input highly acces- sible, these methods are capable of improving activities of daily living. Keywords: Sonification; Learning; Transfer of Learning; Visually Impaired Introduction Vision is the primary channel for processing perceptual in- formation in everyday life. It is the main vehicle enabling iden- tification of objects, orientation in space, and adaptation to changes that occur in familiar environments. Individuals with impaired vision are at a disadvantage in all of these vital func- tions. The use of alternative ways of representing visual infor- mation thus is essential for people with visual impairment, but it can also benefit individuals who must address large amounts of visual data. The purpose of this study was to characterize learning and transfer of learning with two different methods of representing visual data by sounds. We compared the ease (or difficulty) of using a metaphoric method by which visual im- ages are represented by characteristic sounds with that of an analytic, rule-based method, with participants who are normally sighted and those who have visual impairment. Sonification Sonification is the use of speech and non-speech sounds to represent visual data (Walker & Cothran, 2003). In recent years, sonification has been studied to determine optimal strategies for providing acoustic representations of visual information in daily life (e.g., Cabrera & Ferguson, 2007; Nees & Walker, 2007; Pirhonen, 2007). For example, Keller et al. (2003) dem- onstrated the usefulness of sonification for representing gamma ray data from the planet Mars. The auditory representations entailed various musical instruments (bell, orchestra, or gui- tar/bass), phase cha racteristic (beat s, sustained notes) as well a s basic sound parameters (pitch, loudness, volume). The results showed that the auditory group performed on a par with a group viewing the same data and with a group presented with joint visual-auditory stimuli. Moreover, the participants in the audi- tory and the combination groups exhibited greater interest and engagement levels than the participants in the vision group. Testing statistical parameters and numeric data, Flowers and Hauer (1992) found that key features of the data were equally accessible via auditory and visual graphs. Moreover, the par- ticipants easily discerned the kinship between pairs of auditory or visual graphs representing the same referent data. In a sub- sequent study (Flower & Hauer, 1993), the authors included bimodal presentations in addition to visual and acoustic ones and found that the visual displays were the easiest and the bi- modal ones the most difficult. Nevertheless, multidimensional scaling revealed that people accessed the same underlying di- mensions when evaluating the input regardless of the mode surface presentation (see also, Flowers & Hauer, 1995, Flowers, Buchman, & Turnage, 1997, and Bonebright, Nees, Connerley, & McCain, 2001, for essentially similar results). Clearly, existing research demonstrates that converting visual data to sounds is a potent vehicle for enhancing information processing. It enables good performance, both as the sole input and jointly with visual presentation. It is also clear that em- ploying an alternative means of representing information, a means that does not rely on vision, can well serve sighted peo- ple. Auditory Representation with the Visually Impaired Kamel, Roth, and Sinha (2001) asked people who are blind or who have visual impairment to locate a given shape (e.g., a triangle) on the computer screen by putting the cursor on the target location. The results showed that participants who re- ceived auditory help navigating the space performed better than those who did not. Several features of this study are noteworthy. Harnessing the auditory system for orientation in space differs from the tactic used in other studies that examined this ability *We thank Miriam Furst and Noomi Katz for their help in various stages o the complet io n of this study . #Correspo n ding author.  O. SHENKAR, D. ALGOM with the help of a combination of sensory systems (e.g., Bly, 1982; Jacobson, 1998). The use of tones (i.e., the absence of speech) for orientation in space is another notable feature. This goes beyond the manipulations in James’ (1998) study entailing an auditory interface that incorporated speech and non-speech sounds to represent the structure of HTML documents. Salient among the advanced technological tools available to assist orientation with people who are blind in is a device de- veloped by Meijer (1992). It consists of a miniature camera, a mobile computer, and headphones. The camera is mounted on the user’s head and converts video input into auditory informa- tion. Its sophistication granted, there is, to date, no clear evi- dence on the effectiveness of Meijer’s system. To recap, the research in the field of sonification holds great potential. Valuable information has been collected to advance our understanding of cross modal representations. Nevertheless, the results have not accumulated in a fully systematic fashion. The choice of auditory parameters to represent visual ones var- ied across studies and appears to be quite arbitrary. For exam- ple, the visual horizontal dimension was represented by beat repetition in some studies, by lateralization in additional studies, and by various musical instruments in yet other studies. The Present Study: Metaphoric and Analytic Methods for Auditory Representation In the metaphoric method, a unique sound substituted each visual image. For natural stimuli, we used the characteristic sound that they produce (e.g., a cat’s meow, a dog’s bark). Such representations are based on learning acquired over a lifetime. For images that do not have “natural” sounds, we selected arbi- trary ones to represent them (e.g., the playing of a ram’s horn to represent a square, playing the guitar to represent a circle). Such sounds lack, of course, meaning but repeated exposure helped the learner to “glue” them to their visual referents. This metaphoric method is easily learned but this advantage is offset to a certain extent by reliance on the specific visual-auditory pairings presented. The “analytic” method was a rule-based representation by which values of a pair of continuous auditory variables replaced each point in the visual space. The outline drawing of a stimu- lus (say, that of a dog) was considered as a graph of a function in (unseen) Cartesian coordinates. The coordinates of each point along the graph were converted onto auditory variables standing for the abscissa and th e ordinate. The former was rep- resented by the differences in loudness between the two ears (lateralization or stereo effect), whereas the latter was repre- sented by sound frequency or pitch. The auditory graph thus created was played to the participant through headphones in order to replace its visual referent. Of course, the auditory graph extends in time, whereas the visual one extends in space. To standardize the representation, the “song” always started at the lower left of the figure, proceeding to its right, moving up- ward, and turning left before descending back to the starting point at the lower left. Take the outline drawing of a cat for an illustration of learn- ing with the two methods. In the metaphoric method, the cat was represented by the sound of mewing. In the analytic method, a continuous sound stood for the drawing of the cat, starting from the lower left. The sound “moved” in the auditory space from left to right, then it increased in pitch, after which it moved back from right to left. At the upper left it decreased in pitch returning the starting point again, at the lower left. Of course, all the “curves” of the cat were represented by the cor- responding fine-tuned local changes in pitch and location of the sound. In the following series of experiments, we performed a sys- tematic comparison of the process of learning and of the extent of transfer of learning obtained with the metaphoric and the analytic methods of representations. Persons with intact sight took part in the first two experiments, whereas individuals with impaired vision participated in the third experiment. We at- tempted to assess the relative advantages and costs associated with each method of representation. A unique feature of this study that its methods are theory based and not merely provi- sional means for ready application. Due to its theoretical basis, the outcome distinguishes between the rival approaches and the results generalize into entire classes of to-be-developed inter- ventions besides the current ones. Experiment 1 Method Participants The participants were 12 young women and men (6 females and 6 males) from two selective high schools in Jerusalem and in the Sharon county of Israel. They were between 16 and 18 years of age. All had normal or corrected-to-normal vision and hearing, were right handed, and none suffered from any (known) physical damage. The participants served in a two experimental sessions lasting approximately one hour each. Apparatus and Stimuli The visual stimuli were outline drawings of objects. The ob- jects were familiar stimuli from the environment (bell, dog, car, airplane, boat, dolphin, hammer, and duck) and familiar geo- metric shapes (three different-shaped triangles, two differ- ent-shaped rectangles, a diamond, a circle, and a square). The drawings were created via standard Paint and FreeHand pro- grams with a line width of 1.5 mm. The drawings were pre- sented on the 14 LCD screen of a Compaq’s mobile computer, Presario model 2100, set at a resolution of 768 × 1024 pixels. The drawings appeared black over the white background of the screen. Eight drawings (eight environmental objects or eight geometric shapes) appeared on a trial. Each drawing appeared within a 3 × 3 matrix. Each cell contained a visual object, ex- cept for the empty central cell. For the metaphoric method, we used familiar sounds to rep- resent the environmental objects. The sounds were bell ringing, barking, engine ignition, and plane takeoff, boat-horn, sound of a dolphin, hammer’s tapping, and the quack of a duck. We used musical sounds (piano, guitar, trumpet, drums, castanets, chimes, cymbals, and harmonica) to represent the geometric shapes. The particular musical sound assigned to represent a geometric shape varied from participant to participant. In the analytic method, the sounds were produced via a spe- cially created (Matlab) program. The points along the visual shape were converted into tones of different location in the interaural space and of differing pitch. The values of localiza- tion and pitch changed in a continuous manner, governed by the variation of the line in the drawing. The program produced subjective lateralization through appropriate differences in the intensity of the sounds fed in to the left and the right ears. Pitch Copyright © 2012 SciRes. 411  O. SHENKAR, D. ALGOM was created by changes in frequency. Location stood for hori- zontal values along the abscissa and pitch for values along the ordinate. Via the continuous changes in location and pitch, the “auditory graph” reproduced faithfully the visual shape in the time domain. Again, these representations were implemented via a soft- ware that we developed specifically for training and testing users at perceiving visual graphs via auditory feedback. The software allowed for representation of both environmental ob- jects and geometrical shapes, indeed of any function in a two-dimensional space. Sound frequency ranged between 500 - 1000 Hz. Differences in loudness between the two ears ranged between 0 - 40 dB. The auditory “graph” lasted 10 s on average (due to the approximately constant size of the shapes). The average loudness level was normalized at 60 dB SPL. The par- ticipants listened to the auditory stimuli via Panasonic’s stereophonic headphones (model RP-HT21). Design Because the association of metaphoric sounds with environ- mental objects is trivial (one does not have to learn that barking is associated with dogs), we used the following three conditions: metaphoric representation of geometric shapes, analytic repre- sentation of environmental objects, and analytic representation of geometric shapes. Each participant performed only in one of the three conditions. Thus, a random four of the participants matched metaphoric sounds to geometric shapes, another four matched “auditory graphs” to such shapes, and the remaining four participants matched “auditory graphs” to environmental objects. Before performing with the analytic method, the par- ticipant received explanations concerning the principles of the method followed by illustrations. Learning On a trial, the eight shapes (environmental or geometric) were presented on the screen, arranged within a 3 × 3 matrix of squares. After 350 ms, a sound was played. The participant’s task was to select the shape that corresponded to that sound. The participant indicated her or his response manually by pressing the appropriate key on a parallel 3 × 3 response pad. Feedback was provided after each response (a sound of ap- plause for a correct response and a buzzer for an incorrect one). The acquisition of the association between a particular sound and a particular visual stimulus proceeded as follows. Upon the presentation of the sound, the participant selected one of the eight visual shapes on the screen. Correct responding was fol- lowed by the feedback of the sound of applause. After 350 ms, the same eight stimuli appeared in another spatial arrangement, followed by another sound stimulus. Incorrect responding was followed by the feedback of the sound of buzzer. The same stimuli within the same spatial arrangement followed by the same sound were presented again. In case of another incorrect response, the same procedure was repeated. A correct response, in contrast, was followed by the previously described proce- dure. This method of learning resulted in the establishment of the correct association between each of the visual stimuli and each of the subsequent sound stimuli. We defined the correct acqui- sition of the eight visual-auditory associations as the comple- tion of the entire stimulus-response mappings without error. Each participant went through eight such cycles per a learning session. Learning was gauged by the number of errors per cy- cle. In order to sustain motivation, we offered monetary rewards for good performance. The size of the reward was conditioned on the participant’s performance. A reduction in the number of errors (up to 50%) between the first and the second session yielded the reward of 20 NIS. The reward was increased to 50 NIS when the errors went down beyond 50%. Procedure The particip ants were tested individually in a dimly lit room. The participant was seated at a distance of approximately 60 cm from the computer screen. The instructions were as follows: “Your task is to match a sound played via the headphones to one of the objects presented on the screen. Select your response by pressing the key on the pad that corresponds to the location of the appropriate shape. Please respond promptly but without making mistakes.” The participant was then assigned to one of the three conditions in a random fashion. The experimental session ended after learning the eight combinations to the pre- scribed criterion. A day later the participant returned to the laboratory to perform in a second learning session with the same visual and sound stimuli. Each session ended after the presentation of eight cycles, and lasted one hour on average. Results and Discussion The three panels of Figure 1 present the results of the learn- ing in the three conditions. The data are classified by cycle of learning (in a given session) and by session. We tested by ANOVA the influence of these independent variables on the dependent measure of errors. Salient to visual inspection is the improvement between sessions as well as a graduate less visible learning within each session. In the condition in which meta- phoric sounds where associated with geometric shapes, the main factor of session was highly reliable [Panel A, F(1, 16) = 53.32, p < .001], although that for cycle was not [Panel A, F(1, 16) = 1.54, p > .05]. The lack of a session x cycle interaction [F(7, 16) = 43.67, p > .05] showed that any learning that took place within the two sessions was similar. For analytic repre- sentation of the same stimuli, we recorded the same outcome: a reliable effect of session [Panel B, F(1, 16) = 6.86, p < .05] with neither cycle [Panel B, F(1, 16) = .98, p > .05] nor the interaction [F(7, 16) = 44.46, p > .05] reliable statistically. Fi- nally, for analytic representation of environmental objects both session [Panel C, F(1, 16) = 272.06, p < .001] and cycle [Panel C, F(7, 16) = 58.14, p < .001] were reliable, indicating the pres- ence of learning both within and across sessions. Moreover, the session x cycle interaction was also reliable [F(7, 16) = 38.26, p < .001]. This interaction supports the observation that learning was less pronounced in the second session. In an overall ANOVA, the number of errors differed across the three methods [F(2, 48) = 9.14, p < .001]. Error rate was largest in the condition in which analytic sounds represented geometric shapes (mean of 12.34), was intermediate in the con- dition in which metaphoric sounds were associated with the same shapes (mean of 12.1), and was smallest when the par- ticipant learned to represent environmental objects by analytic sounds (mean of 6.56). In this inclusive analysis we also found an effect of a cycle [F(7, 48) = 4.17, p < .001] as well as an effect of session [F(1, 48) = 65.29, p < .001]. Clearly, each of the three main factors, method of representation, cycle of Copyright © 2012 SciRes. 412  O. SHENKAR, D. ALGOM Copyright © 2012 SciRes. 413 Figure 1. The mean number of errors per cycle in three conditions observed in Experiment 1. (a) Metaphoric repre- sentation of geometric shapes; (b) Analytic representation of geometric shapes; (c) Analytic representation of environmental o bj e ct s . learning, and session affected the acquisition. Of the interac- tions, that between session and cycle was reliable [F(7, 48) = 2.76, p < .05], documenting the diminishing marginal gains in learning during the second session. The absence of a method x cycle interaction [F(14, 48) = 1.16, p > .05] as well as the non-reliable three-way interaction (F < 1) confirms that acqui- sition had the same general shape with all methods. The results provide impressive evidence of learning by both methods of auditory conversion. The learning that took place within the span of a day (separating the two sessions) was sub- stantial. Clearly, humans are capable to learn cross-modal rep- resentation by both methods. However, what is still missing in the data is an indication for differential learning. Experiment 2 The important issue addressed in Experiment 2 was the dif- ferent potential of the metaphoric and the analytic methods assayed through generalizeability and ecological validity. For the former, we tested transfer of learning with each method. A representation is valuable to the extent that is not limited to the set of stimuli that served in acquisition. For the latter, we tested the ability to re-create via outline drawing a visual stimulus based solely upon the respective sound input. Method Participants A fresh group of 24 young women and men, half females, participated in the experiment on a voluntary basis. Their age ranged between 16 and 18 years. The inclusion criteria were those used in Experiment 1. The participants served in three experimental sessions lasting approximately one hour each. Apparatus and Stimuli The apparatus and conditions of stimulus presentation were those used in Experiment 1. For the visual stimuli, there were two sets of geometric shapes (set #1: three different-shaped triangles, two different-shaped of rectangles, a diamond, a cir- cle, and a square ; set #2: an arrowhead, an ellipse, a hexagon, a house, a star, a sandglass, a rectangle and a triangle -- different from those used in set #1). There was yet another set of “natu- ral” environmental objects (bell, dog, car, airplane, boat, dol- phin, hammer, and duck.). For the auditory representations, we used the following sounds in the metaphoric method: piano, castanets, chimes, cymbals, harmonica, guitar, trumpet, and drums (set #1) and piano, drums, chimes, cymbal, bell, gong, guitar and trumpet (set #2). The metaphoric sounds for the en- vironmental objects were obviously those of bell ringing, bark- ing, engine ignition, plane takeoff, boat’s horn, sound of a dol- phin, hammer’s tapping, and the quack of a duck. For the ana- lytic method, the specific auditory function or “musical graph” represented each visual stimulus, whether geometric shape or everyday object . Design There were two conditions of learning, metaphoric and ana- lytic. Different participants studied in each condition. Within each condition, the participant learned to associate a sound to each visual stimulus in two sessions separated by 24 hours. After another 24 hours the participants returned to the labora- tory for another learning session using the same method but on a different set of stimuli. We elected to separate sessions by 24 hours because this interval provides the best condition for over- night consolidation of learning. The participants learning with the metaphoric method had one set of geometric shapes during the first two sessions, and another set of geometric shapes in the third session (testing everyday objects is impractical with this method). The partici- pants learning with the analytic method had one set of stimuli (shapes or objects) during the first two sessions, and a new set (shapes or objects) in the third session. The stimulus sets were counterbalanced within each condition. Thus, half of the par- ticipants in the metaphoric group studied a given set in sessions 1 and 2 and another in the third session, whereas the other half studied with the reversed arrangement. In the analytic group, half of the participants studied geometric shapes in the first two 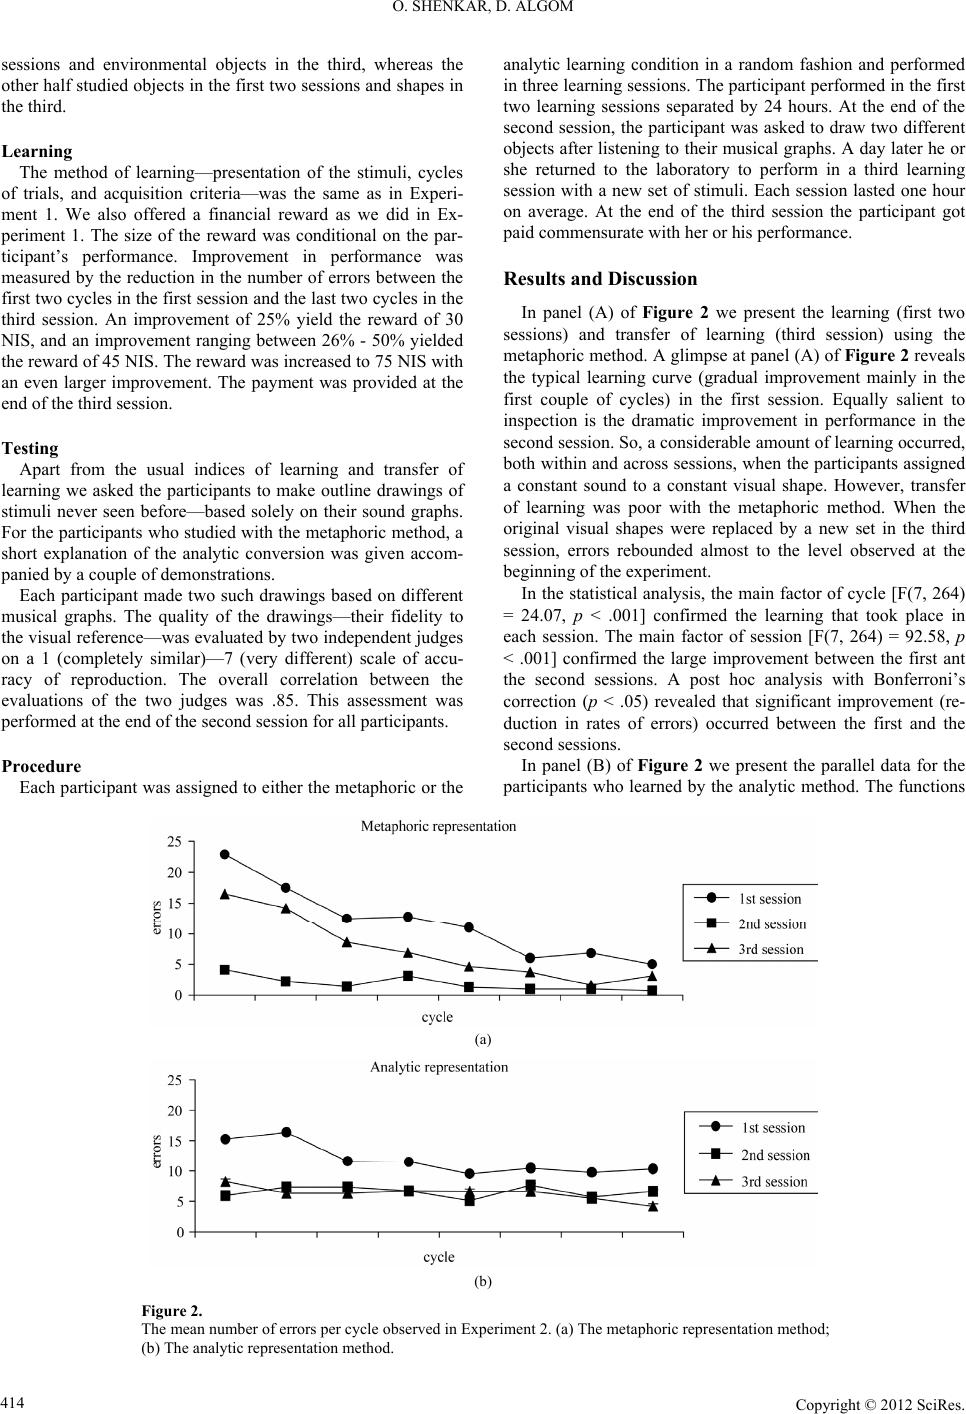 O. SHENKAR, D. ALGOM sessions and environmental objects in the third, whereas the other half studied objects in the first two sessions and shapes in the third. Learning The method of learning—presentation of the stimuli, cycles of trials, and acquisition criteria—was the same as in Experi- ment 1. We also offered a financial reward as we did in Ex- periment 1. The size of the reward was conditional on the par- ticipant’s performance. Improvement in performance was measured by the reduction in the number of errors between the first two cycles in the first session and the last two cycles in the third session. An improvement of 25% yield the reward of 30 NIS, and an improvement ranging between 26% - 50% yielded the reward of 45 NIS. The reward was increased to 75 NIS with an even larger improvement. The payment was provided at the end of the third session. Testing Apart from the usual indices of learning and transfer of learning we asked the participants to make outline drawings of stimuli never seen before—based solely on their sound graphs. For the participants who studied with the metaphoric method, a short explanation of the analytic conversion was given accom- panied by a couple of demonstrations. Each participant made two such drawings based on different musical graphs. The quality of the drawings—their fidelity to the visual reference—was evaluated by two independent judges on a 1 (completely similar)—7 (very different) scale of accu- racy of reproduction. The overall correlation between the evaluations of the two judges was .85. This assessment was performed at the end of the second session for all participants. Procedure Each participant was assigned to either the metaphoric or the analytic learning condition in a random fashion and performed in three learning sessions. The participant performed in the first two learning sessions separated by 24 hours. At the end of the second session, the participant was asked to draw two different objects after listening to their musical graphs. A day later he or she returned to the laboratory to perform in a third learning session with a new set of stimuli. Each session lasted one hour on average. At the end of the third session the participant got paid commensurate with her or his performance. Results and Discussion In panel (A) of Figure 2 we present the learning (first two sessions) and transfer of learning (third session) using the metaphoric method. A glimpse at panel (A) of Figure 2 reveals the typical learning curve (gradual improvement mainly in the first couple of cycles) in the first session. Equally salient to inspection is the dramatic improvement in performance in the second session. So, a considerable amount of learning occurred, both within and across sessions, when the participants assigned a constant sound to a constant visual shape. However, transfer of learning was poor with the metaphoric method. When the original visual shapes were replaced by a new set in the third session, errors rebounded almost to the level observed at the beginning of the experiment. In the statistical analysis, the main factor of cycle [F(7, 264) = 24.07, p < .001] confirmed the learning that took place in each session. The main factor of session [F(7, 264) = 92.58, p < .001] confirmed the large improvement between the first ant the second sessions. A post hoc analysis with Bonferroni’s correction (p < .05) revealed that significant improvement (re- duction in rates of errors) occurred between the first and the second sessions. In panel (B) of Figure 2 we present the parallel data for the participants who learned by the analytic method. The functions (a) (b) Figure 2. The mean number of err ors per cycle observed in Experiment 2. (a) T h e metaphoric repr esentation method; (b) The analytic representa ti o n method. Copyright © 2012 SciRes. 414  O. SHENKAR, D. ALGOM in panel (B) of Fig k place ession [F g, we asked ea pants from the metaphoric condition were poor (often hardly two ju y relationship of the tw al motivation in this project was to help the visual im The participants perforons on separate days. In ure 2 document the learning that too in the first session as well as the large improvement in the sec- ond session. However, what is most revealing about the data with the analytic method is the impressive transfer of learning observed. As is shown in Figure 2, performance with a set of completely novel and unfamiliar stimuli was on a par with that attained with the original stimuli in the second session. Statistical analysis showed a reliable main factor of s (2, 264) = 12.29, p < .001], documenting the differential learning in the three sessions with the analytic method. A post hoc analysis with Bonferroni’s correction (p < .05) revealed significant improvement between the first and the second ses- sions and the first and the third sessions. An omnibus ANOVA across both conditions revealed that there were more errors in the analytic then the metaphoric method [F(1, 528) = 4.13, p < .001]. This difference reflects the enhanced difficulty of ac- quiring the principles of the analytic representation. Once ac- quired however, the individual reaps extraordinary gains in transfer of training to virtually any other stimulus. Indeed, the three-way interaction of method x cycle x session [F(14, 528) = 14.78, p < .01] confirmed the qualitative differences between the two methods of auditory representation. Learning is more difficult with the analytic method, but this disadvantage is off- set by its virtually unlim ited applicability. After completing the second session of learnin ch participant to attempt to draw a simple picture based on the musical graph of the referent visual stimulus. The partici- pants from the metaphoric condition were exposed to a short presentation of the method and principles of the analytic repre- sentation. The drawings shown in Figure 3 are typical. Those produced by participants from the analytic condition exhibited remarkable fidelity to the referent visual shape (never seen by the participant). In contrast, the drawings provided by partici- recognizable) surrogates of the referent visual stimuli. The mean ratings of similarity to the referent by the dges were 3.2 for the drawings of the participants from the analytic condition and 5.9 for those of the participants from the metaphoric condition [t(47) = 5.5, p = .01]. These results rein- force the ecological validity of the analytic method. The meta- phoric method, by contrast, is largely limited to the representa- tion of the original associations learned. The results revealed the complementar o methods of auditory representation. The metaphoric method was easy to learn, but it was obviously limited to the particular stimuli presented (in this respect they mimic envi- ronmental object-sound associations from everyday life). The analytic method entails a set of conversion rules, so that acqui- sition is tantamount to mastering a new language. Once ac- quired however, this new language is capable of representing new stimuli on a wide range. In the direct test of drawing a sound fed to the ears, the analytic method proved remarkably successful. Our eventu paired by producing a solid, scientifically based method of auditory representation. Therefore, in the next experiment we tested the analytic method developed in this study with a small sample of visually impaired individuals. Experiment 3 med in three sessi the first two sessions, they learned to represent geometric shapes by their auditory functions. In the third session, they attempted to harness their prior experience in order to acquire auditory representation for a new set of shapes as well as for a A drawing made by a pa r ti cipant The referent geometric shape A drawing made by a pacipant from the analytic condition generating the auditory graph (a) rti from the metaphoric condition A drawing made by a pa r ti cipat The referent object generating e A drawing made by a participant Figure 3. geometric shape (a) and a referent everyday object (b) generating the auditory graphs (in the n from the analytic condition th auditory graph (b) from the metaphoric condition A referent middle) and the drawings made on the basis of the sounds by participants from the metaphoric and the analytic conditions. Copyright © 2012 SciRes. 415  O. SHENKAR, D. ALGOM et of previously ntal objects. Finally, we Method ts visually impaired people, two males and two fe Apparatus and Stimuli y stimuli were those used in the ana- ly Design articipants attended three experimental sessions sepa- ra examined efficacy by asking the pa Procedure ing sessions took place in the participant’s home. N objects following their musical graphs. A day later he or she iscussion in Figure 4. Several features of the rthy. After the typical learning that to served over days [F(3, 48) = 3.10, p < .05]. The lack of a drawing based on its auditory function. The visual st th its most needy us and Conclusions In a series ferent meth- ods for auditohe first, the “m sunseen environme also tested the efficacy of the method by asking the visually impaired to make drawings of visual stimuli based solely on their auditory graphs fed into the ears. Participan A group of four males, participated in the experiment on a voluntary basis. Their condition allowed the identification of objects displayed on the monitor, as verified by a screening test. Selected were participants who correctly identified at least 90% of the 20 drawings presented. None of the participants suffered from any other (known) motor or neurological damage. Their age ranged between 25 and 35 years. They served in three experimental sessions lasting approximately 45 min each. The visual and auditor tic condition of Experiment 1, with a single notable exception. We presented only the first four of the visual stimuli and the corresponding sounds (in a 2 × 2 matrix and parallel response pad). In order to test learning as well as transfer of learning, the participants attended three sessions. In the first two sessions a set of geometric shapes was presented such that each shape was represented by its auditory function. In the third session, a new set of geometric shapes was presented as well as a set of envi- ronmental objects. All the other details of the presentation and response recording were the same as in Experiment 2. The p ted by 24 hours. Testing took place at the participant’s home. At the beginning of the first session, the participant received explanations on the principles of the analytic method followed by a few illustrations. On a trial, the four shapes were presented on the screen. The reduction in the number of stimuli was the result of a pilot study performed on another group of three visually impaired individuals. A larger number than four stim- uli presented a heavy cognitive load for these individuals. Each session came to end after completing four cycles of trials last- ing approximately 45 min. As in Experiment 2, we also rticipants to produce an outline drawing of the stimulus whose auditory representation was fed into the ears. These stimuli were never exposed before. Each participant made two such drawings based on different musical graphs. The quality of the drawings—their fidelity to the visual referent—was evalu- ated by two independent judges, on the same scales used in Experiment 2. The correlation between the evaluations pro- vided by the two judges was .76. The learn evertheless, we made efforts to standardize the environmental conditions. Thus, the participants were tested in a dimly lit room, seated in front of a desk on which we put the mobile computer, the response pad, and headphones. The first two learning sessions were separated by 24 hours. At the end of the second session, the participant was asked to draw two different performed in a third learning session with new sets of stimuli. Each session lasted 45 min, on average. At the end of the third session the participant received explanations about the purpose of the study. Results and D The results are presented data in Figure 4 are notewo ok place in the first session in day one, there was a marked improvement in the second session in day two. Notably too, the data from the third session in day three, exhibited appreciable amount of transfer of learning for both geometric shapes and environmental objects. The participants associated auditory representation for the new set of shapes and for the set of eve- ryday objects as easily as they did for the familiar shapes pre- sented in the second session. These results demonstrate the power of the analytic method developed in this study to repre- sent visual information by sounds with visually impaired indi- viduals. The reliable factor of session confirmed the improvement in learning ob a session x cycle interaction (F < 1) shows that the form of learning was similar in all days. The lack of a difference be- tween shapes and objects in the third session (F < 1) as well as their superior learning curves vis-à-vis the first session [F(2, 48) = 3.01, p < .05] shows the presence of an equal (and large) amount of a transfer of training. Once acquired the analytic method of representation extends naturally to all types of visual stimuli. In this experiment, too, we asked the visually impaired to produce imuli generating the sounds had not been previously pre- sented to the participants. One visual stimulus was a shape and another was a common everyday object (unbeknownst to the participants). Typical productions made by the visually im- paired participants are shown in the two panels of Figure 5 (one for the geometric shape and one for a meaningful object). The mean rating of fidelity to the unseen original was 3.1. This value betrays great similarity between the drawings and their visual referents. Clearly, the visually impaired benefited greatly from acquiring the principles of the analytic representation and applied them with considerable success. The results of Experiment 3 provide clear evidence that the analytic method works remarkably well wi ers, the visually impaired. This method requires a certain amount of learning, but the investment is justified by the con- siderable gains in the fidelity and large applicability of the auditory repres entation. Summary of experiments we developed two dif ry representation of visual stimuli. T etaphoric” method, makes use of familiar sounds to repre- sent visual objects. The second method, the “analytic” method, is a rule-based representation by which values of continuous auditory variables define points in space and create a dedicated and precise “auditory graph” to represent the referent visual stimulus. We observed learning with both methods. The ana- lytic method is singularly generalizeable and learning and Copyright © 2012 SciRes. 416  O. SHENKAR, D. ALGOM Figure 4. umber of errors per cycle under the analytic condition by visually impaired participants in Ex- The mean n periment 3. The same set of stimuli was presented in the first two sessions. In the third session, novel sets were presented: a new set of geometric shapes in one block, and everyday obj e c ts in a no t h er block. A typical d rawing made by a visual The referent geometric shape ) impaired participant (a generating the auditory graph A typical d rawing made by a visual The referent object generating Figure 5. eometric shape (a) and an everyday object (b) drawn by a displayed by normally ative pairs that were fetime or in the experiment). The analytic Bly, S. A. (1982). Communicating with sound. Proceedings of the International Conference on Computer Human Interface, 371-375. Bonebright, T. L., NeesT., & McCain, G. R. C impaired participant (b) the auditory graph A typical g visual impaired participant on the basis of sounds generated according to the respective auditory graphs. ansfer of learning were eminentlytr sighted participants as well as by the visually impaired. The results of earlier research made on environmental sounds were variable, useful in some cases, but not serviceable in other cases. Our study shows the learning potential of the metaphoric method, a generalization of environmental sounds. However, the main new feature of this study is the systematic comparison of the metaphoric and the analytic methods, a comparison missing from much earlier research. A major new tool used in this study was the active reproduc- tion of the stimuli by the participants. Much existing research is based on verbal estimations, descriptions, or simple motor reac- tions. In the current study, by contrast, the participants were actively drawing the visual stimuli based on their auditory con- versions. Therefore, this study enjoys a particularly strong eco- logical validity. Although representation by the metaphoric method is easily learned (over li m learned, it is limited to the specific associ ethod, by contrast, applies to all visual stimuli in two dimen- sions, natural or artificial. Because it is a high fidelity mathe- matical device, it represents objects in fine detail. One of the main potential implementations of the metaphoric method would be making easy access to visual computer dis- play objects, especially to small sized displays (on palms, mo- bile computers, and cellular phone). In such cases, one can represent toolbar and menu tasks by a natural sound (e.g., door opening sound for the “open file” command). The analytic method is recommended for cases where an obvious and imme- diate associative match between object and sound is limited or missing. In this case, there is a need for a rule-based method that can be generalized and implemented in many instances. The flexibility of the analytic method is well suited to acoustic displays of numerical data. Another implementation of acoustic parameters would be to facilitate a person’s orientation in space. Here, acoustic parameters can be used to map the space to a coordinates net. REFERENCES , M. A., Connerley, T. (2001). Testing the effectiveness of sonified graphs for education: A programmatic research project. Proceedings of the International Conference on Auditory Display, Espoo, 29 July-1 August 2001, 222-226. abrera, D., & Ferguson, S. (2007). Sonification of sound: Tools for teaching acoustic and audio. Proceedings of the International Con- ference on Auditory Display, Espoo, 29 July-1 August 2007, 483- 491. Flowers, J. H., & Hauer, T. A. (1992). The ear’s versus the eye’s poten- tial to assess characteristics of numeric data: Are we too visuocentric? Behavior Research Methods, Instruments, & Computers, 24, 258-264. doi:10.3758/BF03203504 Flowers, J. H., & Hauer, T. A. (1993). “Sound” alternatives to visual graphics for exploratory data analysis. Behavior Research Methods, Instruments, & Computers, 25, 242-249. doi:10.3758/BF03204505 Flowers, J. H., & Hauer, T. A. (1995). Musical versus visual graphs: Cross-modal equivalence in perception of time series data. Human Factors, 37, 553-569. doi:10.1518/001872095779049264 F., & Turnage, K. D. (1997). Cross-modal equivalence of visual and auditory scatterplots for exploring bivariate data samples. Human Factors, 39, 341-351. lowers, J. H., Buhman, D. C doi:10.1518/001872097778827151 Jacobson, R. D. (1998). Navigating maps with little or no sight: A Copyright © 2012 SciRes. 417  O. SHENKAR, D. ALGOM novel audio-tactile approach. Proceedings of Content Visualization and Intermedia Representation, 95-101. mes, F. (1998). Lessons from deveJa loping audio HTML Interfaces. Koviding interrelational Auditory Display, Espoo, 29 July-1 K dings of the International Conference on Mngineering, 39, Proceedings of ASSETS, 27-34. amel, H. M., & Roth, P., Sinha, R. R. (2001). Graphics and User’s Exploration via Simple Sonics (GUESS): Pr representation of objects in a non- vis ual env ironment. Proceedings of the International Conference on August 2001, 261-266. eller, J. M., Prathe r, E. E., Boynton, W. V ., Enos, H. L., Jon es, L. V., Pompea, S. M., Slater, T. F., & Quinn. M. (2003). Educational test- ing of an auditory display regarding seasonal variation of Martian polar ice caps. Procee Auditory Display, Boston, 6-9 July 2003, 21 2-215. eijer, P. B. L. (1992). An experimental system for auditory image representations. IEEE Transaction on Biomedical E 112-121. doi:10.1109/10.121642 ees, M. A., & Walker, B. N. (2007). Listener, task and audio graph: Toward a conceptual model on auditor Ny graph comprehension. Pro- Pternational Conference on Auditory Wings of the Interna- ceedings of the International Conference on Auditory Display, Mon- tréal, 26-29 June 2007, 266-273. irhonen, A. (2007). Semantics of sounds and images: Can they be paralleled? Proceedings of the In Display, Montr é al , 26-29 June 2007, 219- 3 25. alker, B. N., & Cothran, J. T. (2003). Sonification sandbox: A graphical toolkit for auditory graphs. Proceed tional Conference on Auditory Display, Boston, 6-9 July 2003, 161- 163. Copyright © 2012 SciRes. 418
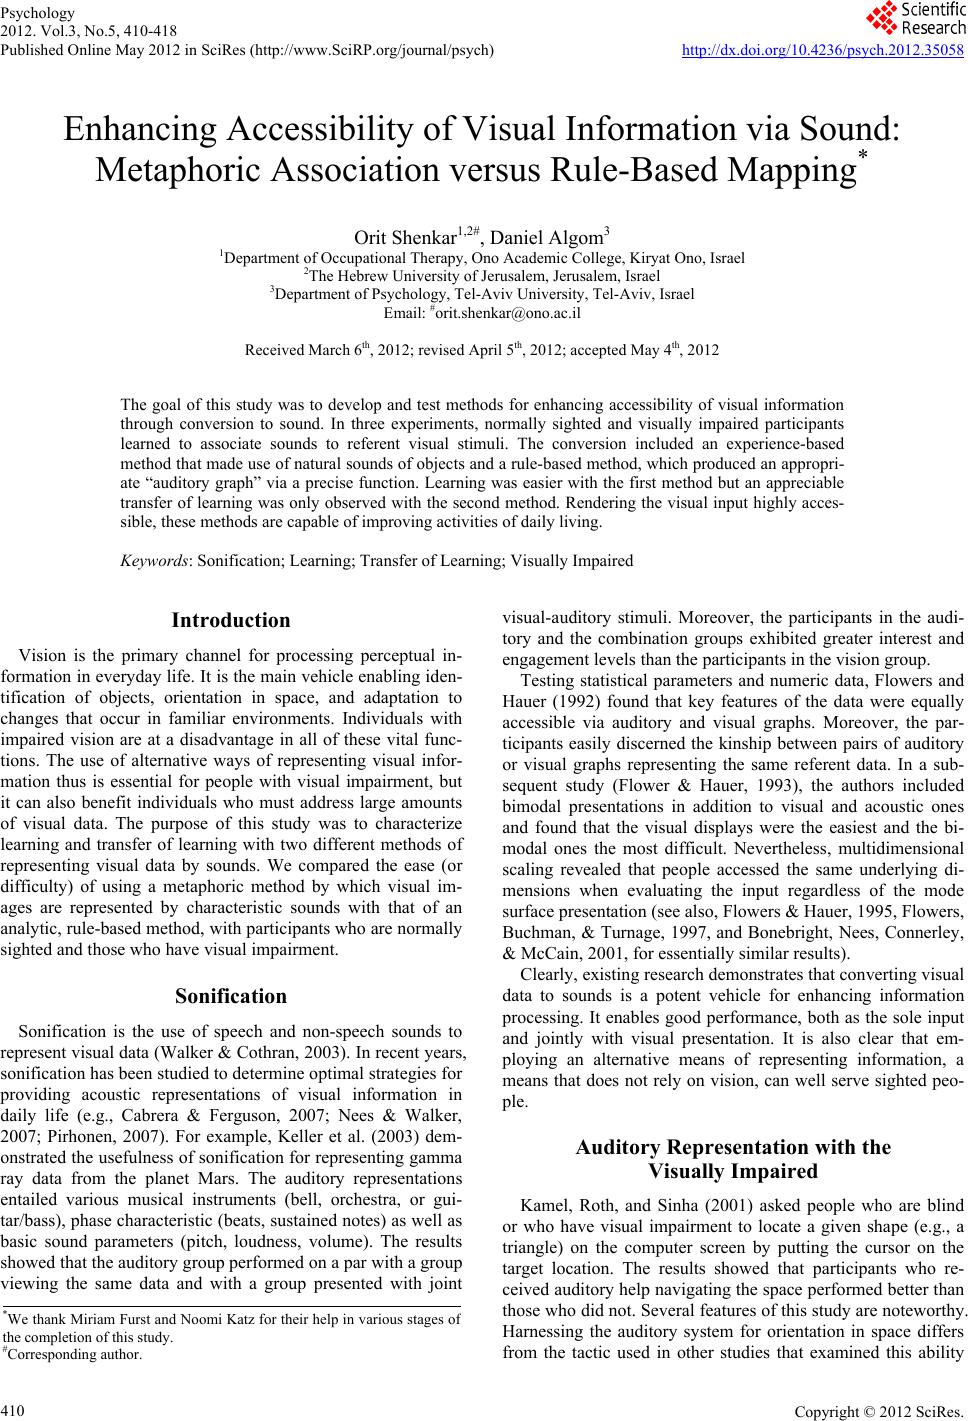
|