Paper Menu >>
Journal Menu >>
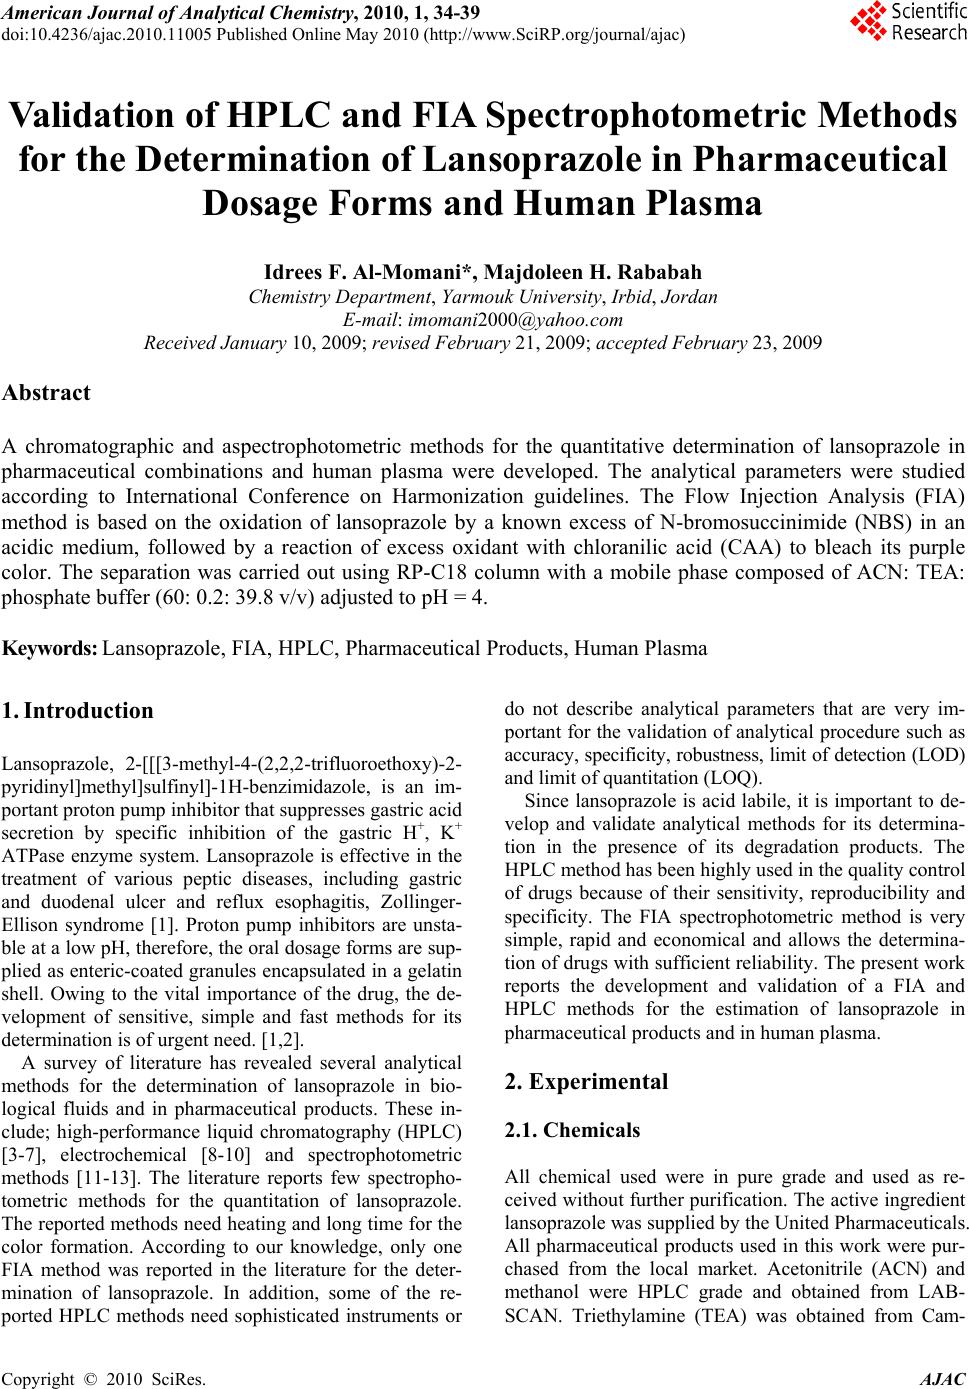 American Journal of Analytical Chemistry, 2010, 1, 34-39 doi:10.4236/ajac.2010.11005 Published Online May 2010 (http://www.SciRP.org/journal/ajac) Copyright © 2010 SciRes. AJAC Validation of HPLC and FIA Spectrophotometric Methods for the Determination of Lansoprazole in Pharmaceutical Dosage Forms and Human Plasma Idrees F. Al-Momani*, Majdoleen H. Rababah Chemistry Department, Yarmouk University, Irbid, Jordan E-mail: imomani2000@yahoo.com Received January 10, 2009; revised February 21, 2009; accepted February 23, 2009 Abstract A chromatographic and aspectrophotometric methods for the quantitative determination of lansoprazole in pharmaceutical combinations and human plasma were developed. The analytical parameters were studied according to International Conference on Harmonization guidelines. The Flow Injection Analysis (FIA) method is based on the oxidation of lansoprazole by a known excess of N-bromosuccinimide (NBS) in an acidic medium, followed by a reaction of excess oxidant with chloranilic acid (CAA) to bleach its purple color. The separation was carried out using RP-C18 column with a mobile phase composed of ACN: TEA: phosphate buffer (60: 0.2: 39.8 v/v) adjusted to pH = 4. Keywords: Lansoprazole, FIA, HPLC, Pharmaceutical Products, Human Plasma 1. Introduction Lansoprazole, 2-[[[3-methyl-4-(2,2,2-trifluoroethoxy)-2- pyridinyl]methyl]sulfinyl]-1H-benzimidazole, is an im- portant proton pump inhibitor that suppresses gastric acid secretion by specific inhibition of the gastric H+, K+ ATPase enzyme system. Lansoprazole is effective in the treatment of various peptic diseases, including gastric and duodenal ulcer and reflux esophagitis, Zollinger- Ellison syndrome [1]. Proton pump inhibitors are unsta- ble at a low pH, therefore, the oral dosage forms are sup- plied as enteric-coated granules encapsulated in a gelatin shell. Owing to the vital importance of the drug, the de- velopment of sensitive, simple and fast methods for its determination is of urgent need. [1,2]. A survey of literature has revealed several analytical methods for the determination of lansoprazole in bio- logical fluids and in pharmaceutical products. These in- clude; high-performance liquid chromatography (HPLC) [3-7], electrochemical [8-10] and spectrophotometric methods [11-13]. The literature reports few spectropho- tometric methods for the quantitation of lansoprazole. The reported methods need heating and long time for the color formation. According to our knowledge, only one FIA method was reported in the literature for the deter- mination of lansoprazole. In addition, some of the re- ported HPLC methods need sophisticated instruments or do not describe analytical parameters that are very im- portant for the validation of analytical procedure such as accuracy, specificity, robustness, limit of detection (LOD) and limit of quantitation (LOQ). Since lansoprazole is acid labile, it is important to de- velop and validate analytical methods for its determina- tion in the presence of its degradation products. The HPLC method has been highly used in the quality control of drugs because of their sensitivity, reproducibility and specificity. The FIA spectrophotometric method is very simple, rapid and economical and allows the determina- tion of drugs with sufficient reliability. The present work reports the development and validation of a FIA and HPLC methods for the estimation of lansoprazole in pharmaceutical products and in human plasma. 2. Experimental 2.1. Chemicals All chemical used were in pure grade and used as re- ceived without further purification. The active ingredient lansoprazole was supplied by the United Pharmaceuticals. All pharmaceutical products used in this work were pur- chased from the local market. Acetonitrile (ACN) and methanol were HPLC grade and obtained from LAB- SCAN. Triethylamine (TEA) was obtained from Cam-  I. F. AL-MOMANI ET AL.35 brian Chemicals. Phosphoric acid, N-bromosuccinimid and Chloranilic acid were obtained from Fluka Chemicals Ltd. Ultrapure water was used to prepare all solutions. All solutions were prepared daily. 2.2. Instrumentation and Analytical Conditions The FIA system was assembled from 0.51 mm micro line tubes. This manifold consists of three microline tubes (Figure 1). The first tube contains the carrier (0.2 M HCl) which carries the sample toward the first reaction coil in order to react with the reagent (NBS) which is pumped in the second tube. The CAA stream was then added at a rate of 1.0 mL/min in a confluence manner down stream to ensure rapid and adequate mixing. The excess NBS was then allowed to react with the CAA in the second reaction coil (RC2). After injection, the valve was re- turned to the load position when the maximum change in absorbance value has been reached. The absorbance of the remaining CAA was monitored at 530 nm by a Var- ian DMS-100 UV-Visible spectrophotometer equipped with an 18 µL flow cell. The HPLC method was performed on a Knauer model- 501 liquid chromatograph system. The system is equipped with a 20 µL manual injector, 10 mL ceramic head pump and a programmable variable wavelength UV detector. Eurochrom software was used for all chromatographic measurements. A reversed-phase column (15 cm × 4.0 mm ID., 5 µm particle size, C18 column) was used at ambient temperature. Lansoprazole was eluted isocrati- cally with a flow rate of 0.5 mL/min and monitored at 285 nm. The mobile phase was prepared by using ACN: TEA:phosphate buffer (60:0.2:39.8, v/v) adjusted to pH = 4 using phosphoric acid. The mobile phase was filtered using 0.45 µm PTFE filters, stirred and degassed before use. 2.3. Preparation of the Standard Solutions 1) N-bromosuccinimid (NBS): Accurately weighed 44.5 mg of NBS was transferred to 250 mL volumetric flask and dissolved in 0.1 M HCl. The final concentration was Sample RC1 Q; ml/min Waste C R1 R2 X RC2 Waste Spectrophotometer (530 nm) FC Computer P Sample RC1 Q; ml/min Waste C R1 R2 X RC2 Waste Spectrophotometer (530 nm) FC Computer P Figure (1): Schematic diagram of the proposed FIA system. P, peristaltic pump; X, confluence point; C, carrier solution, 0.2 M HCl; R1, 1.0 mM NBS; R2, 1.0 mM CAA; RC1 and RC2 are the reaction coils; FC, flow cell. 1.0 mM. 2) Chloranilic acid (CAA): Accurately weighed 52.0 mg of CAA was transferred to 250 mL volumetric flask and dissolved in ultrapure water. The final concentration was 1.0 mM. 3) Lansoprazole standard solutions: Accurately weighed 100.0 mg of lansoprazole reference standard was trans- ferred to 100 mL volumetric flask and dissolved in 0.1 M HCl. Standard solutions for linearity study were prepared by diluting the calculated volumes of the stock solution with 0.1 M HCl. 4) Internal standard: The internal standard (IS) solu- tion was prepared by dissolving 12.5 g of xanthon in 250 mL of methanol. The final concentration was 50 μg/mL. The solution was then used as a solvent to prepare all other solutions to be analyzed by HPLC. 2.4. Preparation of the Sample Solutions 1) Capsules: The contents of 10 capsules were emptied and finely powdered. The powder amount equivalent to 20.0 mg of lansoprazole was transferred to a 100 mL volumetric flask, stirred for 10 min with 0.1 M HCl and then diluted to volume with 0.1 M HCl. The solution was then filtered through 0.2 µm cellulose acetate syringe filters. The filtrate was used to prepare different concen- trations within the linearity range by proper dilution with 0.1 M HCl. Samples to be analyzed by the HPLC were diluted by the internal standard solution. 2) Spiked plasma samples (for HPLC method only): Plasma samples were supplied by the Blood Bank (Am- man) and stored as soon as possible at –4℃. After being thawed, known amounts of the drug under investigation were added to drug-free plasma (100-300 µL of the 1000 μg/mL per 0.5 mL plasma). After that, 1 mL of water was added. The mixture was vigorously mixed in a tube for 1 min and then allowed to stand for 10 min. This mixture was applied to a solid phase extraction cartridge (1 g of C18, obtained from Supelco Company) that had previously been activated with 1.0 mL of methanol fol- lowed by 1.0 mL of water. The cartridge was then washed with 2.0 mL of water and then with 1.0 mL of 40% methanol in water. Lansoprazole was then eluted with 2.0 mL of methanol. The solvent was then evapo- rated to dryness under gentle stream of nitrogen and the residue was re-dissolved in 5 mL of the internal standard solution and injected onto the HPLC column. 3) Recovery: The recovery following the extraction procedure was determined by comparing the peak areas of blank plasma sample extracted according to the above procedure with those of non-extracted control samples. The control samples were prepared by mixing solutions containing the same amounts of the drug (same concen- trations added to plasma samples) was directly injected into the HPLC apparatus. Copyright © 2010 SciRes. AJAC  I. F. AL-MOMANI ET AL. Copyright © 2010 SciRes. AJAC 36 3. Results and Discussion 3.1. Development of the Methods 3.1.1. FIA Method The proposed FIA method allows a rapid and economical quantitation of lansoprazole in pharmaceutical formula- tions without any time-consuming sample preparation. It was found that NBS can oxidize lansoprazole in an acidic medium. In addition, it reacts immediately with chloranilic acid (CAA) in an acidic medium to bleach out its purple color. Therefore, after the oxidation of lanso- prazole by NBS, the excess NBS was reacted with the CAA. The absorption spectrum of the remaining CAA which has a maximum absorption at 530 nm is recorded. Consequently, the different parameters affecting the oxidation reaction, and hence the subsequent determina- tion were optimized. The effect of the acidity on the completeness of the re- action, and consequently on the analytical signal, was studied over acidic and basic pH ranges. Different buffer solutions (acetate, citrate, borate and phosphate) were used as carriers. No significant influence for the buffer type on the analytical signal was observed. However, all results indicated that the reaction was better carried out in an acidic medium. Therefore, the reactions were carried out using different types of acids with different concentrations as carriers. Hydrochloric acid gave the best results, and therefore, was used for further investigations. Gradual increase in the analytical signal was observed upon in- creasing the HCl concentration. However, the stability of the baseline and consequently the reproducibility of the results were significantly reduced at higher HCl concen- trations. Therefore, 0.2 M HCl was used as a carrier as it gives reasonable sensitivity and baseline stability. The influence of changing CAA concentration on the analytical signal was studied at different concentrations of NBS (0.2-1.5 mM). Fixed volumes (100 μL) of lanso- prazole were injected into the HCl stream (Figure 1). Maximum analytical signals were obtained when the concentration of CAA was 1.0 mM. In addition, dif- ferent concentrations of NBS were tested. However, for all NBS and CAA combinations tested, best results were obtained when the NBS-to-CAA ratio was 1:1. Further- more, maximum analytical signal was obtained when 1.0 mM NBS was used. Concentrations that are higher than 1.0 mM for NBS were not tested due to its low solubility. Therefore, 1.0 mM NBS was used throughout this work. The effect of the reagents flow rate was studied keep- ing other conditions constant, over the range 1.0-4.8 mL/min, with equal flow in the three channels. The high- est signals were obtained when the total flow rate was 3.0 mL/min. At higher flow rates, irreproducible results and considerable decrease in the analytical signal was ob- served. A flow-rate of 1.0 mL/ min for each channel was chosen as a compromise between the peak shape, the sen- sitivity and the sampling time. With a flow rate of 1.0 mL/min, the analysis time for one injection was less than 50 seconds and the sample throughput was over 70 sam- ples/h. Two reaction coils were used in the manifold, as shown in Figure 1. The first coil (RC1), in which the oxidation of the drug by NBS took place, was changed over the range 30 to 150 cm. A considerable increase in the analytical signal was observed upon increasing the coil length up to 120 cm, and started to decrease after that. This indicates that the reaction between the drug under investigation and NBS was fast, and a further in- crease in the reaction coil length resulted in a significant peak broadening and a longer time to go back to the baseline. Therefore, the length of the first reaction coil (RC1) was chosen to be 120 cm to ensure high sensitiv- ity and a high measurement rate. Similarly, a significant change in the analytical signal was observed when the second reaction coil (RC2) was increased from 30 to 150 cm. Maximum analytical signals were obtained when RC2 was 50 cm. In order to investigate the influence of the injected sample volume on the analytical signal, different lengths of the sample loop were installed on the injector and tested. As expected, an increase in the injected sample volume leads to an increase in the peak height. Conse- quently, the sensitivity of measurements could be im- proved by increasing the sample volume. However, in- creasing the sample volume lead to an increase in the peak width and time for the signal to retain to the base- line. Thus, a 100 L volume was chosen that produced a reasonable sensitivity and sampling rate. 3.1.2. HPLC Method Chromatographic separation of lansoprazole from its degradation products was carried out using Novapak C18 column. The chromatographic conditions were adjusted in order to provide a good performance of the assay. Several mobile phases were prepared and tested in order to achieve these requirements. Mobile phase selection was based on peak parameters (symmetry, tailing), run time, easy of preparation and cost. In these trials the separation time was long (> 10 min) with a considerable tailing in lansoprazole peak. Therefore, in order to mini- mize the analysis time and to improve the separation efficiency, triethylamine (TEA) was added to the mobile phase in different ratios. Figure 2 shows a typical chro- matogram obtained from the analysis of a standard and a sample solution of lansoprazole using the proposed method. As shown, the lansoprazole peak is symmetrical and free from any chemical interference. 3.2. Validation of the Proposed Methods The methods were validated according to International Conference on Harmonization guidelines [14] for valida-  I. F. AL-MOMANI ET AL.37 0.2 0.4 0.6 0510 15 0.0 Abs. Time (min) 0.2 0.4 0.6 0510 15 0.0 Abs. Time (min) 0.2 0.4 0.6 0510 15 0.0 Abs. Time (min) (A) (B) (C) IS Lansoprazole 0.2 0.4 0.6 0510 15 0.0 Abs. Time (min) 0.2 0.4 0.6 0510 150510 150510 15 0.0 Abs. Time (min) 0.2 0.4 0.6 0510 15 0.0 Abs. Time (min) 0.2 0.4 0.6 0510 150510 150510 15 0.0 Abs. Time (min) 0.2 0.4 0.6 0510 15 0.0 Abs. Time (min) 0.2 0.4 0.6 0510 150510 150510 15 0.0 Abs. Time (min) (A) (B) (C) IS Lansoprazole (a) (b) (c) Figure 2. (a) Chromatograms for pure lansoprazole; (b) one of the commercial product, Lansozole; (c) plasma extract Concentration of lansoprazole in samples was 75 μg/mL. tion of analytical procedures. Analysis of variance (ANO- VA) was used to verify the validity of the methods. 3.2.1. FIA Method The calibration curve for the determination of lansopra- zole was obtained under the optimum conditions. The calibration graph was constructed by plotting concentra- tion versus peak area and showed good linearity in the 5- 150 μg/mL range. The representative linear equation was Y = 8.62 × 10⁻⁴ X + 1.70 × 10⁻³, with a correlation coef- ficient (r = 0.9988) highly significant for the method. The limit of detection (LOD) and limits of quantitation (LOQ) were determined on the basis of response and slope of the regression equation. The LOD and LOQ were found to be 5.0 and 16.4 μg/mL, respectively indi- cating a high sensitivity of the method. The intra-day (within-day) precision was evaluated by replicate analysis of lansoprazole within the linearity range at different time intervals. Three measurements were taken within the same day. Each time, a new cali- bration graph was constructed. The result obtained shows RSD of 1.7% indicating good intra-day precision. Simi- larly, the inter-day (different days) precision was evalu- ated on different days (3 days). The results indicated high precision, as the percent RSD was 2.3%. Figure 3 shows the flow signals for the calibration graph and re- producibility test. The reproducibility of the peak height was very good and the relative standard deviation of 10 injections was 1.4% (Figure 3(b)). The accuracy of the proposed FIA method was deter- mined by analyzing lansoprazole in synthetic mixtures. Percentage recovery from synthetic mixtures was deter- mined by comparing the peak areas obtained from com- mon excipients spiked with known amounts of lansopra- zole. Synthetic mixtures containing different concentra- tions of lansoprazole, in the presence of more than 100 folds of common additives were prepared. The additives that have been used in this study are; sodium saccharide, and citric acid. The undissolved material was filtered off 10 30 50 70 90 110 0 3 6 91215 Time, (min) Peak Height Blank 5 ppm 10 ppm 25 ppm 50 ppm 80 ppm Time (B) (A) 10 30 50 70 90 110 0 3 6 91215 Time, (min) Peak Height Blank 5 ppm 10 ppm 25 ppm 50 ppm 80 ppm 10 30 50 70 90 110 0 3 6 91215 Time, (min) Peak Height Blank 5 ppm 10 ppm 25 ppm 50 ppm 80 ppm Time (B) (A) (a) (b) Figure 3. Flow signals for the calibration graph and repro- ducibility test of lansoprazole. Table 1. Recovery of lansoprazole from synthetic mixtures and human plasma samples. Sample Added (μg/mL) % Recovery ± SD (n = 5) FIA HPLC Synthetic 40 102.3 ± 1.3 101.2 ± 0.9 80 97.8 ± 0.7 99.7 ± 0.6 120 98.6 ± 0.8 97.4 ± 2.4 Plasma 20 95.51 ± 3.2 50 96.9± 2.0 100 97.3 ± 1.1 before injection. The results obtained were compared with expected values and presented in Table 1. No sig- nificant changes were observed in the results and recov- eries close to 100% were achieved at all concentrations and the RSD does not exceed 2.5%. The closeness of the results to the label claim supports the accuracy of the method. 3.2.2. HPLC Method The calibration curves for lansoprazole were constructed by plotting concentration versus peak area and showed good linearity in the 2.0-120 μg/mL range. The repre- sentative linear equation was Y = 4.90 × 10⁻³ X + 1.10 × 10⁻³, with a correlation coefficient (0.9993) highly sig- nificant for the method. Figure 2 shows HPLC chroma- tograms for 75 μg/mL of (a) lansoprazole standard, (b) commercial product, lansazole, (c) plasma extract. As shown, excipients used as additives in pharmaceutical formulations did not interfere in the proposed proce- dures. The LOD and LOQ were found to be 2.0 and 7.0 μg/mL, respectively indicating a high sensitivity of the method. The precision of the method was determined by repeat- ability (intra-day) and (inter-day) and was expressed as %RSD of a series of measurement. The result obtained Copyright © 2010 SciRes. AJAC 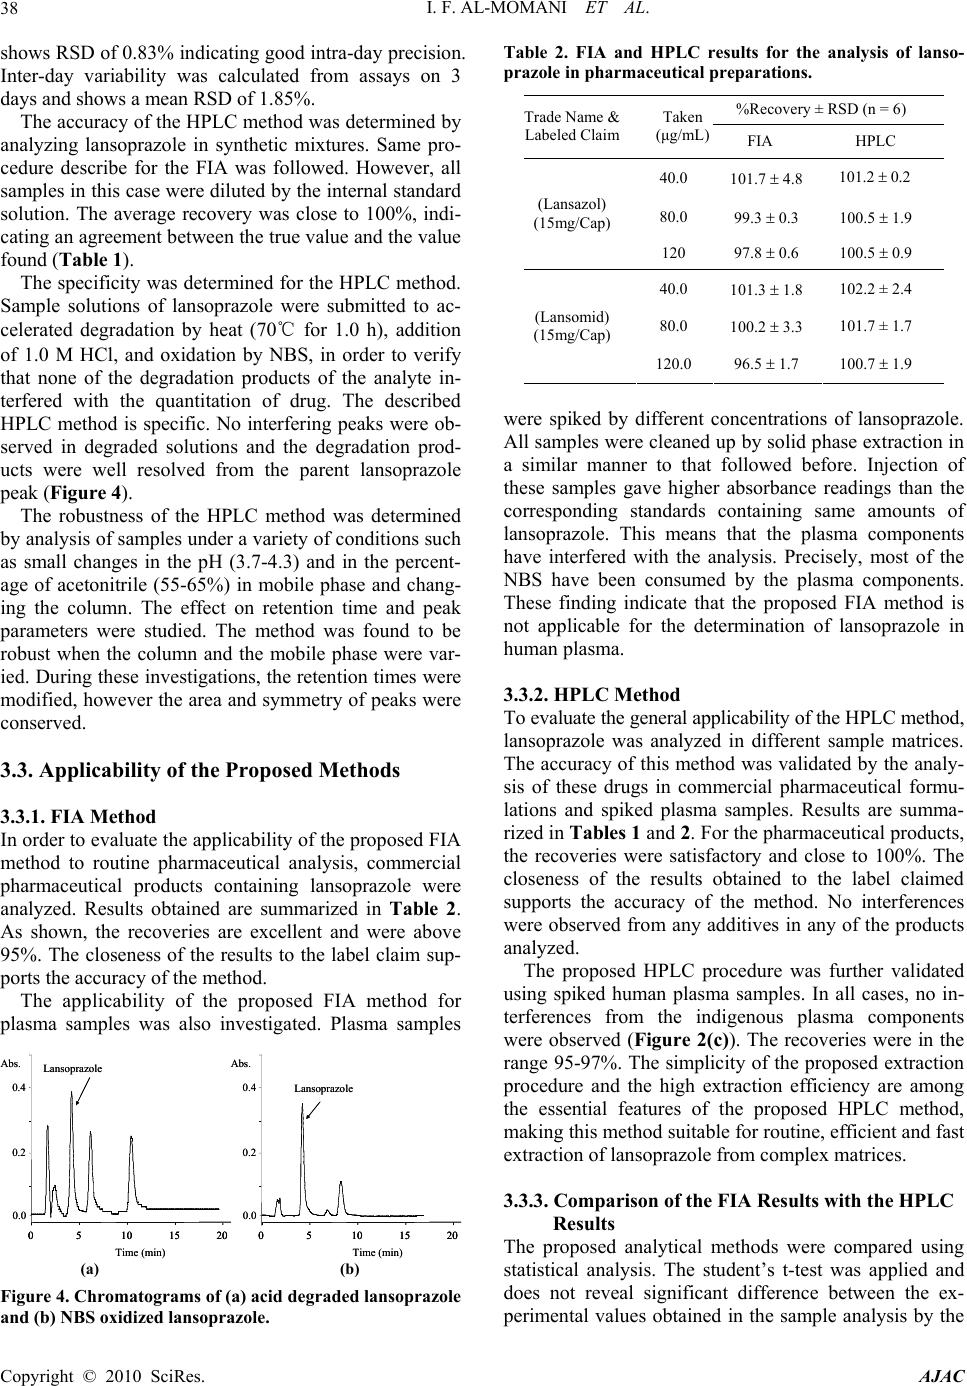 I. F. AL-MOMANI ET AL. Copyright © 2010 SciRes. AJAC 38 shows RSD of 0.83% indicating good intra-day precision. Inter-day variability was calculated from assays on 3 days and shows a mean RSD of 1.85%. The accuracy of the HPLC method was determined by analyzing lansoprazole in synthetic mixtures. Same pro- cedure describe for the FIA was followed. However, all samples in this case were diluted by the internal standard solution. The average recovery was close to 100%, indi- cating an agreement between the true value and the value found (Table 1). The specificity was determined for the HPLC method. Sample solutions of lansoprazole were submitted to ac- celerated degradation by heat (70℃ for 1.0 h), addition of 1.0 M HCl, and oxidation by NBS, in order to verify that none of the degradation products of the analyte in- terfered with the quantitation of drug. The described HPLC method is specific. No interfering peaks were ob- served in degraded solutions and the degradation prod- ucts were well resolved from the parent lansoprazole peak (Figure 4). The robustness of the HPLC method was determined by analysis of samples under a variety of conditions such as small changes in the pH (3.7-4.3) and in the percent- age of acetonitrile (55-65%) in mobile phase and chang- ing the column. The effect on retention time and peak parameters were studied. The method was found to be robust when the column and the mobile phase were var- ied. During these investigations, the retention times were modified, however the area and symmetry of peaks were conserved. 3.3. Applicability of the Proposed Methods 3.3.1. FIA Method In order to evaluate the applicability of the proposed FIA method to routine pharmaceutical analysis, commercial pharmaceutical products containing lansoprazole were analyzed. Results obtained are summarized in Table 2. As shown, the recoveries are excellent and were above 95%. The closeness of the results to the label claim sup- ports the accuracy of the method. The applicability of the proposed FIA method for plasma samples was also investigated. Plasma samples Time (min) (A) (B) 0.2 0.4 0.0 Abs. 051015 20 Lansoprazole 0.2 0.4 0.0 Abs. 0510 15 20 Lansoprazole Time (min)Time (min) (A) (B) 0.2 0.4 0.0 Abs. 051015 20051015 20 Lansoprazole 0.2 0.4 0.0 Abs. 0510 15 200510 15 20 Lansoprazole Time (min) (a) (b) Figure 4. Chromatograms of (a) acid degraded lansoprazole and (b) NBS oxidized lansoprazole. Table 2. FIA and HPLC results for the analysis of lanso- prazole in pharmaceutical preparations. %Recovery ± RSD (n = 6) Trade Name & Labeled Claim Taken (μg/mL) FIA HPLC 40.0 101.7 4.8 101.2 0.2 80.0 99.3 0.3 100.5 1.9 (Lansazol) (15mg/Cap) 120 97.8 0.6 100.5 0.9 40.0 101.3 1.8 102.2 ± 2.4 80.0 100.2 3.3 101.7 ± 1.7 (Lansomid) (15mg/Cap) 120.0 96.5 1.7 100.7 1.9 were spiked by different concentrations of lansoprazole. All samples were cleaned up by solid phase extraction in a similar manner to that followed before. Injection of these samples gave higher absorbance readings than the corresponding standards containing same amounts of lansoprazole. This means that the plasma components have interfered with the analysis. Precisely, most of the NBS have been consumed by the plasma components. These finding indicate that the proposed FIA method is not applicable for the determination of lansoprazole in human plasma. 3.3.2. HPLC Method To evaluate the general applicability of the HPLC method, lansoprazole was analyzed in different sample matrices. The accuracy of this method was validated by the analy- sis of these drugs in commercial pharmaceutical formu- lations and spiked plasma samples. Results are summa- rized in Tables 1 and 2. For the pharmaceutical products, the recoveries were satisfactory and close to 100%. The closeness of the results obtained to the label claimed supports the accuracy of the method. No interferences were observed from any additives in any of the products analyzed. The proposed HPLC procedure was further validated using spiked human plasma samples. In all cases, no in- terferences from the indigenous plasma components were observed (Figure 2(c)). The recoveries were in the range 95-97%. The simplicity of the proposed extraction procedure and the high extraction efficiency are among the essential features of the proposed HPLC method, making this method suitable for routine, efficient and fast extraction of lansoprazole from complex matrices. 3.3.3. Comparison of the FIA Results with the HPLC Results The proposed analytical methods were compared using statistical analysis. The student’s t-test was applied and does not reveal significant difference between the ex- perimental values obtained in the sample analysis by the 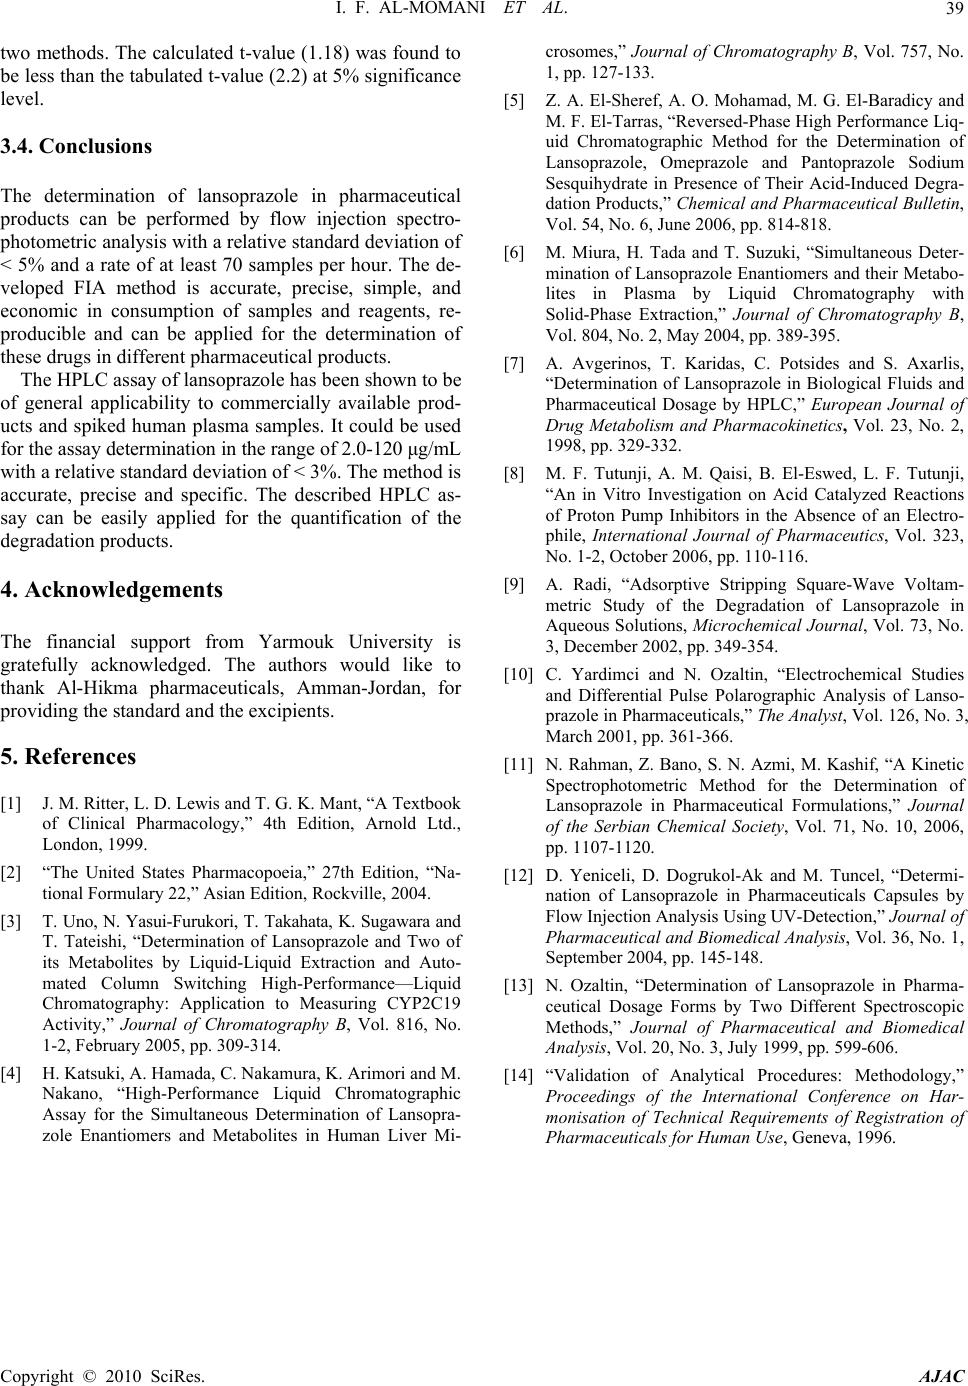 I. F. AL-MOMANI ET AL. Copyright © 2010 SciRes. AJAC 39 two methods. The calculated t-value (1.18) was found to be less than the tabulated t-value (2.2) at 5% significance level. 3.4. Conclusions The determination of lansoprazole in pharmaceutical products can be performed by flow injection spectro- photometric analysis with a relative standard deviation of < 5% and a rate of at least 70 samples per hour. The de- veloped FIA method is accurate, precise, simple, and economic in consumption of samples and reagents, re- producible and can be applied for the determination of these drugs in different pharmaceutical products. The HPLC assay of lansoprazole has been shown to be of general applicability to commercially available prod- ucts and spiked human plasma samples. It could be used for the assay determination in the range of 2.0-120 μg/mL with a relative standard deviation of < 3%. The method is accurate, precise and specific. The described HPLC as- say can be easily applied for the quantification of the degradation products. 4. Acknowledgements The financial support from Yarmouk University is gratefully acknowledged. The authors would like to thank Al-Hikma pharmaceuticals, Amman-Jordan, for providing the standard and the excipients. 5 . References [1] J. M. Ritter, L. D. Lewis and T. G. K. Mant, “A Textbook of Clinical Pharmacology,” 4th Edition, Arnold Ltd., London, 1999. [2] “The United States Pharmacopoeia,” 27th Edition, “Na- tional Formulary 22,” Asian Edition, Rockville, 2004. [3] T. Uno, N. Yasui-Furukori, T. Takahata, K. Sugawara and T. Tateishi, “Determination of Lansoprazole and Two of its Metabolites by Liquid-Liquid Extraction and Auto- mated Column Switching High-Performance—Liquid Chromatography: Application to Measuring CYP2C19 Activity,” Journal of Chromatography B, Vol. 816, No. 1-2, February 2005, pp. 309-314. [4] H. Katsuki, A. Hamada, C. Nakamura, K. Arimori and M. Nakano, “High-Performance Liquid Chromatographic Assay for the Simultaneous Determination of Lansopra- zole Enantiomers and Metabolites in Human Liver Mi- crosomes,” Journal of Chromatography B, Vol. 757, No. 1, pp. 127-133. [5] Z. A. El-Sheref, A. O. Mohamad, M. G. El-Baradicy and M. F. El-Tarras, “Reversed-Phase High Performance Liq- uid Chromatographic Method for the Determination of Lansoprazole, Omeprazole and Pantoprazole Sodium Sesquihydrate in Presence of Their Acid-Induced Degra- dation Products,” Chemical and Pharmaceutical Bulletin, Vol. 54, No. 6, June 2006, pp. 814-818. [6] M. Miura, H. Tada and T. Suzuki, “Simultaneous Deter- mination of Lansoprazole Enantiomers and their Metabo- lites in Plasma by Liquid Chromatography with Solid-Phase Extraction,” Journal of Chromatography B, Vol. 804, No. 2, May 2004, pp. 389-395. [7] A. Avgerinos, T. Karidas, C. Potsides and S. Axarlis, “Determination of Lansoprazole in Biological Fluids and Pharmaceutical Dosage by HPLC,” European Journal of Drug Metabolism and Pharmacokinetics, Vol. 23, No. 2, 1998, pp. 329-332. [8] M. F. Tutunji, A. M. Qaisi, B. El-Eswed, L. F. Tutunji, “An in Vitro Investigation on Acid Catalyzed Reactions of Proton Pump Inhibitors in the Absence of an Electro- phile, International Journal of Pharmaceutics, Vol. 323, No. 1-2, October 2006, pp. 110-116. [9] A. Radi, “Adsorptive Stripping Square-Wave Voltam- metric Study of the Degradation of Lansoprazole in Aqueous Solutions, Microchemical Journal, Vol. 73, No. 3, December 2002, pp. 349-354. [10] C. Yardimci and N. Ozaltin, “Electrochemical Studies and Differential Pulse Polarographic Analysis of Lanso- prazole in Pharmaceuticals,” The Analyst, Vol. 126, No. 3, March 2001, pp. 361-366. [11] N. Rahman, Z. Bano, S. N. Azmi, M. Kashif, “A Kinetic Spectrophotometric Method for the Determination of Lansoprazole in Pharmaceutical Formulations,” Journal of the Serbian Chemical Society, Vol. 71, No. 10, 2006, pp. 1107-1120. [12] D. Yeniceli, D. Dogrukol-Ak and M. Tuncel, “Determi- nation of Lansoprazole in Pharmaceuticals Capsules by Flow Injection Analysis Using UV-Detection,” Journal of Pharmaceutical and Biomedical Analysis, Vol. 36, No. 1, September 2004, pp. 145-148. [13] N. Ozaltin, “Determination of Lansoprazole in Pharma- ceutical Dosage Forms by Two Different Spectroscopic Methods,” Journal of Pharmaceutical and Biomedical Analysis, Vol. 20, No. 3, July 1999, pp. 599-606. [14] “Validation of Analytical Procedures: Methodology,” Proceedings of the International Conference on Har- monisation of Technical Requirements of Registration of Pharmaceuticals for Human Use, Geneva, 1996. |