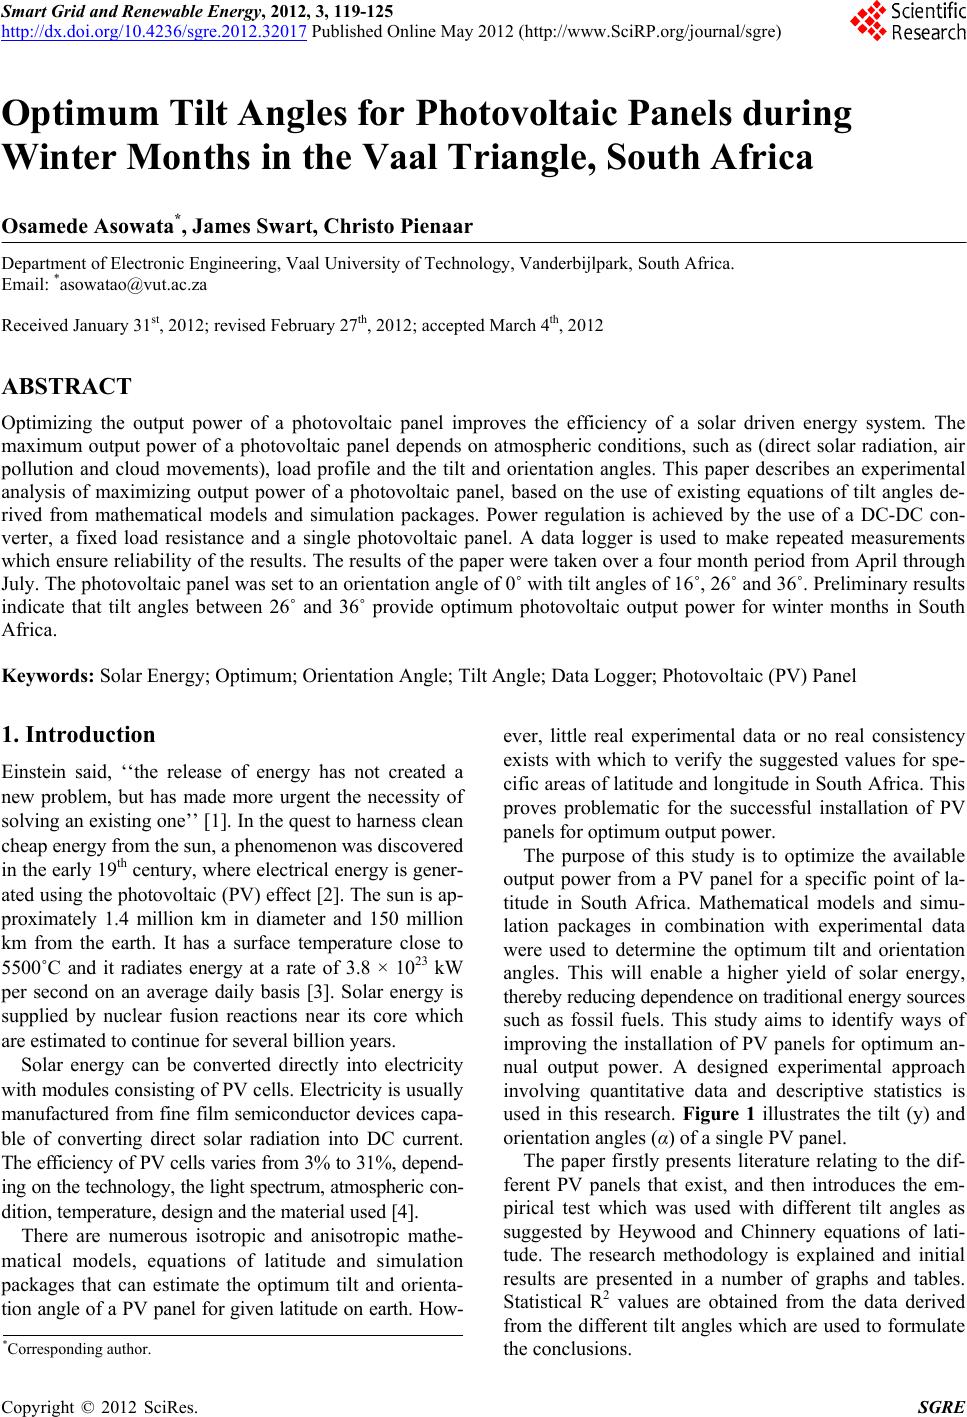
Optimum Tilt Angles for Photovoltaic Panels during Winter Months in the Vaal Triangle, South Africa
124
Table 5. Set of data for the mont hs of April throug h July us-
ing 12 V and 24 V DC-DC converters.
Regression
trend value
Week
ending
DC-DC
converter
voltage
Tilt angle
Conversion-time/
wk as a
percentage
0.567 20-May 24 V 16˚ 2.84%
0.573 29-July 12 V 16˚ 11.53%
0.577 13-May 24 V 16˚ 2.52%
0.597 15-July 12 V 16˚ 18.31%
0.609 27-May 24 V 36˚ 10.07%
0.611 22-April 24 V 36˚ 8.76%
0.616 24-June 12 V 26˚ 20.2%
0.623 6-May 24 V 26˚ 16.19%
0.629 1-July 12 V 26˚ 19.81%
0.631 10-June 12 V 36˚ 14.94%
0.632 17-June 12 V 36˚ 19.74%
0.656 29-April 24 V 26˚ 19.68%
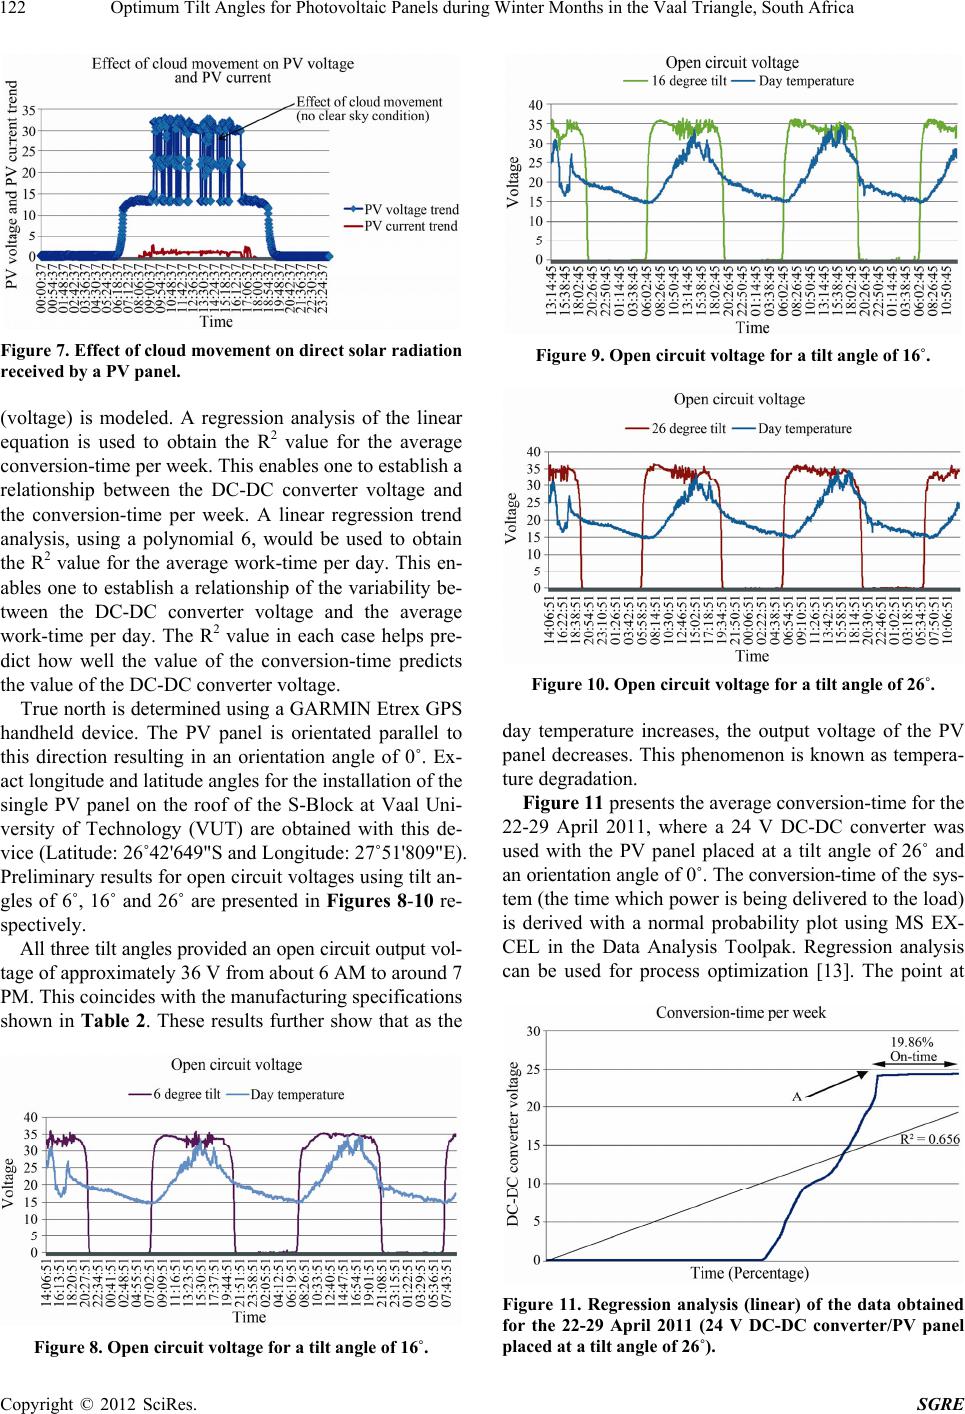
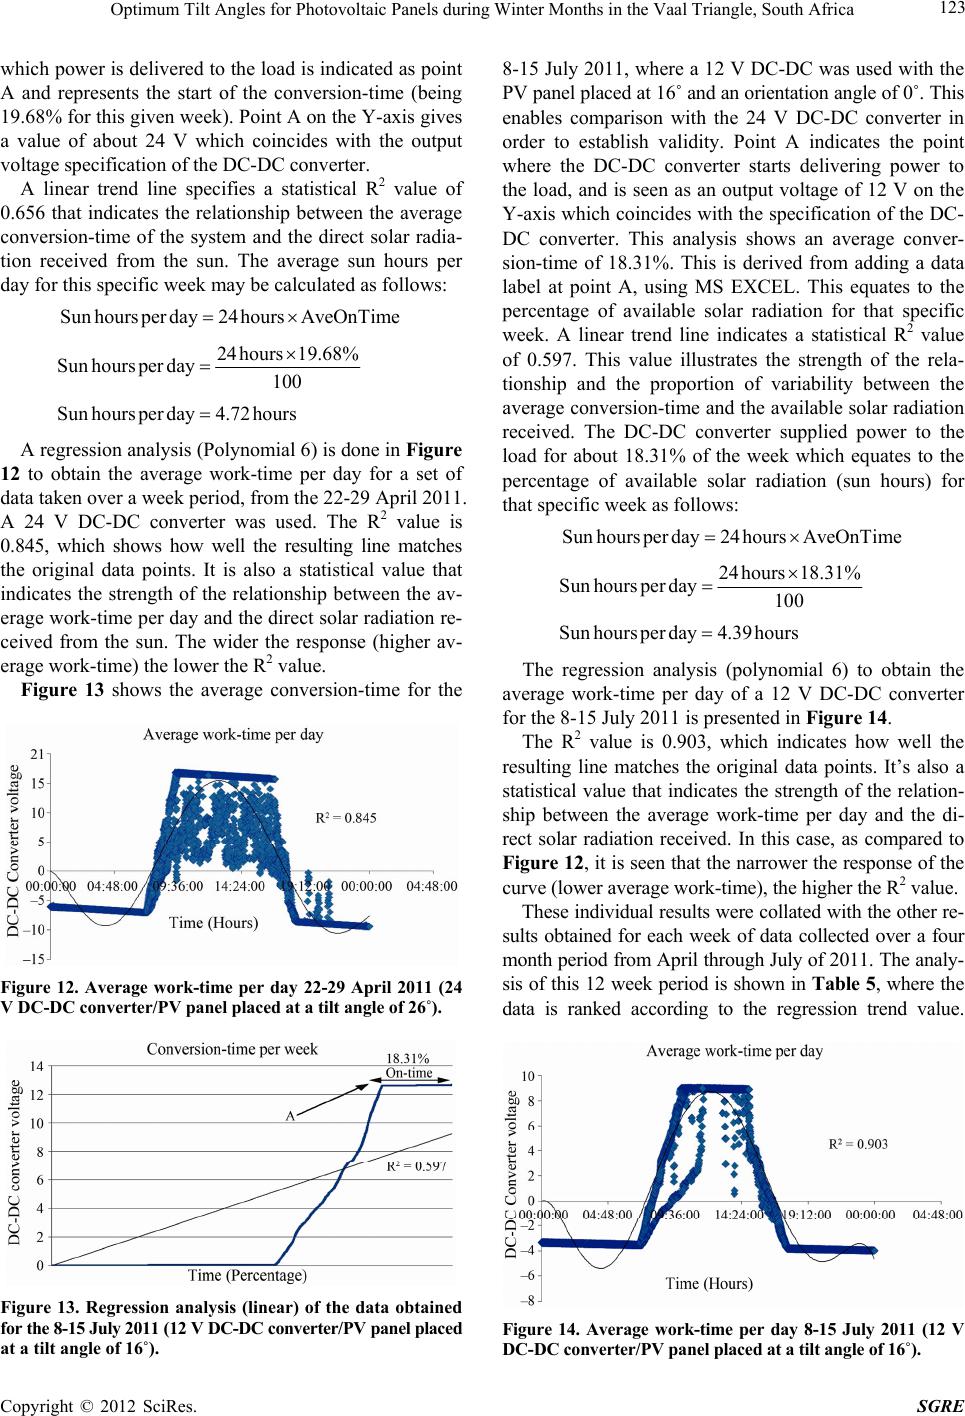
This regression trend line value (linear) indicates the rela-
tionship between the average conversion-time (actual di-
rect solar radiation received the PV panel for each week)
and the output voltage of the DC-DC converter.
5. Future Work
A new practical set-up comprising three identical PV
panels (each set to a different tilt angle of 16˚, 26˚ and
36˚) connected to identical solar chargers and load resis-
tances have been installed. This will expose the PV pan-
els to the same solar radiation and environmental factors
that influence their output power. This would enable an
accurate comparison of the data collected for each tilt
angle, thereby establishing validity. Figure 15 shows a
picture of the three identical PV panel set to different tilt
angles which have been installed on the roof of the S-
Block at VUT.
6. Conclusions
In review, the purpose of this research is to optimize the
Figure 15. Three identical solar panels set to tilt angles of
16˚, 26˚ and 36˚ degrees.
available output power from a PV panel, based on dif-
ferent tilt and orientation angles. The orientation angle is
initially fixed at 0˚, with only the tilt angle being varied.
Optimizing the output power will enable a higher yield of
solar energy, thereby reducing dependence on traditional
energy sources such as fossil fuels. The availability of
power was interpreted showing the average conversion-
time for the 22-29 April 2011 and for the 8-15 July 2011
(being 19.68% and 18.31% respectively, see Figures 11
and 13). The average conversion-time per week, for the
months of April through July with tilt angles of 16˚, 26˚
and 36˚ and a fixed orientation angle of 0˚ is presented in
Table 5. From the results gathered, doing a linear regres-
sion analysis reveals that generally the higher the average
conversion-time per week the higher the R2 value. A com-
parison between Figures 12 and 14 reveals that the values
of the linear trend value (polynomial 6) are not similar.
This is because Figure 12 represents a broader response
curve (higher average work-time per day giving an R2
value of 0.845) than Figure 14 (lower average work-time
per day giving an R2 value of 0.903).
The peak winter months in South Africa are June and
July, which indicated the highest regression trend value
(linear) for 26˚ and 36˚ tilt angles (see Table 5). This co-
incides with earlier endeavors to calculate the proper
choice of tilt angles using mathematical and simulation
models based on the research done by Chinnery [14]. These
initial experimental results therefore prove the validity
and reliability of these models for winter months in the
Vaal Triangle, South Africa.
REFERENCES
[1] A. Einstein, “Albert Einstein Quotes, 1879-1995,” Accessed
on 30 May 2011.
http//www.phnet.fi/public/mamma1/einstein.htm
[2] M. Boxwell, “Solar Electricity Handbook, a Simple Prac-
tical Guide to Solar Energy-Designing and Installing Photo-
voltaic Solar Electric Systems,” 2nd Edition, Code Green
publishing, London, 2010, p. 3.
[3] K. Lovegrove and M. Dennis, “Solar Thermal Energy Sys-
tems in Australia,” International Journal of Environmen-
tal Studies, Vol. 63, No. 6, 2006, pp. 791-802.
doi:10.1080/00207230601047156
[4] F. A. Farret and M. G. Simoes, “Integration of Alternative
Sources of Energy,” John Wiley Press, Hoboken, 2006, p.
129. doi:10.1002/0471755621.ch6
[5] Hub Pages, Accessed on 28 October 2011
http://akihan.hubpages.com/hub/types-of-pv-cells
[6] Solar Facts, Accessed on 29 November 2011.
http://www.solar-facts.com/panels/panel-types.php
[7] Moukd. Information about Different Types of Solar Pan-
els, Accessed on 30 October 2011.
http://www.moukd.com
[8] T. Markvart and L. Castaner, “Practical Handbook of
Photovoltaic Fundamentals and Application,” Elsevier
Copyright © 2012 SciRes. SGRE