Paper Menu >>
Journal Menu >>
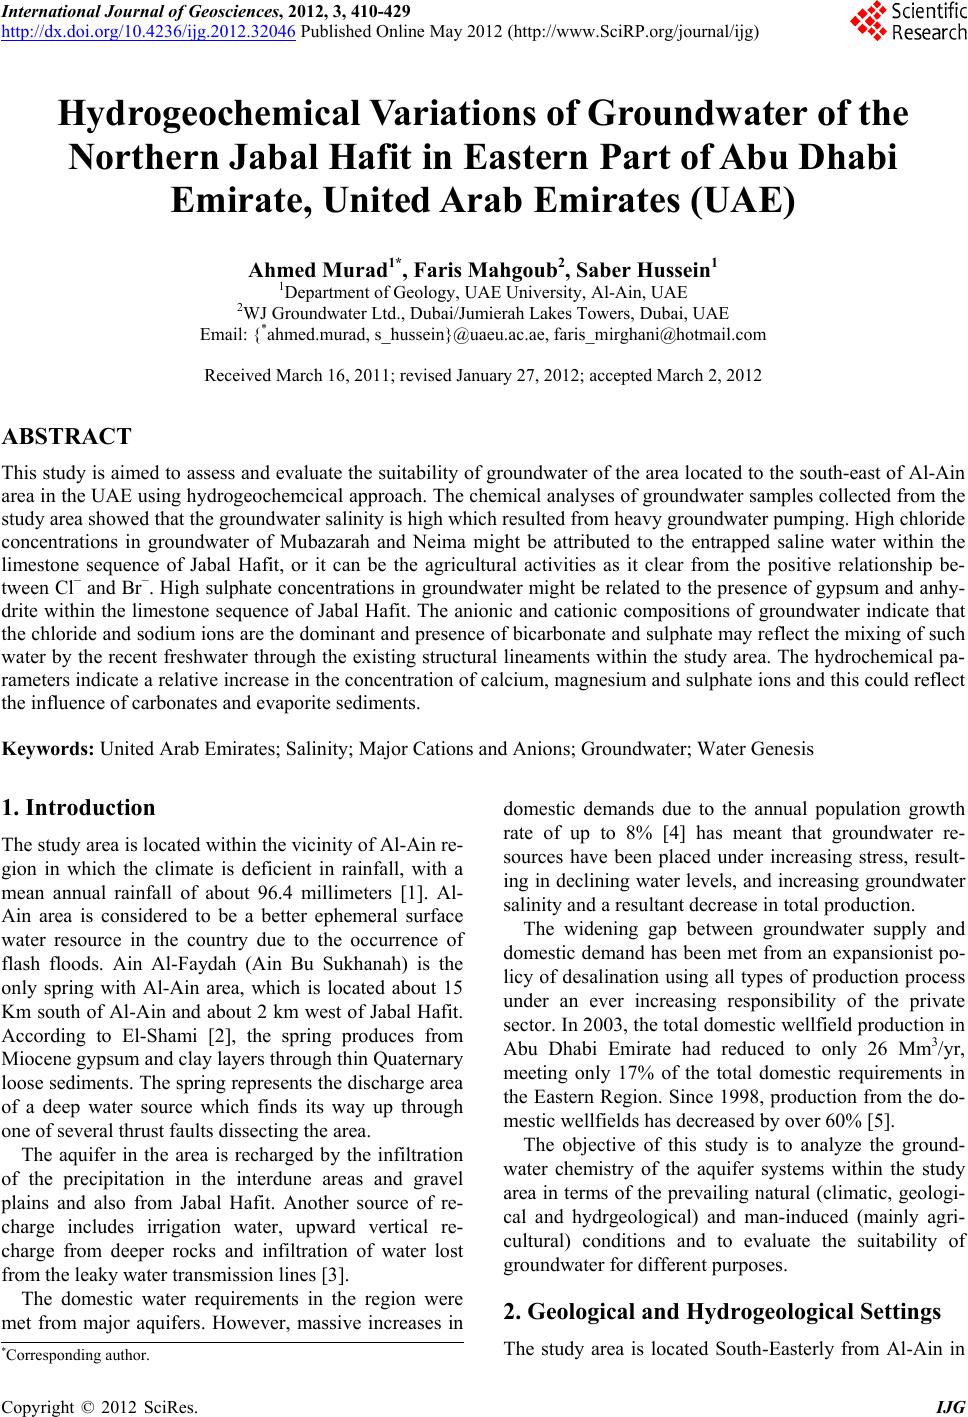 International Journal of Geosciences, 2012, 3, 410-429 http://dx.doi.org/10.4236/ijg.2012.32046 Published Online May 2012 (http://www.SciRP.org/journal/ijg) Hydrogeochemical Variations of Groundwater of the Northern Jabal Hafit in Eastern Part of Abu Dhabi Emirate, United Arab Emirates (UAE) Ahmed Murad1*, Faris Mahgoub2, Saber Hussein1 1Department of Geology, UAE University, Al-Ain, UAE 2WJ Groundwater Ltd., Dubai/Jumierah Lakes Towers, Dubai, UAE Email: {*ahmed.murad, s_hussein}@uaeu.ac.ae, faris_mirghani@hotmail.com Received March 16, 2011; revised January 27, 2012; accepted March 2, 2012 ABSTRACT This study is aimed to assess and evaluate the suitability of groundwater of the area located to the south-east of Al-Ain area in the UAE using hydrogeochemcical approach. The chemical analyses of groundwater samples collected from the study area showed that the groundwater salinity is high which resulted from heavy groundwater pumping. High chloride concentrations in groundwater of Mubazarah and Neima might be attributed to the entrapped saline water within the limestone sequence of Jabal Hafit, or it can be the agricultural activities as it clear from the positive relationship be- tween Cl− and Br−. High sulphate concentrations in groundwater might be related to the presence of gypsum and anhy- drite within the limestone sequence of Jabal Hafit. The anionic and cationic compositions of groundwater indicate that the chloride and sodium ions are the dominant and presence of bicarbonate and sulphate may reflect the mixing of such water by the recent freshwater through the existing structural lineaments within the study area. The hydrochemical pa- rameters indicate a relative increase in the concentration of calcium, magnesium and sulphate ions and this could reflect the influence of carbonates and evaporite sediments. Keywords: United Arab Emirates; Salinity; Major Cations and Anions; Groundwater; Water Genesis 1. Introduction The study area is located within the vicinity of Al-Ain re- gion in which the climate is deficient in rainfall, with a mean annual rainfall of about 96.4 millimeters [1]. Al- Ain area is considered to be a better ephemeral surface water resource in the country due to the occurrence of flash floods. Ain Al-Faydah (Ain Bu Sukhanah) is the only spring with Al-Ain area, which is located about 15 Km south of Al-Ain and about 2 km west of Jabal Hafit. According to El-Shami [2], the spring produces from Miocene gypsum and clay layers through thin Quaternary loose sediments. The spring represents the discharge area of a deep water source which finds its way up through one of several thrust faults dissecting the area. The aquifer in the area is recharged by the infiltration of the precipitation in the interdune areas and gravel plains and also from Jabal Hafit. Another source of re- charge includes irrigation water, upward vertical re- charge from deeper rocks and infiltration of water lost from the leaky water transmission lines [3]. The domestic water requirements in the region were met from major aquifers. However, massive increases in domestic demands due to the annual population growth rate of up to 8% [4] has meant that groundwater re- sources have been placed under increasing stress, result- ing in declining water levels, and increasing groundwater salinity and a resultant decrease in total production. The widening gap between groundwater supply and domestic demand has been met from an expansionist po- licy of desalination using all types of production process under an ever increasing responsibility of the private sector. In 2003, the total domestic wellfield production in Abu Dhabi Emirate had reduced to only 26 Mm3/yr, meeting only 17% of the total domestic requirements in the Eastern Region. Since 1998, production from the do- mestic wellfields has decreased by over 60% [5]. The objective of this study is to analyze the ground- water chemistry of the aquifer systems within the study area in terms of the prevailing natural (climatic, geologi- cal and hydrgeological) and man-induced (mainly agri- cultural) conditions and to evaluate the suitability of groundwater for different purposes. 2. Geological and Hydrogeological Settings The study area is located South-Easterly from Al-Ain in *Corresponding author. C opyright © 2012 SciRes. IJG 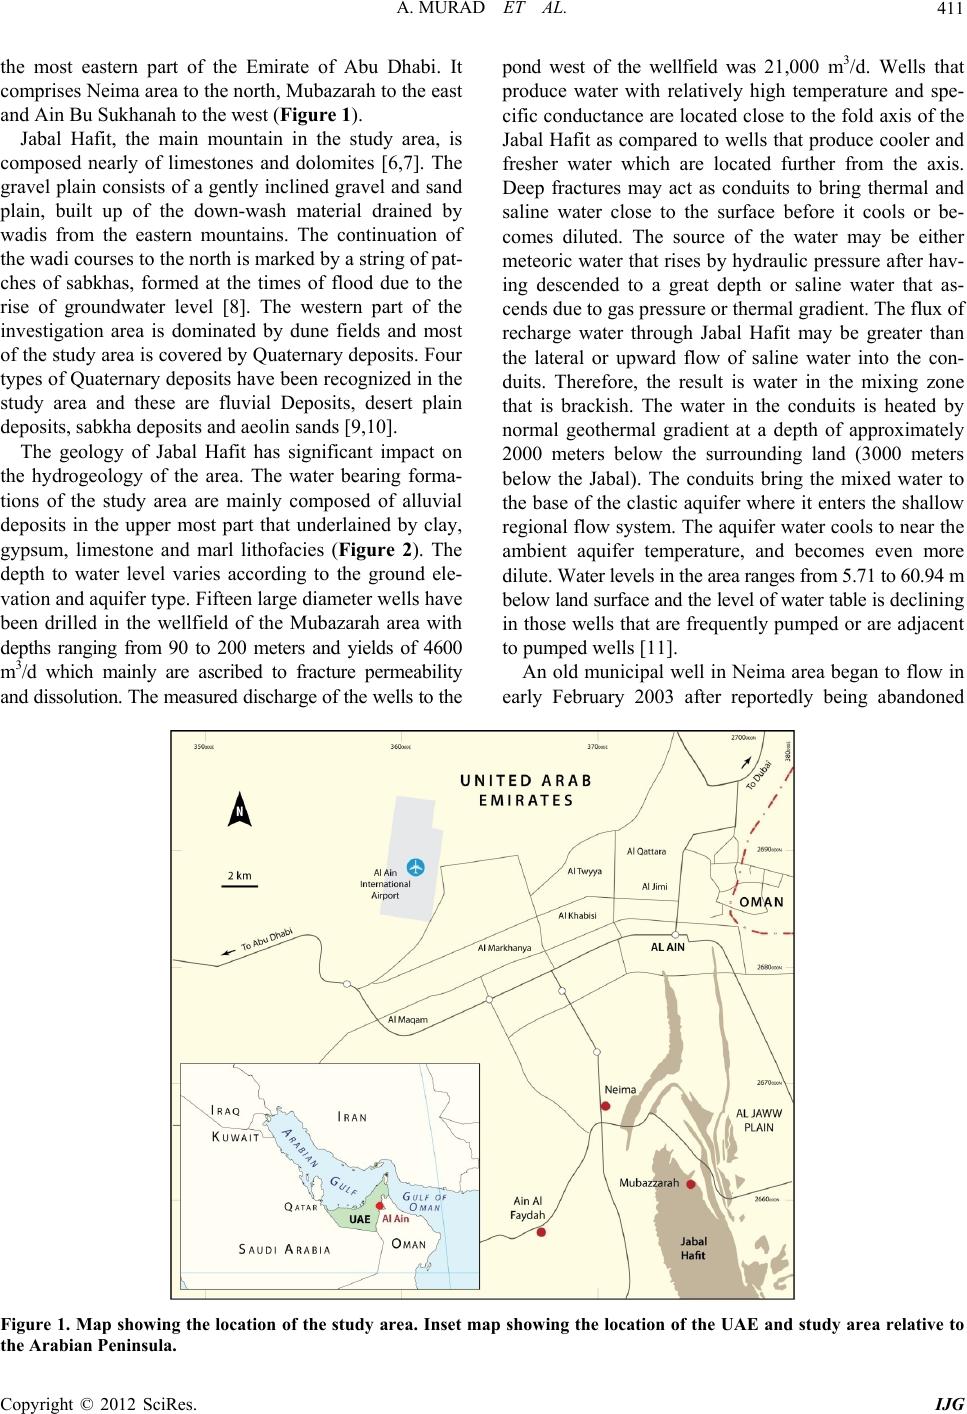 A. MURAD ET AL. 411 the most eastern part of the Emirate of Abu Dhabi. It comprises Neima area to the north, Mubazarah to the east and Ain Bu Sukhanah to the west (Figure 1). Jabal Hafit, the main mountain in the study area, is composed nearly of limestones and dolomites [6,7]. The gravel plain consists of a gently inclined gravel and sand plain, built up of the down-wash material drained by wadis from the eastern mountains. The continuation of the wadi courses to the north is marked by a string of pat- ches of sabkhas, formed at the times of flood due to the rise of groundwater level [8]. The western part of the investigation area is dominated by dune fields and most of the study area is covered by Quaternary deposits. Four types of Quaternary deposits have been recognized in the study area and these are fluvial Deposits, desert plain deposits, sabkha deposits and aeolin sands [9,10]. The geology of Jabal Hafit has significant impact on the hydrogeology of the area. The water bearing forma- tions of the study area are mainly composed of alluvial deposits in the upper most part that underlained by clay, gypsum, limestone and marl lithofacies (Figure 2). The depth to water level varies according to the ground ele- vation and aquifer type. Fifteen large diameter wells have been drilled in the wellfield of the Mubazarah area with depths ranging from 90 to 200 meters and yields of 4600 m3/d which mainly are ascribed to fracture permeability and dissolution. The measured discharge of the wells to the pond west of the wellfield was 21,000 m3/d. Wells that produce water with relatively high temperature and spe- cific conductance are located close to the fold axis of the Jabal Hafit as compared to wells that produce cooler and fresher water which are located further from the axis. Deep fractures may act as conduits to bring thermal and saline water close to the surface before it cools or be- comes diluted. The source of the water may be either meteoric water that rises by hydraulic pressure after hav- ing descended to a great depth or saline water that as- cends due to gas pressure or thermal gradient. The flux of recharge water through Jabal Hafit may be greater than the lateral or upward flow of saline water into the con- duits. Therefore, the result is water in the mixing zone that is brackish. The water in the conduits is heated by normal geothermal gradient at a depth of approximately 2000 meters below the surrounding land (3000 meters below the Jabal). The conduits bring the mixed water to the base of the clastic aquifer where it enters the shallow regional flow system. The aquifer water cools to near the ambient aquifer temperature, and becomes even more dilute. Water levels in the area ranges from 5.71 to 60.94 m below land surface and the level of water table is declining in those wells that are frequently pumped or are adjacent to pumped wells [11]. An old municipal well in Neima area began to flow in early February 2003 after reportedly being abandoned Figure 1. Map showing the location of the study area. Inset map showing the location of the UAE and study area relative to the Arabian Peninsula. Copyright © 2012 SciRes. IJG 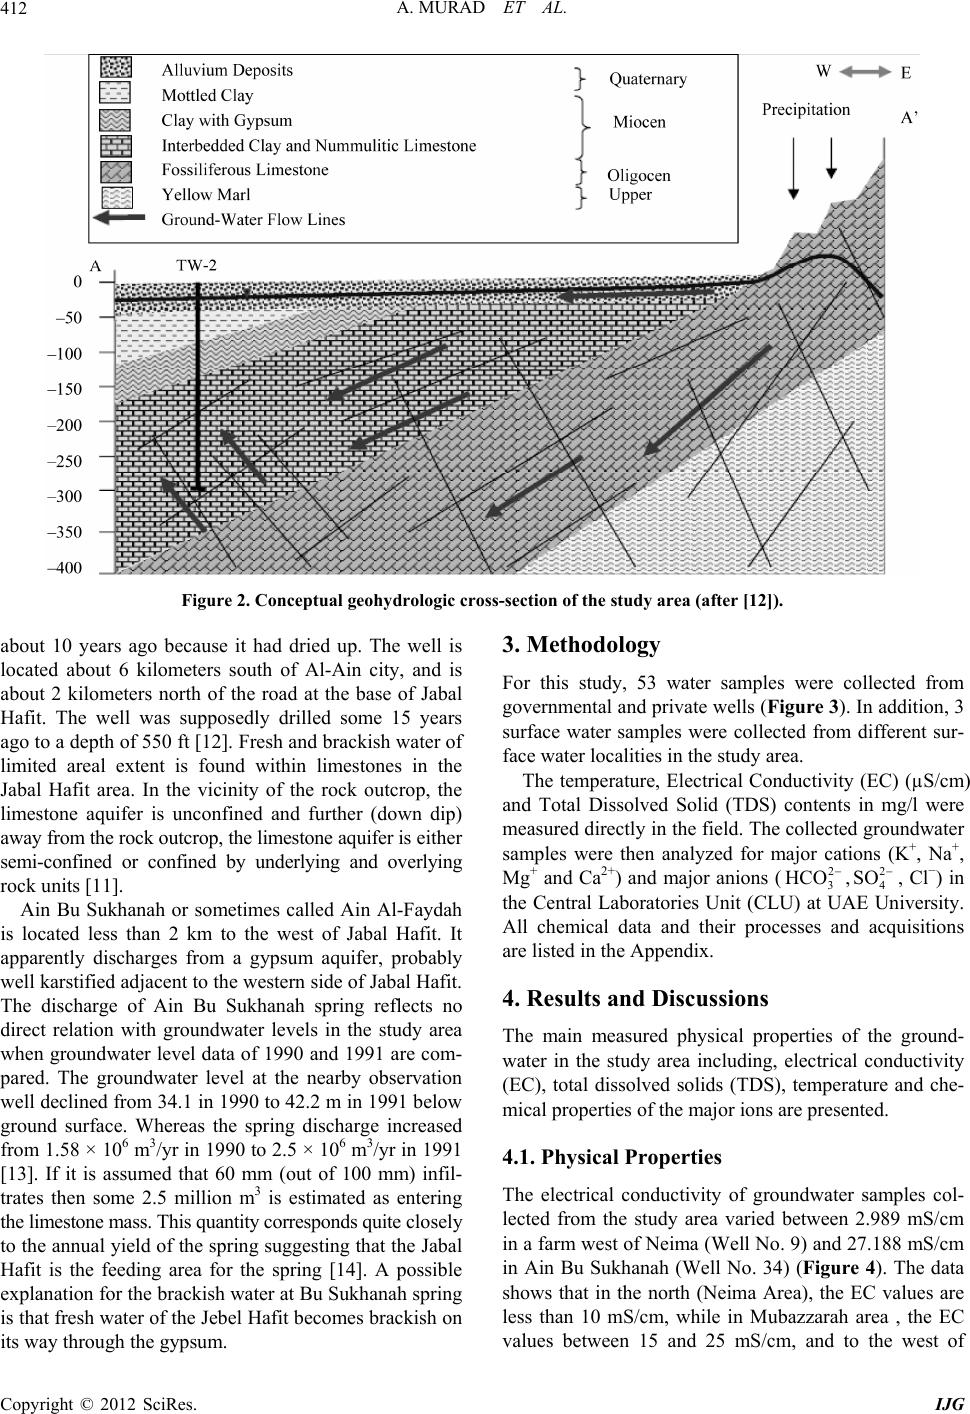 A. MURAD ET AL. 412 Figure 2. Conceptual geohydrologic cross-section of the study area (after [12]). about 10 years ago because it had dried up. The well is located about 6 kilometers south of Al-Ain city, and is about 2 kilometers north of the road at the base of Jabal Hafit. The well was supposedly drilled some 15 years ago to a depth of 550 ft [12]. Fresh and brackish water of limited areal extent is found within limestones in the Jabal Hafit area. In the vicinity of the rock outcrop, the limestone aquifer is unconfined and further (down dip) away from the rock outcrop, the limestone aquifer is either semi-confined or confined by underlying and overlying rock units [11]. Ain Bu Sukhanah or sometimes called Ain Al-Faydah is located less than 2 km to the west of Jabal Hafit. It apparently discharges from a gypsum aquifer, probably well karstified adjacent to the western side of Jabal Hafit. The discharge of Ain Bu Sukhanah spring reflects no direct relation with groundwater levels in the study area when groundwater level data of 1990 and 1991 are com- pared. The groundwater level at the nearby observation well declined from 34.1 in 1990 to 42.2 m in 1991 below ground surface. Whereas the spring discharge increased from 1.58 × 10⁶ m3/yr in 1990 to 2.5 × 10⁶ m3/yr in 1991 [13]. If it is assumed that 60 mm (out of 100 mm) infil- trates then some 2.5 million m3 is estimated as entering the limestone mass. This quantity corresponds quite closely to the annual yield of the spring suggesting that the Jabal Hafit is the feeding area for the spring [14]. A possible explanation for the brackish water at Bu Sukhanah spring is that fresh water of the Jebel Hafit becomes brackish on its way through the gypsum. 3. Methodology For this study, 53 water samples were collected from governmental and private wells (Figure 3). In addition, 3 surface water samples were collected from different sur- face water localities in the study area. The temperature, Electrical Conductivity (EC) (µS/cm) and Total Dissolved Solid (TDS) contents in mg/l were measured directly in the field. The collected groundwater samples were then analyzed for major cations (K+, Na+, Mg+ and Ca2+) and major anions (3,4 2 HCO 2 SO , Cl−) in the Central Laboratories Unit (CLU) at UAE University. All chemical data and their processes and acquisitions are listed in the Appendix. 4. Results and Discussions The main measured physical properties of the ground- water in the study area including, electrical conductivity (EC), total dissolved solids (TDS), temperature and che- mical properties of the major ions are presented. 4.1. Physical Properties The electrical conductivity of groundwater samples col- lected from the study area varied between 2.989 mS/cm in a farm west of Neima (Well No. 9) and 27.188 mS/cm in Ain Bu Sukhanah (Well No. 34) (Figure 4). The data shows that in the north (Neima Area), the EC values are less than 10 mS/cm, while in Mubazzarah area , the EC values between 15 and 25 mS/cm, and to the west of Copyright © 2012 SciRes. IJG  A. MURAD ET AL. 413 367000 368000 369000 370000 371000 372000 373000 374000 375000 2661000 2662000 2663000 2664000 2665000 2666000 2667000 2668000 2669000 2670000 2671000 2672000 2673000 12 34 5 6 7 8 9 10 11 12 13 14 15 16 17 18 19 20 21 22 23 24 25 26 27 28 29 30 31 32 33 34 35 36 37 38 39 40 41 42 43 45 46 47 48 49 50 51 52 53 54 55 56 Figure 3. Map showing the location of groundwater samples in the study area. Jabal Hafit at Ain Bu Sukhanah, the EC values exceed 30 mS/cm. These high EC values might result from using the groundwater in these areas in agricultural activities. In the study area, the total salinity of groundwater ranges between 1910 and 17,400 mg/l, with a mean value of 6714 mg/l (Figure 5). The salinity increases from east to west in the direction of groundwater flow. The higher salinity content is recorded for the central and western regions (Mubazarah and Ain-Bu Sukhanah areas), whe- reas at Neima area in the north, it is quite low and in- creases towards the south. Groundwater samples of the study area are classified as brackish except Wells No. 34, 36 and 38 which are of saline water based on USGS/ NDC classification [3]. Using ground-water for irrigation purposes is the main reason for high TDS values as well as the lithological constitutes of the water-bearing forma- tion. The temperature of the collected groundwater sam- ples in the study area varies between 29˚C and 49.1˚C with a mean value of 35.59˚C. The temperature increases from west to east, opposite to the direction of groundwa- ter flow. Where as, Mubazarah is characterized by the highest water temperature because of thermal origin of groundwater in that area. Copyright © 2012 SciRes. IJG  A. MURAD ET AL. 414 0 5 10 15 20 25 30 35 367000 368000 36900 0 37000 0 37100 0 372000 373000 37400 0 37500 0 2661000 2662000 2663000 2664000 2665000 2666000 2667000 2668000 2669000 2670000 2671000 2672000 2673000 367000 368000 36900 0 37000 0 37100 0 372000 373000 37400 0 37500 0 2661000 2662000 2663000 2664000 2665000 2666000 2667000 2668000 2669000 2670000 2671000 2672000 2673000 12 34 5 6 7 8 9 10 11 12 13 14 15 16 17 18 19 20 21 22 23 24 25 26 27 28 29 30 31 32 33 34 35 36 37 38 39 40 41 42 43 45 46 47 48 49 50 51 52 53 54 55 56 WELL ROADS GREEN AREAS OUTCROP N Figure 4. Iso-Electrical Conduc tivity (µS/cm) contour map of groundwater samples colle cted from the study area. 4.2. Chemical Properties The major cations in water are potassium (K+), sodium (Na+), magnesium (Mg+2), calcium (Ca2+) and the major anions are chloride (Cl–), sulphate (4 SO ) and bicarbon- ate (3). It is noticed that the cation charge balance is too high and exceeded the 5%. This abnormal of charge balance mainly attributed to high groundwater salinity as it is indicated by Murad (2004) in eastern part of the UAE. Each of these constituents and their relationship to each other are discussed below and presented in the Ap- pendix. 2 2 HCO 4.2.1. Major Cations The majority of the groundwater samples of the study area has the cationic order of: Na+ > Ca2+ > Mg2+ > K+. Sodium ion concentrations in groundwater of the study area ranged from 386.5 mg/l at northwest of Mubazarah in Neima area (Well No. 31) to 4953.5 mg/l at Ain Bu Sukhanah (Well No. 38). It is clear that the concentration of sodium is low at Neima and the northern part of the study area and it is high in While Mubazarah and Ain Bu Sukhanah. The positive relationship between sodium and chloride (r2 = 0.81) (Figure 6) is a strong evidence for extensively using of brackish groundwater for irriga- tion. The most common form of calcium in sedimentary rocks is carbonates, particularly as limestone or dolomite, which are dominant in the study area. The calcium ion concentration in groundwater of the study area ranged from 110.7 mg/l at Neima (Well No. 47) to 1813 mg/l at Ain Bu Sukhanah (Well No. 34 west of Jabal Hafit). The calcium concentrations of groundwater samples showed Copyright © 2012 SciRes. IJG  A. MURAD ET AL. 415 367000 368000 369000 370000 371000 372000 373000 374000 375000 2661000 2662000 2663000 2664000 2665000 2666000 2667000 2668000 2669000 2670000 2671000 2672000 2673000 10 20 30 40 50 60 70 80 90 10 11 12 13 14 15 16 17 00 00 00 00 00 00 00 00 00 000 000 000 000 000 000 000 000 367000 368000 369000 370000 371000 372000 373000 374000 375000 2661000 2662000 2663000 2664000 2665000 2666000 2667000 2668000 2669000 2670000 2671000 2672000 2673000 12 34 5 6 7 8 9 10 11 12 13 14 15 16 17 18 19 20 21 22 23 24 25 26 27 28 29 30 31 32 33 34 35 36 37 38 39 40 41 42 43 45 46 47 48 49 50 51 52 53 54 55 56 WE ROA LL DS GREEN AREAS OUTCROP N Figure 5. Iso-salinity (mg/l) contour map of groundw ater in the study area. R 2 = 0.8111 0 2000 4000 6000 8000 10000 010002000 3000 4000 Na + (mg/l) Cl - (mg/l) 12000 5000 6000 cl – (mg/l) Figure 6. The relationship between sodium and chloride concentrations for the groundwater in the study ar ea. a gradual increase from east to west in the direction of groundwater flow. High calcium ion concentrations en- countered in Ain Bu Sukhanah. The calcium abundance might result from the limestone dissolution of Jabal Hafit [15]. The magnesium ion (Mg2+) concentrations in fresh water are generally less than that of calcium because of low geochemical abundance of magnesium [16]. The concentration of Mg2+ in collected groundwater samples in the study area ranged from 120 to 5173 mg/l. The maximum Mg2+ concentrations exist in the western side of Jabal Hafit (Ain Bu Sukhanah). The presence of dolomite in Jabal Hafit could be elevated the magnesium concentration at Ain Bu Sukhanah as the dolomite is the main source of magnesium in groundwater [17]. The natural sources of potassium in water are the ig- Copyright © 2012 SciRes. IJG  A. MURAD ET AL. 416 neous rocks as feldspars (orthoclase and microcline), some mica and sedimentary rocks as silicate and clay mi- nerals [17]. The potassium content ranges between 25.7 mg/l at Neima (Well No. 10) and 1656.8 mg/l at Ain Bu Sukhanah (Well No. 38). In general, potassium ion con- centrations are low at Neima and Mubazarah areas, while high K+ concentrations are recognized in the west of Ja- bal Hafit at Ain Bu Sukhanah. This high potassium con- centration can be attributed to the presence of clay layer, overlained the gypsum aquifer of Ain Bu Sukhanah. 4.2.2. M ajor Anions The sequence of the major anions in the majority of groundwater of the study area has the order of: Cl– > > 3. The chloride ion concentrations in the study area range between 430 mg/l at Neima (Well No. 9) and 10,000 mg/l in Ain Bu Sukhanah (Well No. 38). Low values of chloride concentration are encountered at the farms west to Neima, while high values are observed at Mubazarah and Ain Bu Sukhanah. One possible explana- tion for the high concentration of chloride in Mubazarah and Neima is the entrapped saline water within the lime- stone sequence of Jabal Hafit, or it can be the agricultural activities from the positive relationship between Cl– and Br– (Figure 7). 2 4 SO 2 HCO 2 Sulphate ions (4 SO ) are derived from gypsum (CaSO4·2H2O) or anhydrite (CaSO4) in sedimentary rocks [15]. These two minerals are present in the study area as thick beds or streaks in the limestone strata and are suffi- ciently soluble to cause water in contact with them to be high in sulphate [18]. The value of sulphate concentra- tions in the study area ranged between 495 mg/l at Muba- zarah (Well No. 1) and 6280 mg/l in the south Ain Bu Sukhanah (Well No. 35). Sulphate ion concentrations are low at Mubazarah; while Neima and Ain Bu Sukhanah are characterized by high concentrations which might be related to the presence of gypsum and anhydrite within R 2 = 0. 8236 0 2000 4000 6000 8000 10000 12000 0 102030405060 Br - (m g/l) Cl - (m g /l) Cl – (mg/l) Br – (mg/l) Figure 7. The relationship between chloride and bromine for the groundwater in the study ar ea. the limestone sequence of Jabal Hafit. Most bicarbonate ions (3) in groundwater are derived from carbon dioxide in the atmosphere and soils, and by dissolution of carbonate rocks [17]. Bicarbonate concentrations in groundwater of the study area ranged from 65.07 mg/l south Mubazarah (Well No. 45) to 520.5 mg/l south Neima (Well No. 47). The concentration of bicarbonate shows a steady increase in the north-west direction, where Neima is characterized by high bicar- bonate concentrations. Dissolution of Jabal Hafit carbon- ate considered the main source for releasing bicarbonate to the groundwater in the study area. 2 HCO 4.2.3. Hydrochemical Water Types The water type is represented by each anion and cation that exceeds 15 equivalent percentages, arranged from the lowest to the highest cationic and anionic concentra- tions [19]. Four anionic groups with their 14 equivalent cationic combinations are distinguished and give rise to the different water types (Appendix). The anionic and cationic compositions of groundwater indicate that the chloride and sodium ions often acquire the highest con- centrations. While that, the sulphate with magnesium and calcium ions compositions reveal the second order in their concentrations. The intermediate concentration of bicarbonate and sulphate may be characterized the mix- ing of such water by the recent fresh water through the existing structural lineaments within the study area. This hypothesis is mainly supported by piper diagram (Figure 8) as most of the samples lie on the portions of domi- nancy of sulpahte and chloride which suggests seawater of relatively low freshening. The predominance of sulphate anion concentration within Cl-sulphate group reflects the depth and distance from the catchment area as well as the leaching processes of the evaporitic rock constituents that enrich with cal cium, Figure 8. Piper diagram for groundwater samples from the study area. Copyright © 2012 SciRes. IJG  A. MURAD ET AL. IJG 417 4.2.4. Hydrochemical Parameters magnesium and sulphate ions. A water type zonation map is constructed to show the spatial variation of diffe- rent water types within the study area (Figure 9). About fifty percent of the analyzed groundwater samples indicate that the ratio of Na+/C1− in meq/l is generally Figure 9. Water type zonation map for the study area. C opyright © 2012 SciRes.  A. MURAD ET AL. 418 less than unity indicating the marine water origin, while that the others reveal values more than unity to reflect meteoric water genesis. The hydrochemical parameters in meq/l of K+/C1–, Na+/C1–, Ca2+/Cl–, Mg2+/Cl– and 4/CI− are compared with the values of the standard seawater compositions [20] which are 0.0181, 0.8537, 0.0385, 0.1986, and 0.103 respectively. The calculated hydrochemical parameters relative to the seawater stan- dard indicted a relative increase in the concentration of calcium, magnesium and sulphate ions. 2 SO This is highly reflecting the influence of the existing water bearing formations such as carbonate and evaporite sediments. In addition, a relatively high temperature of the existing groundwater assists the solubility of such ions through the water-rock interaction. The adsorbed so- dium ions to the shaly sediments are effectively sub- jected to leaching by invading the meteoric water [21]. 4.2.5. Water Genesi s and Hypothetic al Sal t Combinations The interpretation of chemical analyses of collected groundwater samples showed that the Na2SO4 is origi- nated from deep percolation and NaHCO3 is from surface and shallow meteoric water conditions whereas (K + Na) − (Cl/SO4) < 1 and (K + Na) − (Cl/SO4) > 1). In addition, the interpretation reflects the meteoric water genesis, where the ionic concentrations of the potassium and so- dium ions are greater than chloride ions in solution. Wells No. 7 - 15, 28 - 32, 35, 37, 38, 40, 46, 47, 50, 51 - 54 represent the distribution of such water genesis within the area of investigation. In spite of the meteoric origin of the water samples, salts of temporary hardness in the solution are not domi- nant and represented only by Ca (HCO3)2 except sample no. 47. On the other hand, salts of permanent hardness are of obvious existence within most of the samples and represented by MgSO4 and CaSO4. The appearance of such salts may be affected by the leaching processes of lithological constituents that rich in calcium, magnesium and sulphate ions as well as lacking the recharging sources. The leaching processes of deep percolating wa- ter that occurs among these lithological constitutes which contain groundwater of relatively warm or hot (about 40˚C) makes enrichment of calcium, magnesium and sulphate ions especially under over pumping perform- ance and the absence of proper water management. The NaHCO3 water genesis with the hypothetical salt of KCl, NaCl, MgCl2, CaCl2, CaSO4 and Ca (HCO3)2 is repre- sented by well no. 55. The occurrence of MgCl2 and CaCl2 water types within the salt combinations might reflect the upward leakage of deep marine water origin in which the water reserves its meteoric genesis. On the contrary, the other groundwater samples indicate the ap- pearance of MgCl2 and CaCl2 water types which could reflect the marine water origin. However, the Cl/(Na + K) > 1 shows that the marine genesis of MgCl2 type. The existing salt combinations of MgCl2 water genesis reflects the appearance of Ca (HCO3)2 as salt of tempo- rary hardness that is may be due to the nearby of the MgCl2 zone to the Na2SO4 water origin zone (Figure 10) that is greatly affected by the water quality or by the shallow depth of the present groundwater. On the other hand, the Ca (HCO3)2 as temporary salt is of limited oc- currence within the salt combinations of CaCl2 water origin. A complete disappearance of Mg(HCO3)2 as a temporary hardness salt could be attributed to the small equivalent percentage of CaSO4 that exists [22]. Both CaCl2 and MgCl2 water geneses show that the dominant salts of permanent hardness are MgSO4 and CaSO4 that might reflect the influence of leaching processes on the evaporite deposits that rich in calcium and magnesium sulfates within the lithologic constituents of the water bearing formations. 4.2.6. Lateral Hydrogeochemical Variation In order to study the geographical changes in the chemi- cal compositions of groundwater within the studied area, three different hydrochemical cross-sections were con- structed. Along these sections, the existing structures re- presented by faulting and folding reveal their impact in the form of different water genesis within the aquifer. The cross section (A-A’) that extends NW-SE (Figure 11) showed that the chemical change in water genesis reveals the occurrence of contiguous different water ge- nesis starting at southeast by CaCl2 type existing in water wells 49 & 33. The neighbored aquifer toward the north- west indicates groundwater of terrestrial Na2SO4 genesis (Wells No. 47 & 13).The existence of those distinct wa- ter types, where each one preserves its definite charac- teristics may declare the discontinuity between them through probable existing faults. The aquifer with CaCl2 marine water genesis (Wells No. 49 & 2) along the profile (B-B’), which is extending SW-NE (Figure 12), is bounded from northeast by MgCl2 of marine water genesis (Wells No. 20 & 27). The existence of both exchangeable MgCl2 and CaCl2 marine water genesis give evidence about the effect of both geologic structures particularly the faulting and the high variable lithofacies of water-bearing formations in the prevailing of such exchangeable water origin through the same aquifer. The third hydrochemical cross-section (C-C’) that ex- tended SE-NW (Figure 13) passes through water Wells No. 27, 54 & 13 trending in SE-NW direction. These wells lie within aquifer zone indicating MgCl2 and Na2SO4 water genesis. This variation in groundwater origin may Copyright © 2012 SciRes. IJG  A. MURAD ET AL. 419 MgCl 2 zone 368000 369000 370000 371000 372000 373000 374000 2662000 2663000 2664000 2665000 2666000 2667000 2668000 2669000 2670000 2671000 2672000 CaCl2 zone MgCl 2 zone MgCl2 zone Na2SO4 zone Na2SO4 zone N a2SO4 zone MgCl2 zone MgCl2 zoneCaCl2 zone CaCl2 zone CaCl2 zone MgCl2 zone Na2SO4 zone N Figure 10. Water genesis zonation map for the study area. greatly reflect the depth that apart from the main re- charge source and the nature of the excessive pumping from the groundwater wells that lies close to Jabal Hafit zone. However, Na2SO4 water genesis indicates shallow depths and the groundwater connection with the atmos- phere while that the MgCl2 reveals the impact of over pumping within the wells neighboring to Jabel Hafit zone as well as the leaching process of the leachable forma- tions such as clay and evaporite rocks that form the ma- jor constitutes of the aquifer. 4.2.7. Groundwater Utilities The suitability of groundwater in the study area for do- mestic and agricultural purposes is evaluated. Usually, water applied for domestic purposes has certain standard specification as regards to its physical, chemical and Copyright © 2012 SciRes. IJG  A. MURAD ET AL. 420 Figure 11. Hydrochemical cross section (A-A’). The inset map showing the location of the cross section. Figure 12. Hydrochemical cross section (B-B’). Inset map showing the location of the cross section. Copyright © 2012 SciRes. IJG  A. MURAD ET AL. 421 Figure 13. Hydrochemical cross section (C-C’). Inset map showing the location of the cross section. biological properties. These standards are intended pri- marily to protect human health. However, the groundwa- ter in the study area is not suitable for drinking purposes due to the high TDS values. The suitability of ground- water in the study area for agriculture practices is as- sessed using Sodium Adsorption Ratio (SAR) values [23]. The SAR ranged between 1.3 in north-east Mubazarah (Well No. 25) and 28.18 at Mubazarah (Well No. 18) (Figure 14). Groundwater in Neima is characterized by limited harmful effect on plants in the north to a moder- ate harmful effect for plants in the south. In Ain Bu Suk- hanah, groundwater can cause moderate to high harmful effects for plants. Finally, Mubazarah is characterized by groundwater with high to very high damaging risk if it used for irrigation. 5. Conclusions The total dissolved content of the groundwater shows a general increasing trend from east to west of the northern Jabal Hafit in Al-Ain area in the eastern part of Abu Dhabi Emirate, UAE. An area of high TDS content is encountered in Ain Bu Sukhanah west from Jabal Hafit. This increase of TDS is attributed to the brine moving upward near Ain Bu Sukhanah and the existence of sab- khas in areas of low elevation west of Jabal Hafit. The sequence of major cations and anions dominance in ground- water in the study area have the order of: Na+ > Ca2+ > Mg2+ > K+ and Cl– > 4 SO > 3 respectively. According to the measured EC and calculated SAR va- lues, groundwater in Neima is characterized by limited harmful effect on plants in the north to a moderate harm- ful effect for plants in the south. The groundwater of Ain Bu Sukhanah can cause moderate to high harmful effects for plants. Mubazarah is characterized by groundwater with high to very high damaging risk if it used for irriga- tion. 22 HCO Brackish groundwater was used for agriculture activi- ties in the region as it is clear from a positive relationship between chloride and sodium concentrations. In addition, high concentrations of chloride in groundwater in Muba- zarah and Neima areas might be related to the entrapped saline water within the limestone sequence of Jabal Hafit, or it can be the agricultural activities from the positive relationship between Cl and Br. High sulphate concentra- Copyright © 2012 SciRes. IJG 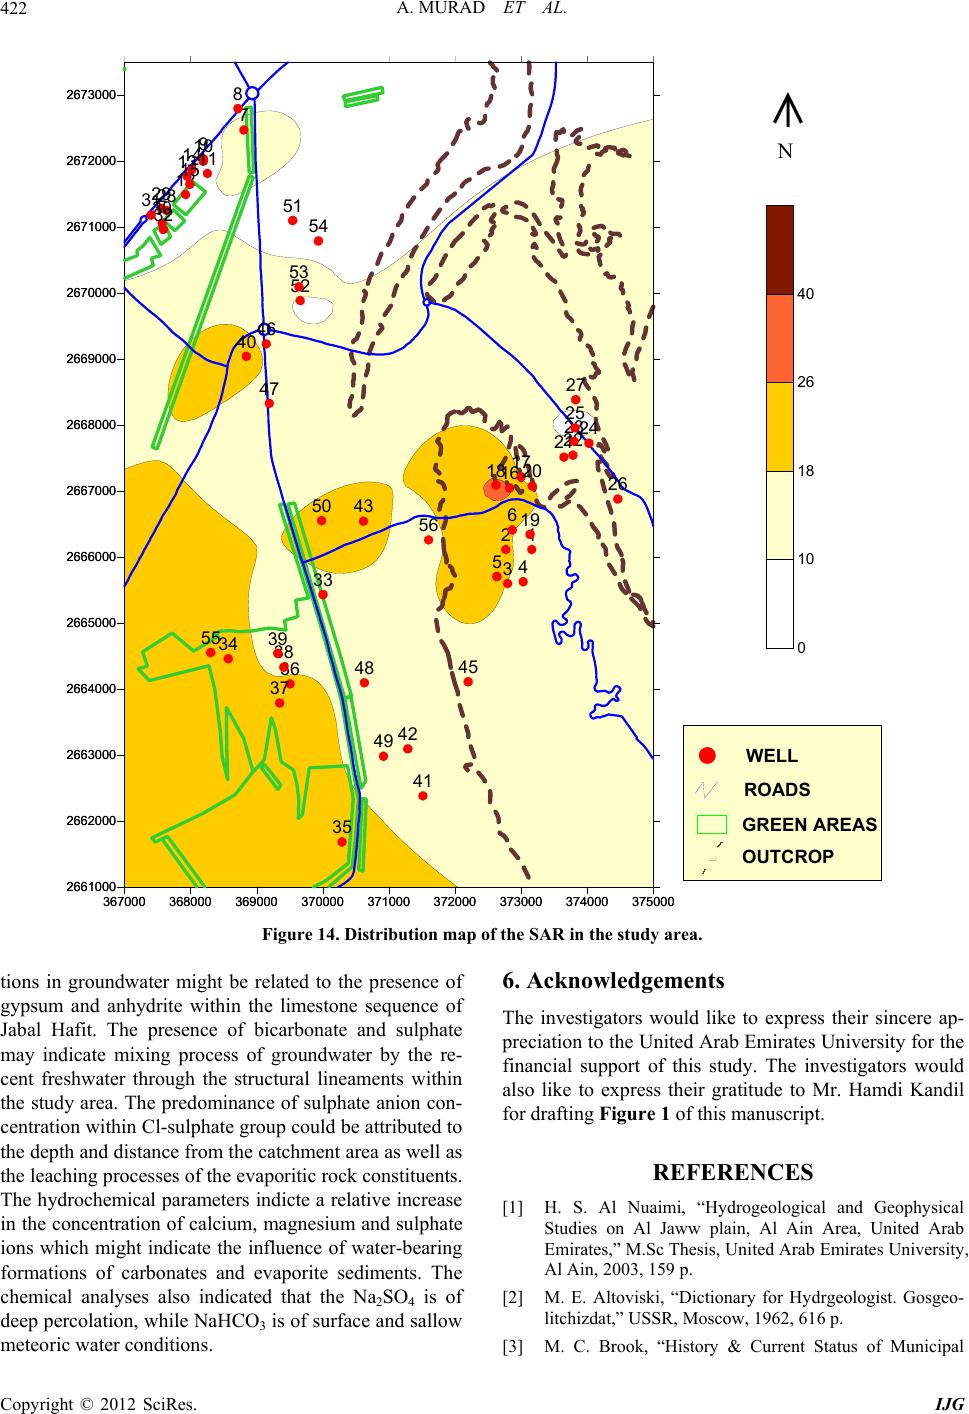 A. MURAD ET AL. 422 0 10 18 26 40 367000 368000369000 37000037100 0 37200 0 37300 0 37400 0 37500 0 2661000 2662000 2663000 2664000 2665000 2666000 2667000 2668000 2669000 2670000 2671000 2672000 2673000 367000 368000369000 37000037100 0 37200 0 37300 0 37400 0 37500 0 2661000 2662000 2663000 2664000 2665000 2666000 2667000 2668000 2669000 2670000 2671000 2672000 2673000 12 34 5 6 7 8 9 10 11 12 13 14 15 16 17 18 19 20 21 22 23 24 25 26 27 28 29 30 31 32 33 34 35 36 37 38 39 40 41 42 43 45 46 47 48 49 50 51 52 53 54 55 56 WELL ROADS GREEN AREAS OUTCROP N Figure 14. Distribution map of the SAR in the study area. tions in groundwater might be related to the presence of gypsum and anhydrite within the limestone sequence of Jabal Hafit. The presence of bicarbonate and sulphate may indicate mixing process of groundwater by the re- cent freshwater through the structural lineaments within the study area. The predominance of sulphate anion con- centration within Cl-sulphate group could be attributed to the depth and distance from the catchment area as well as the leaching processes of the evaporitic rock constituents. The hydrochemical parameters indicte a relative increase in the concentration of calcium, magnesium and sulphate ions which might indicate the influence of water-bearing formations of carbonates and evaporite sediments. The chemical analyses also indicated that the Na2SO4 is of deep percolation, while NaHCO3 is of surface and sallow meteoric water conditions. 6. Acknowledgements The investigators would like to express their sincere ap- preciation to the United Arab Emirates University for the financial support of this study. The investigators would also like to express their gratitude to Mr. Hamdi Kandil for drafting Fi gu re 1 of this manuscript. REFERENCES [1] H. S. Al Nuaimi, “Hydrogeological and Geophysical Studies on Al Jaww plain, Al Ain Area, United Arab Emirates,” M.Sc Thesis, United Arab Emirates University, Al Ain, 2003, 159 p. [2] M. E. Altoviski, “Dictionary for Hydrgeologist. Gosgeo- litchizdat,” USSR, Moscow, 1962, 616 p. [3] M. C. Brook, “History & Current Status of Municipal Copyright © 2012 SciRes. IJG  A. MURAD ET AL. 423 Wellfields in the Eastern Region of Abu Dhabi Emirate, 1979-2002,” Environment Agency of Abu Dhabi (EAD), Abu Dhabi, Vol. 1 and 11, 2003. [4] S. N. Davis and R. J. De Weist, “Hydrogeology,” John Wiley and Sons, New York, 1966, 108 p. [5] F. El-Shami, “The Hydrogeochemistry of the Spring of Ain Bu Sukhanah,” U.A.E. Arab Gulf Journal of Scien- tific Research, Vol. 8, No. 1, 1990, pp. 34-36. [6] Environment Agency, “Abu Dhabi Water Resources Sta- tistics,” Abu Dhabi (EAD), 2003. [7] H. K. Garamoon, “Hydrogeological and Geomorphologi- cal Studies on the Abu Dhabi-Dubai-Al Ain Triangle, UAE,” Unpublished Ph.D. Thesis, Geology Department, Faculty of Sciences, Ain Shames University, Cairo, 1996, 127 p. [8] K. W. Glennie, M. G. A. Bouef, M. W. H. Clarke, M. M. Stuart, W. F. H. Pillar and B. M. Reinhardt, “Geology of the Oman Mountains,” Transactions of the Royal Dutch Geological and Mining Society, Koninklijk Nederlands Geological Genootshap, 1974, pp. 31-423. [9] A. A. Hamdan and H. S. Anan, ”Cretaceous/Tertiary boundary in the United Arab Emirates,” M.E.R.C, Ain Shams University, Earth Science Series, Vol. 7, 1993, pp. 223-231. [10] A. A. Hamdan and S. A. Bahr, “Lithostratigraphy of the Paleogene Succession of Northern Jabal Hafit., Al-Ain Area, UAE,” M.E.R.C., Earth Science Series, Ain Shams University, Vol. 6, 1992, pp. 201-224. [11] A. A. Hamdan and W. Z. El-Deeb, “Stratigraphy of the Paleogene Succession of Jabal Malaqet, West of the Northern Oman Mountains,” Fac. Sci., UAE University, Vol. 2, 1990, pp. 30-39. [12] J. D. Hem, “Study and Interpretation of the Chemical Characteristics of Natural Water,” 3rd Edition, Wa- ter-Supply Paper 2254, US Geological Survey, 1989. [13] Hunting Geology and Geophysics Ltd., Report on Min- eral Survey of the U.A.E., Al-Ain Area, Vol. 9, 1979, p 29. [14] HydroConsult, “Reconnaissance Report and Development Proposals, Abu Dhabi, (UAE) Eastern Region Water Re- sources,” Ministry of Petroleum and Mineral Resources Report, Government of Abu Dhabi, 1987, 126 p. [15] G. N. Kamaneski, P. P. Klimintov and A. M. Ovitchinkov, “Hydrogeology of Ore Deposits,” Gosgeolitchizdat, Mos- cow, USSR, 1953, 355 p. [16] M. A. Khalifa, “Hydrogeology of the Geothermal Frac- tured Rock Well Field at Jabal Hafit, Abu Dhabi Emir- ate,” Proceedings of the 3rd Gulf Water Confer, Muscat, 1997, pp. 125-140. [17] M. A. Khalifa, “Geohydrology and the Source of Flowing Well Water in Al-Neima Area, Al, Abu Dhabi Emirate, UAE,” National Drilling Company and United States Geological Survey, 2003, 9 p. [18] G. Mathess, “The Properties of Groundwater,” John Wiley and Sons, New York, 1982, pp. 215-255. [19] Ministry of Agriculture and Fisheries, “Climatological Data,” Vol. 3, 1979-1980 to 1991-1992, Department of Soil and Water, MAF, 1993, 442 p. [20] A. M. Ovitchinkov, “General Hydrogeology,” Gosgeo- litchizdat Moscow, USSR, 1955, 383 p. [21] A. M. Ovitchinkov, “Mineral Water: Gosgeolitchizdat,” Moscow, USSR, 1963, 375 p. [22] US Geological Survey (USGS) and United Arab Emirates National Drilling Company (NDC), “Ground Water Re- sources of Al Ain Area, Abu Dhabi Emirate,” Unpub- lished Administrative Report 93-01, National Drilling Company, Abu Dhabi, 1993, 315 p. [23] US Salinity Laboratory Staff, “Diagenesis and Improve- ment of Saline and Alkali Soils: US Dept. Adri.,” Agri- cultural Handbook No. 60, 1954, pp. 60-160. Copyright © 2012 SciRes. IJG 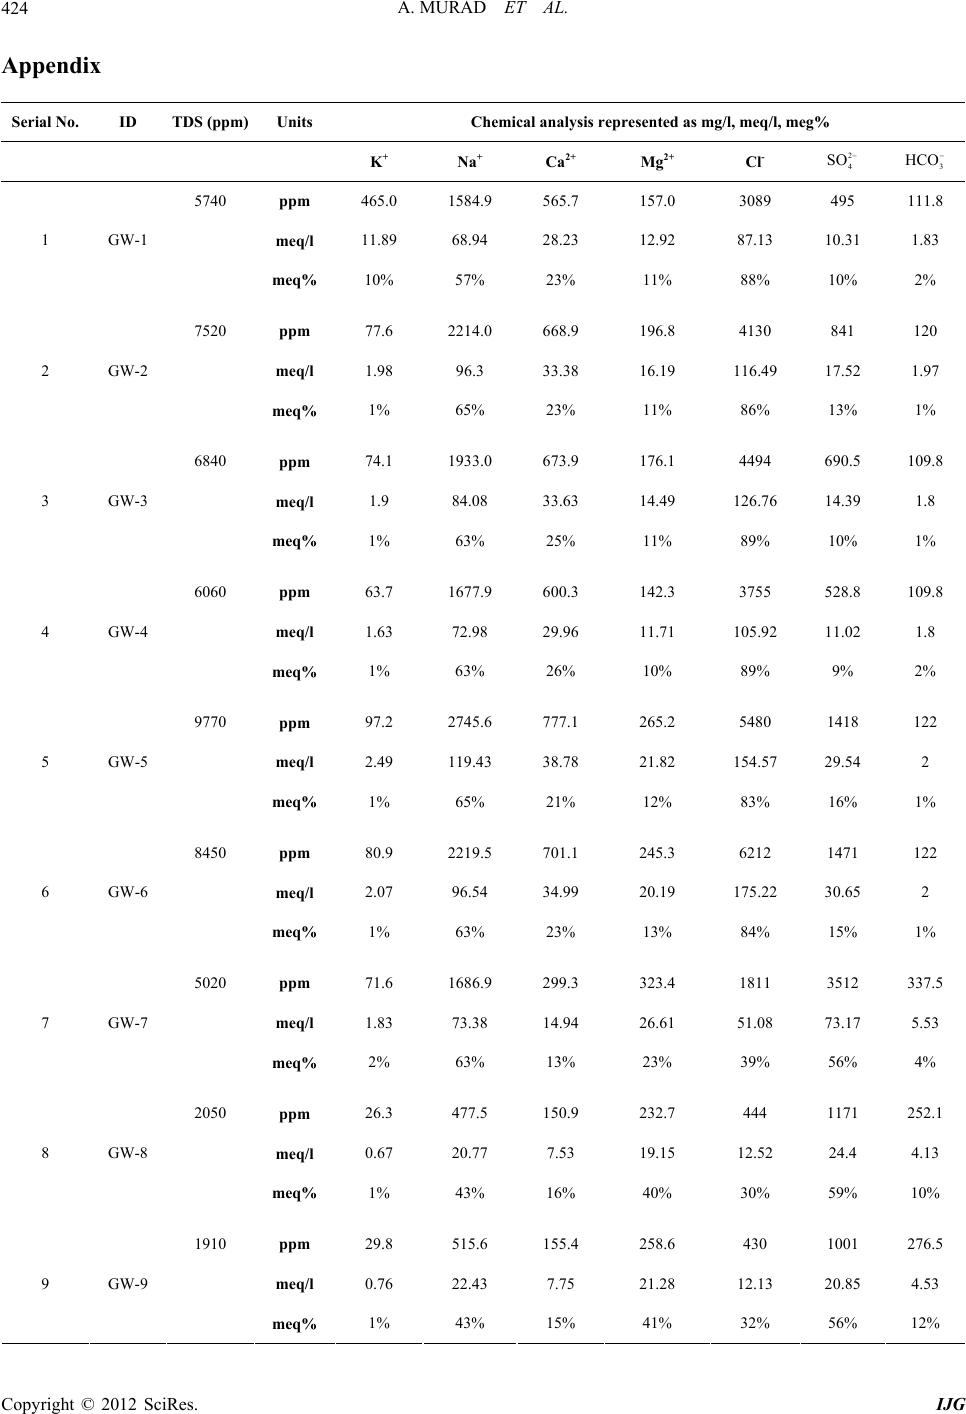 A. MURAD ET AL. 424 Appendix Serial No. ID TDS (ppm)Units Chemical analysis represented as mg/l, meq/l, meg% K+ Na+ Ca2+ Mg2+ Cl- 2 4 SO 3 HCO 5740 ppm 465.0 1584.9 565.7 157.0 3089 495 111.8 meq/l 11.89 68.94 28.23 12.92 87.13 10.31 1.83 1 GW-1 meq% 10% 57% 23% 11% 88% 10% 2% 7520 ppm 77.6 2214.0 668.9 196.8 4130 841 120 meq/l 1.98 96.3 33.38 16.19 116.49 17.52 1.97 2 GW-2 meq% 1% 65% 23% 11% 86% 13% 1% 6840 ppm 74.1 1933.0 673.9 176.1 4494 690.5 109.8 meq/l 1.9 84.08 33.63 14.49 126.76 14.39 1.8 3 GW-3 meq% 1% 63% 25% 11% 89% 10% 1% 6060 ppm 63.7 1677.9 600.3 142.3 3755 528.8 109.8 meq/l 1.63 72.98 29.96 11.71 105.92 11.02 1.8 4 GW-4 meq% 1% 63% 26% 10% 89% 9% 2% 9770 ppm 97.2 2745.6 777.1 265.2 5480 1418 122 meq/l 2.49 119.43 38.78 21.82 154.57 29.54 2 5 GW-5 meq% 1% 65% 21% 12% 83% 16% 1% 8450 ppm 80.9 2219.5 701.1 245.3 6212 1471 122 meq/l 2.07 96.54 34.99 20.19 175.22 30.65 2 6 GW-6 meq% 1% 63% 23% 13% 84% 15% 1% 5020 ppm 71.6 1686.9 299.3 323.4 1811 3512 337.5 meq/l 1.83 73.38 14.94 26.61 51.08 73.17 5.53 7 GW-7 meq% 2% 63% 13% 23% 39% 56% 4% 2050 ppm 26.3 477.5 150.9 232.7 444 1171 252.1 meq/l 0.67 20.77 7.53 19.15 12.52 24.4 4.13 8 GW-8 meq% 1% 43% 16% 40% 30% 59% 10% 1910 ppm 29.8 515.6 155.4 258.6 430 1001 276.5 meq/l 0.76 22.43 7.75 21.28 12.13 20.85 4.53 9 GW-9 meq% 1% 43% 15% 41% 32% 56% 12% Copyright © 2012 SciRes. IJG 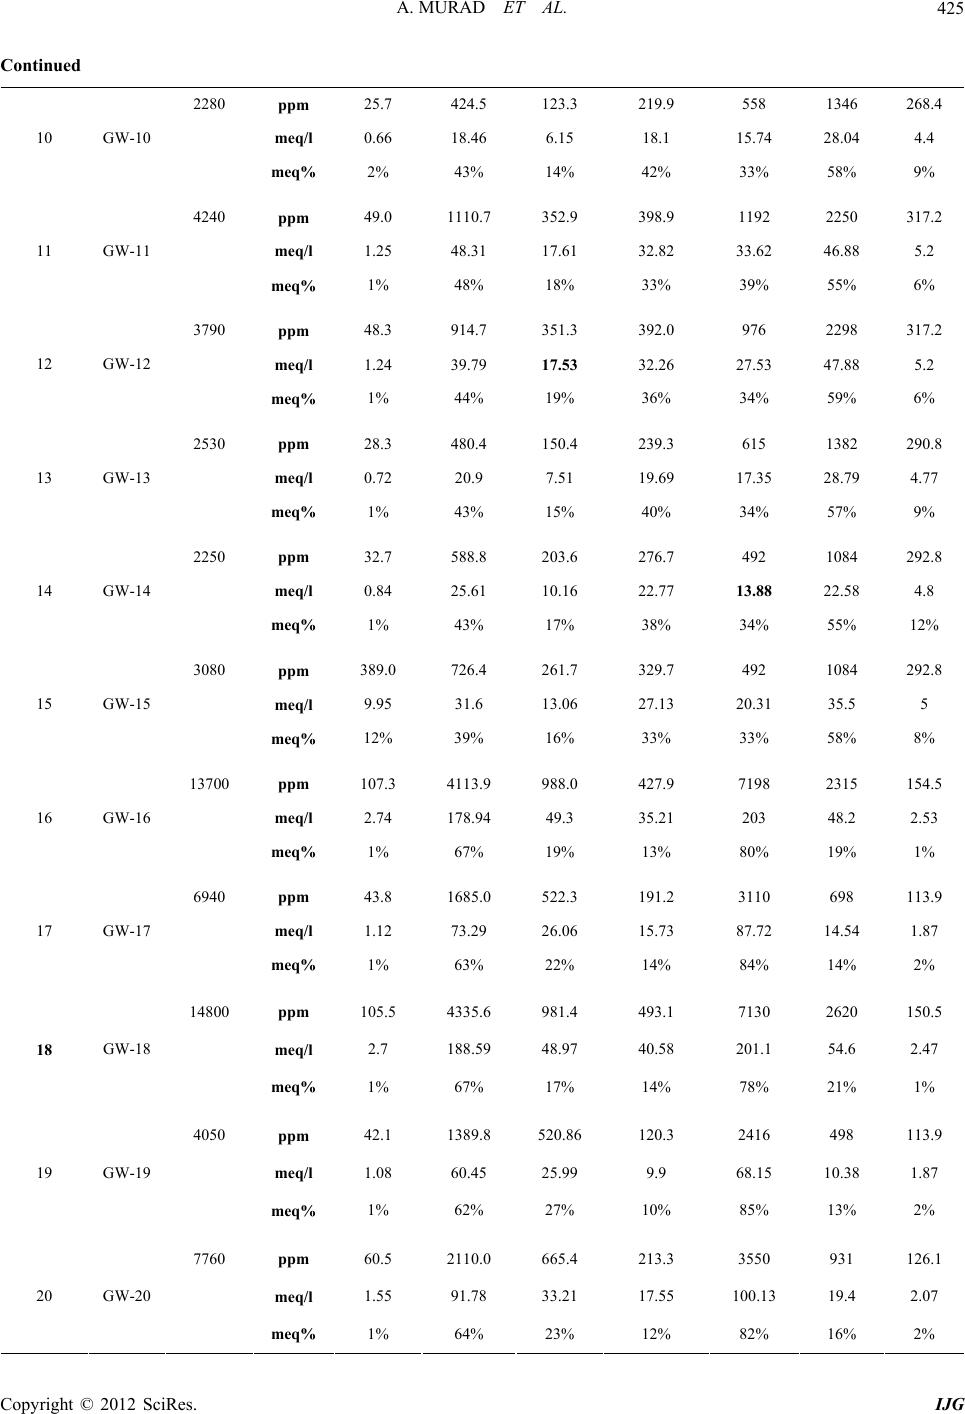 A. MURAD ET AL. 425 Continued 2280 ppm 25.7 424.5 123.3 219.9 558 1346 268.4 meq/l 0.66 18.46 6.15 18.1 15.74 28.04 4.4 10 GW-10 meq% 2% 43% 14% 42% 33% 58% 9% 4240 ppm 49.0 1110.7 352.9 398.9 1192 2250 317.2 meq/l 1.25 48.31 17.61 32.82 33.62 46.88 5.2 11 GW-11 meq% 1% 48% 18% 33% 39% 55% 6% 3790 ppm 48.3 914.7 351.3 392.0 976 2298 317.2 meq/l 1.24 39.79 17.53 32.26 27.53 47.88 5.2 12 GW-12 meq% 1% 44% 19% 36% 34% 59% 6% 2530 ppm 28.3 480.4 150.4 239.3 615 1382 290.8 meq/l 0.72 20.9 7.51 19.69 17.35 28.79 4.77 13 GW-13 meq% 1% 43% 15% 40% 34% 57% 9% 2250 ppm 32.7 588.8 203.6 276.7 492 1084 292.8 meq/l 0.84 25.61 10.16 22.77 13.88 22.58 4.8 14 GW-14 meq% 1% 43% 17% 38% 34% 55% 12% 3080 ppm 389.0 726.4 261.7 329.7 492 1084 292.8 meq/l 9.95 31.6 13.06 27.13 20.31 35.5 5 15 GW-15 meq% 12% 39% 16% 33% 33% 58% 8% 13700 ppm 107.3 4113.9 988.0 427.9 7198 2315 154.5 meq/l 2.74 178.94 49.3 35.21 203 48.2 2.53 16 GW-16 meq% 1% 67% 19% 13% 80% 19% 1% 6940 ppm 43.8 1685.0 522.3 191.2 3110 698 113.9 meq/l 1.12 73.29 26.06 15.73 87.72 14.54 1.87 17 GW-17 meq% 1% 63% 22% 14% 84% 14% 2% 14800 ppm 105.5 4335.6 981.4 493.1 7130 2620 150.5 meq/l 2.7 188.59 48.97 40.58 201.1 54.6 2.47 18 GW-18 meq% 1% 67% 17% 14% 78% 21% 1% 4050 ppm 42.1 1389.8 520.86 120.3 2416 498 113.9 meq/l 1.08 60.45 25.99 9.9 68.15 10.38 1.87 19 GW-19 meq% 1% 62% 27% 10% 85% 13% 2% 7760 ppm 60.5 2110.0 665.4 213.3 3550 931 126.1 meq/l 1.55 91.78 33.21 17.55 100.13 19.4 2.07 20 GW-20 meq% 1% 64% 23% 12% 82% 16% 2% Copyright © 2012 SciRes. IJG  A. MURAD ET AL. 426 Continued 5780 ppm 59.6 1424.1 507.9 156.6 2975 571.5 101.7 meq/l 1.52 61.94 25.35 12.89 83.91 11.91 1.67 21 GW-21 meq% 1% 61% 25% 13% 86% 12% 2% 5720 ppm 54.5 1432.0 497.8 150.5 2895 533.5 105.7 meq/l 1.39 62.29 24.84 12.38 81.66 11.11 1.73 22 GW-22 meq% 1% 62% 25% 12% 86% 12% 2% 5720 ppm 54.5 1432.0 497.8 150.5 2895 533.5 105.7 meq/l 1.56 63.69 27.19 12.64 75.45 11.33 1.87 23 GW-23 meq% 1% 61% 26% 12% 85% 13% 2% 5590 ppm 61.1 1464.2 544.9 153.6 2675 544 113.9 meq/l 1.55 61.61 28.67 12.25 84.58 11.83 1.87 24 GW-24 meq% 1% 59% 28% 12% 86% 12% 2% 5330 ppm 60.5 1416.4 574.6 148.9 2998.5 568 113.9 meq/l 1.65 5.99 29.16 11.82 79.82 11.6 1.87 25 GW-25 meq% 3% 12% 60% 24% 86% 12% 2% 5970 ppm 61.4 1607.1 618.2 158.7 2830 557 113.9 meq/l 1.57 69.91 30.85 13.06 84.55 13.2 1.87 26 GW-26 meq% 1% 61% 27% 11% 85% 13% 2% 6450 ppm 68.3 1706.0 627.5 187.2 3205 705 122 meq/l 1.75 74.21 31.31 15.4 90.4 14.7 2 27 GW-27 meq% 1% 60% 26% 13% 84% 14% 2% 4520 ppm 51.7 1009.5 439.1 587.0 1003 3371 378.2 meq/l 1.32 43.91 21.91 48.3 28.29 70.23 6.2 28 GW-28 meq% 1% 38% 19% 42% 27% 67% 6% 3850 ppm 48.0 839.6 324.3 434.1 1003 3371 378.2 meq/l 1.23 36.52 16.18 35.72 23.83 58.52 5.53 29 GW-29 meq% 1% 41% 18% 40% 27% 67% 6% 5090 ppm 61.5 1196.9 479.8 588.0 1305 4190 325.3 meq/l 1.57 52.06 23.94 48.39 36.81 87.29 5.33 30 GW-30 meq% 1% 41% 19% 38% 28% 67% 4% Copyright © 2012 SciRes. IJG  A. MURAD ET AL. 427 Continued 2160 ppm 32.8 386.5 250.8 250.6 500 1835 260.3 meq/l 0.84 16.81 12.52 20.62 14.1 38.23 4.27 31 GW-31 meq% 2% 33% 25% 41% 25% 68% 8% 4340 ppm 51.9 858.2 367.7 476.4 900 2810 317.2 meq/l 1.33 37.33 18.35 39.2 25.39 58.54 5.2 32 GW-32 meq% 1% 39% 19% 41% 28% 66% 6% 8470 ppm 63.2 2275.4 866.5 269.8 4999 1712 235.9 meq/l 1.62 98.97 43.24 22.2 141 35.6 3.87 33 GW-33 meq% 1% 60% 26% 13% 78% 20% 2% 17400 ppm 179.5 4927.3 1812.8 673.7 9420 1746 142.3 meq/l 4.59 214.33 90.46 55.44 265.71 36.38 2.33 34 GW-34 meq% 1% 59% 25% 15% 87% 12% 1% 7490 ppm 124.9 3824.8 1764.4 443.8 3140 6280 122 meq/l 3.19 166.37 88.05 36.52 88.57 131 2 35 GW-35 meq% 1% 57% 30% 12% 40% 59% 1% 15200 ppm 131.3 4116.0 1650.9 543.5 9995 1415 211.5 meq/l 3.36 179.04 82.38 44.72 281.9 282 3.47 36 GW-36 meq% 1% 58% 27% 14% 50% 50% 1% 12300 ppm 115.1 3698.2 1318.3 434.9 4970 1960 93.53 meq/l 2.94 160.86 65.79 35.79 140.19 40.83 1.53 37 GW-37 meq% 1% 61% 25% 13% 77% 22% 1% 17200 ppm 1656.8 4953.5 1676.3 5172.8 10000 1930 207.4 meq/l 42.38 215.47 83.65 425.66 282.07 40.21 3.4 38 GW-38 meq% 6% 28% 11% 55% 87% 12% 1% 13700 ppm 131.6 4218.0 1502.0 4829.1 7798 1687 178.9 meq/l 3.37 183.47 74.95 397.38 219.96 35.15 2.93 39 GW-39 meq% 1% 28% 11% 60% 85% 14% 1% 7110 ppm 79.0 2633.8 300.9 364.4 2385 3990 353.8 meq/l 2.02 114.56 15.02 29.99 67.27 83.13 5.8 40 GW-40 meq% 1% 71% 9% 19% 43% 53% 4% Copyright © 2012 SciRes. IJG  A. MURAD ET AL. 428 Continued 7470 ppm 99.1 2114.2 968.9 247.2 4485 825 89.47 meq/l 2.53 91.96 48.35 20.34 126.51 17.19 1.47 41 GW-41 meq% 2% 56% 30% 12% 87% 12% 1% 7460 ppm 97.2 2129.3 970.8 251.1 4010 911 105.7 meq/l 2.49 92.62 48.45 20.66 113.11 18.98 1.73 42 GW-42 meq% 2% 56% 30% 13% 85% 14% 1% 8810 ppm 122.3 2822.7 942.0 325.3 4610 2130 183 meq/l 3.13 122.78 47.01 26.77 130.03 44.38 3 43 GW-43 meq% 2% 61% 24% 13% 73% 25% 2% 7490 ppm 97.8 2192.9 900.7 266.7 3500 1750 187.1 meq/l 2.5 95.39 44.95 21.95 98.72 36.5 3.07 44 GW-44 meq% 2% 58% 27% 13% 71% 26% 2% 8090 ppm 96.9 2322.3 877.2 284.7 4580 1420 65.07 meq/l 2.48 101.01 43.77 23.43 129.2 29.6 1.07 45 GW-45 meq% 1% 59% 26% 14% 81% 19% 1% 3210 ppm 79.4 1123.5 131.8 187.4 1130 2430 471.7 meq/l 2.03 48.87 6.58 15.42 31.87 50.63 7.73 46 GW-46 meq% 3% 67% 9% 21% 35% 56% 9% 2760 ppm 67.6 879.8 110.7 190.9 860 940 520.5 meq/l 1.73 38.27 5.52 15.71 24.26 19.58 8.53 47 GW-47 meq% 3% 63% 9% 26% 46% 37% 16% 6770 ppm 89.6 1846.4 840.0 213.0 3715 770 105.7 meq/l 2.29 80.31 41.92 17.53 104.79 16.04 1.73 48 GW-48 meq% 2% 57% 30% 12% 86% 13% 1% 7070 ppm 87.5 1826.5 842.4 218.2 3725 825 105.7 meq/l 2.24 79.45 42.04 17.96 105.07 17.19 1.73 49 GW-49 meq% 2% 56% 30% 13% 85% 14% 1% 8000 ppm 107.9 2405.0 668.8 338.7 3150 1815 248.1 meq/l 2.76 104.61 33.37 27.87 88.85 37.81 4.07 50 GW-50 meq% 2% 62% 20% 17% 68% 29% 3% Copyright © 2012 SciRes. IJG  A. MURAD ET AL. Copyright © 2012 SciRes. IJG 429 Continued 3010 ppm 41.8 580.2 756.3 336.2 620 3085 203.3 meq/l 1.07 25.24 37.74 27.67 17.49 64.27 3.33 51 GW-51 meq% 1% 28% 41% 30% 21% 76% 4% 3360 ppm 53.8 885.8 486.6 219.7 1195 3040 248.1 meq/l 1.38 38.53 24.28 18.08 33.71 63.33 4.07 52 GW-52 meq% 2% 47% 30% 22% 33% 63% 4% 3410 ppm 69.8 1097.4 160.7 196.7 1166 1948 390.4 meq/l 1.79 47.73 8.02 16.19 32.89 40.6 6.4 53 GW-53 meq% 2% 65% 11% 22% 41% 51% 8% 2660 ppm 47.8 743.3 332.9 179.6 722 1836 252.1 meq/l 1.22 32.33 16.61 14.78 20.37 38.3 4.13 54 GW-54 meq% 2% 50% 26% 23% 32% 61% 7% 11500 ppm 152.9 3595.4 1244.1 415.8 4060 1465 89.47 meq/l 3.91 156.39 62.08 34.22 114.52 30.52 1.47 55 GW-55 meq% 2% 61% 24% 13% 78% 21% 1% 6920 ppm 90.7 2076.1 823.7 259.2 3800 1100 113.9 meq/l 2.32 90.31 41.1 21.33 107.19 22.92 1.87 56 GW-56 meq% 1% 58% 27% 14% 81% 17% 1% |