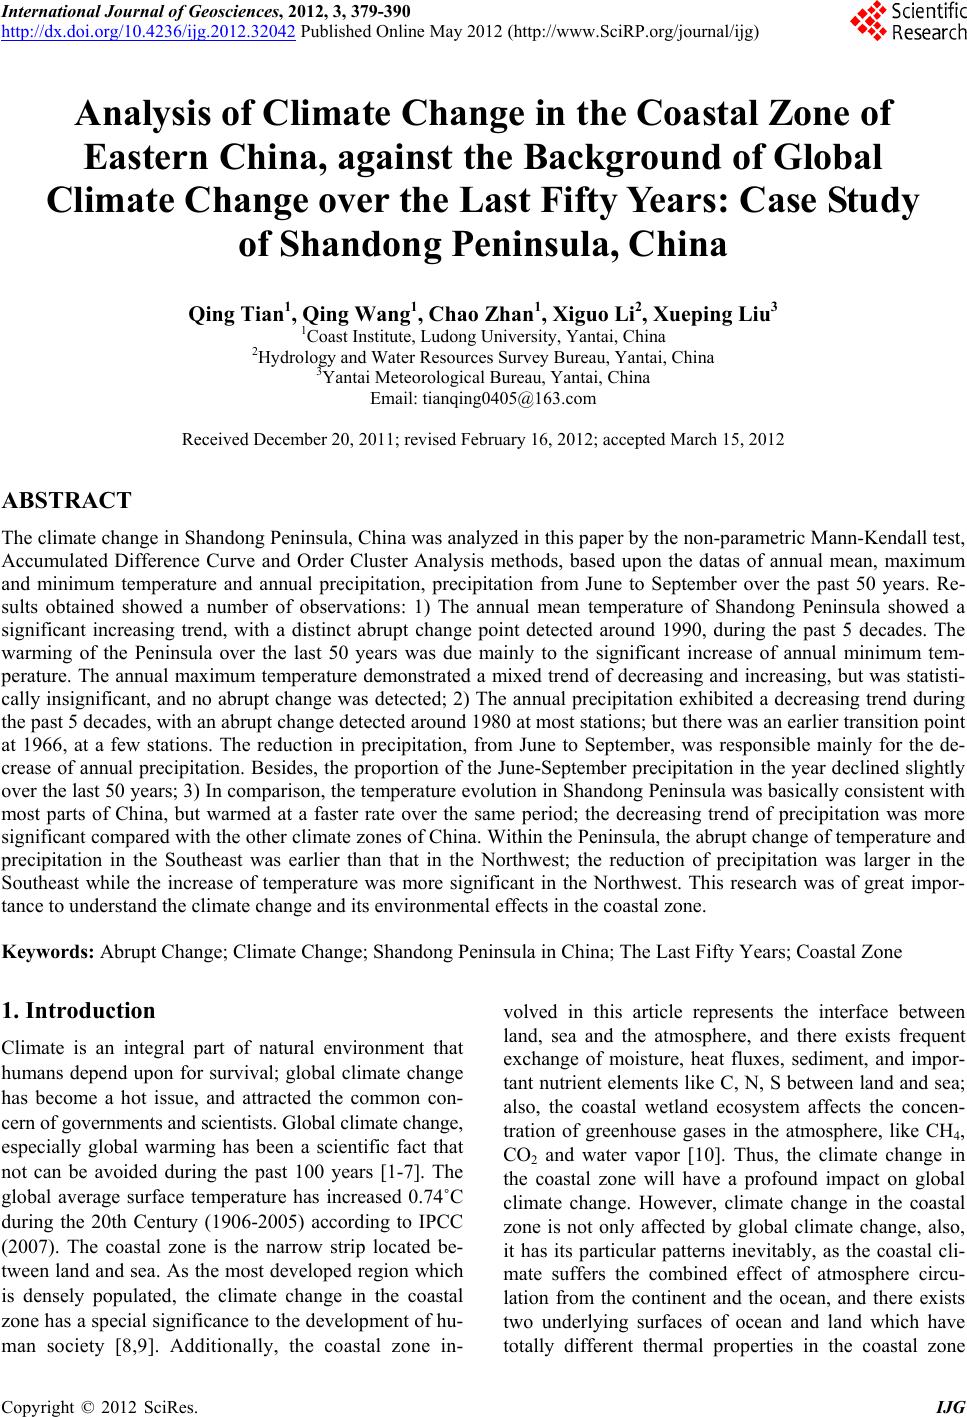
 International Journal of Geosciences, 2012, 3, 379-390 http://dx.doi.org/10.4236/ijg.2012.32042 Published Online May 2012 (http://www.SciRP.org/journal/ijg) Analysis of Climate Change in the Coastal Zone of Eastern China, against the Background of Global Climate Change over the Last Fifty Years: Case Study of Shandong Peninsula, China Qing Tian1, Qing Wang1, Chao Zhan1, Xiguo Li2, Xueping Liu3 1Coast Institute, Ludong University, Yantai, China 2Hydrology and Water Resources Survey Bureau, Yantai, China 3Yantai Meteorological Bureau, Yantai, China Email: tianqing0405@163.com Received December 20, 2011; revised February 16, 2012; accepted March 15, 2012 ABSTRACT The climate change in Shandong Peninsula, China was analyzed in this paper by the non-parametric Mann-Kendall test, Accumulated Difference Curve and Order Cluster Analysis methods, based upon the datas of annual mean, maximum and minimum temperature and annual precipitation, precipitation from June to September over the past 50 years. Re- sults obtained showed a number of observations: 1) The annual mean temperature of Shandong Peninsula showed a significant increasing trend, with a distinct abrupt change point detected around 1990, during the past 5 decades. The warming of the Peninsula over the last 50 years was due mainly to the significant increase of annual minimum tem- perature. The annual maximum temperature demonstrated a mixed trend of decreasing and increasing, but was statisti- cally insignificant, and no abrupt change was detected; 2) The annual precipitation exhibited a decreasing trend during the past 5 decades, with an abrupt change detected around 1980 at most stations; but there was an earlier transition point at 1966, at a few stations. The reduction in precipitation, from June to September, was responsible mainly for the de- crease of annual precipitation. Besides, the proportion of the June-September precipitation in the year declined slightly over the last 50 years; 3) In comparison, the temperature evolution in Shandong Peninsula was basically consistent with most parts of China, but warmed at a faster rate over the same period; the decreasing trend of precipitation was more significant compared with the other climate zones of China. Within the Peninsula, the abrupt change of temperature and precipitation in the Southeast was earlier than that in the Northwest; the reduction of precipitation was larger in the Southeast while the increase of temperature was more significant in the Northwest. This research was of great impor- tance to understand the climate change and its environmental effects in the coastal zone. Keywords: Abrupt Change; Climate Change; Shandong Peninsula in China; The Last Fifty Years; Coastal Zone 1. Introduction Climate is an integral part of natural environment that humans depend upon for survival; global climate change has become a hot issue, and attracted the common con- cern of governments and scientists. Global climate change, especially global warming has been a scientific fact that not can be avoided during the past 100 years [1-7]. The global average surface temperature has increased 0.74˚C during the 20th Century (1906-2005) according to IPCC (2007). The coastal zone is the narrow strip located be- tween land and sea. As the most developed region which is densely populated, the climate change in the coastal zone has a special significance to the development of hu- man society [8,9]. Additionally, the coastal zone in- volved in this article represents the interface between land, sea and the atmosphere, and there exists frequent exchange of moisture, heat fluxes, sediment, and impor- tant nutrient elements like C, N, S between land and sea; also, the coastal wetland ecosystem affects the concen- tration of greenhouse gases in the atmosphere, like CH4, CO2 and water vapor [10]. Thus, the climate change in the coastal zone will have a profound impact on global climate change. However, climate change in the coastal zone is not only affected by global climate change, also, it has its particular patterns inevitably, as the coastal cli- mate suffers the combined effect of atmosphere circu- lation from the continent and the ocean, and there exists two underlying surfaces of ocean and land which have totally different thermal properties in the coastal zone C opyright © 2012 SciRes. IJG 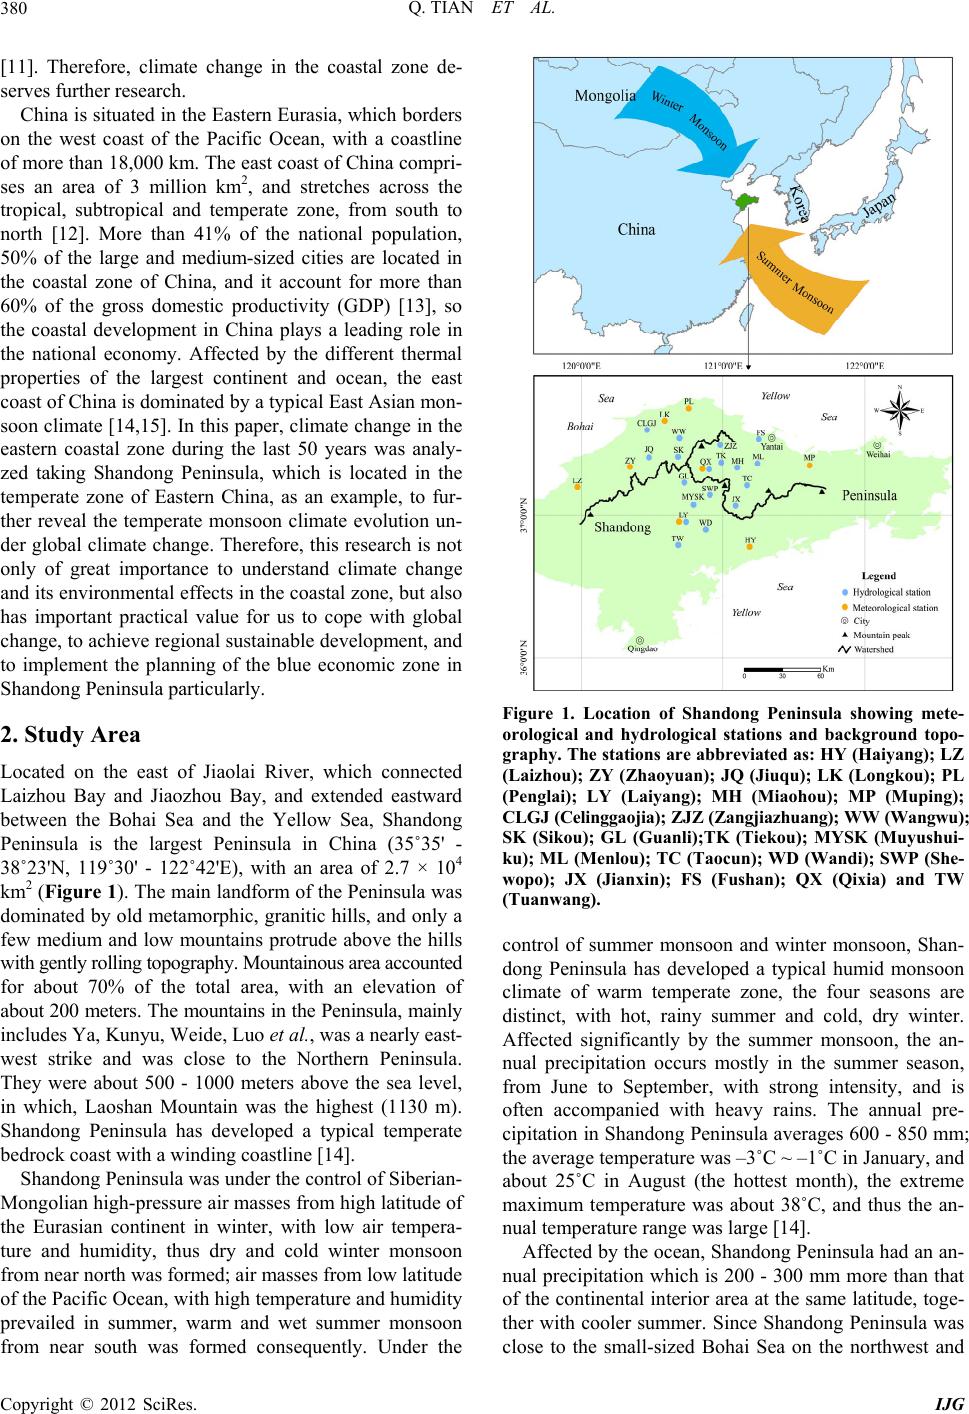 Q. TIAN ET AL. 380 [11]. Therefore, climate change in the coastal zone de- serves further research. China is situated in the Eastern Eurasia, which borders on the west coast of the Pacific Ocean, with a coastline of more than 18,000 km. The east coast of China compri- ses an area of 3 million km2, and stretches across the tropical, subtropical and temperate zone, from south to north [12]. More than 41% of the national population, 50% of the large and medium-sized cities are located in the coastal zone of China, and it account for more than 60% of the gross domestic productivity (GDP) [13], so the coastal development in China plays a leading role in the national economy. Affected by the different thermal properties of the largest continent and ocean, the east coast of China is dominated by a typical East Asian mon- soon climate [14,15]. In this paper, climate change in the eastern coastal zone during the last 50 years was analy- zed taking Shandong Peninsula, which is located in the temperate zone of Eastern China, as an example, to fur- ther reveal the temperate monsoon climate evolution un- der global climate change. Therefore, this research is not only of great importance to understand climate change and its environmental effects in the coastal zone, but also has important practical value for us to cope with global change, to achieve regional sustainable development, and to implement the planning of the blue economic zone in Shandong Peninsula particularly. 2. Study Area Located on the east of Jiaolai River, which connected Laizhou Bay and Jiaozhou Bay, and extended eastward between the Bohai Sea and the Yellow Sea, Shandong Peninsula is the largest Peninsula in China (35˚35' - 38˚23'N, 119˚30' - 122˚42'E), with an area of 2.7 × 10⁴ km2 (Figure 1). The main landform of the Peninsula was dominated by old metamorphic, granitic hills, and only a few medium and low mountains protrude above the hills with gently rolling topography. Mountainous area accounted for about 70% of the total area, with an elevation of about 200 meters. The mountains in the Peninsula, mainly includes Ya, Kunyu, Weide, Luo et al., was a nearly east- west strike and was close to the Northern Peninsula. They were about 500 - 1000 meters above the sea level, in which, Laoshan Mountain was the highest (1130 m). Shandong Peninsula has developed a typical temperate bedrock coast with a winding coastline [14]. Shandong Peninsula was under the control of Siberian- Mongolian high-pressure air masses from high latitude of the Eurasian continent in winter, with low air tempera- ture and humidity, thus dry and cold winter monsoon from near north was formed; air masses from low latitude of the Pacific Ocean, with high temperature and humidity prevailed in summer, warm and wet summer monsoon from near south was formed consequently. Under the Figure 1. Location of Shandong Peninsula showing mete- orological and hydrological stations and background topo- graphy. The stations are abbreviated as: HY (Haiyang); LZ (Laizhou); ZY (Zhaoyuan); JQ (Jiuqu); LK (Longkou); PL (Penglai); LY (Laiyang); MH (Miaohou); MP (Muping); CLGJ (Celinggaojia); ZJZ (Zangjia zhuang); WW (Wangw u); SK (Sikou); GL (Guanli);TK (Tiekou); MYSK (Muyushui- ku); ML (Menlou); TC (Taocun); WD (Wandi); SWP (She- wopo); JX (Jianxin); FS (Fushan); QX (Qixia) and TW (Tuanwang). control of summer monsoon and winter monsoon, Shan- dong Peninsula has developed a typical humid monsoon climate of warm temperate zone, the four seasons are distinct, with hot, rainy summer and cold, dry winter. Affected significantly by the summer monsoon, the an- nual precipitation occurs mostly in the summer season, from June to September, with strong intensity, and is often accompanied with heavy rains. The annual pre- cipitation in Shandong Peninsula averages 600 - 850 mm; the average temperature was –3˚C ~ –1˚C in January, and about 25˚C in August (the hottest month), the extreme maximum temperature was about 38˚C, and thus the an- nual temperature range was large [14]. Affected by the ocean, Shandong Peninsula had an an- nual precipitation which is 200 - 300 mm more than that of the continental interior area at the same latitude, toge- ther with cooler summer. Since Shandong Peninsula was close to the small-sized Bohai Sea on the northwest and Copyright © 2012 SciRes. IJG 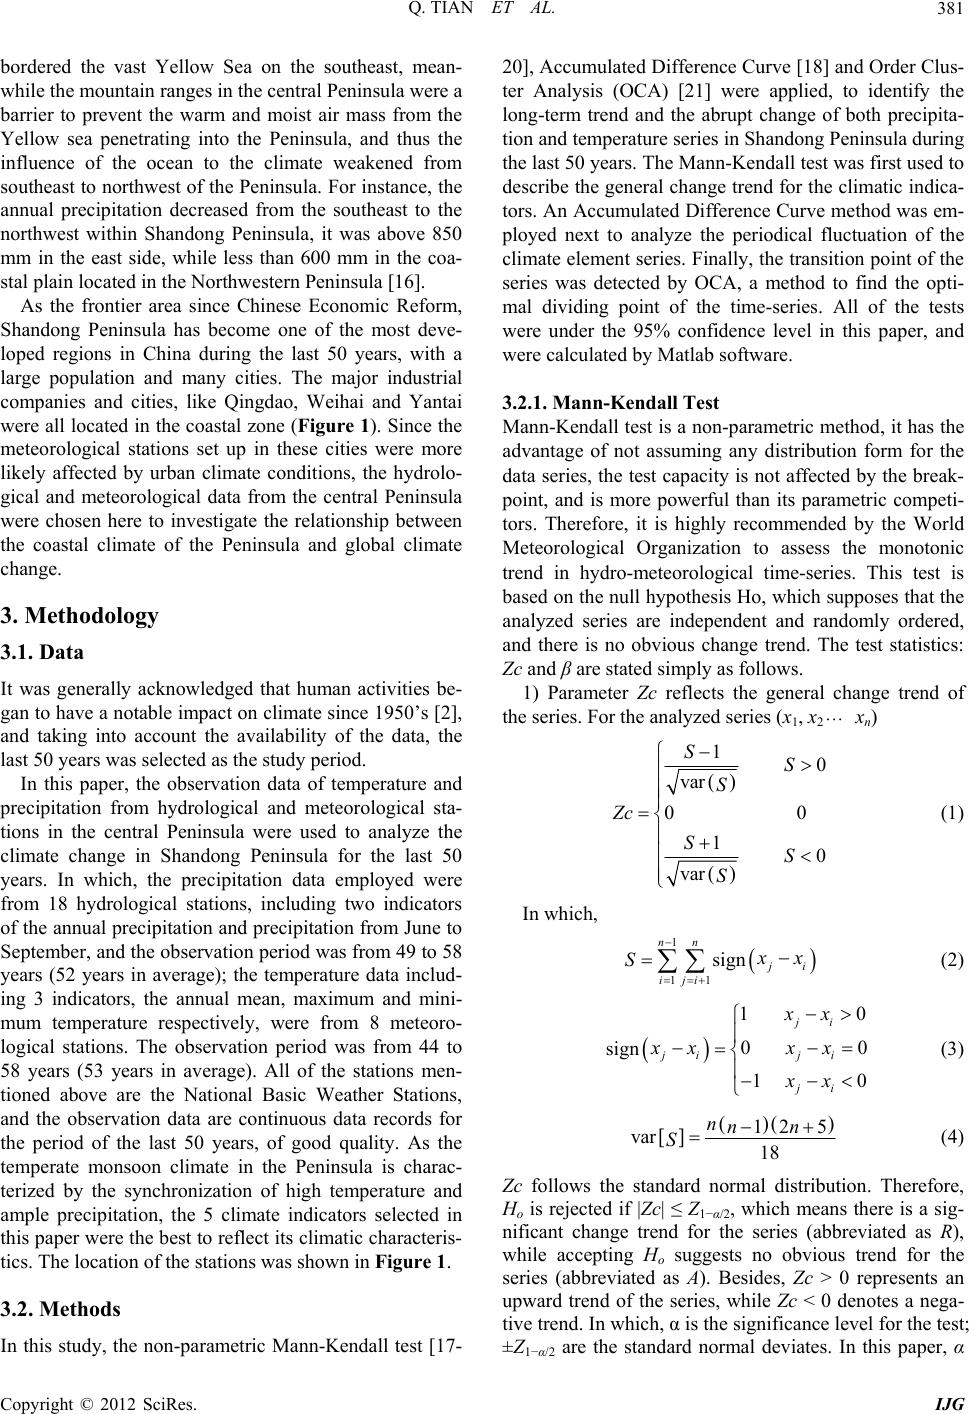 Q. TIAN ET AL. 381 bordered the vast Yellow Sea on the southeast, mean- while the mountain ranges in the central Peninsula were a barrier to prevent the warm and moist air mass from the Yellow sea penetrating into the Peninsula, and thus the influence of the ocean to the climate weakened from southeast to northwest of the Peninsula. For instance, the annual precipitation decreased from the southeast to the northwest within Shandong Peninsula, it was above 850 mm in the east side, while less than 600 mm in the coa- stal plain located in the Northwestern Peninsula [16]. As the frontier area since Chinese Economic Reform, Shandong Peninsula has become one of the most deve- loped regions in China during the last 50 years, with a large population and many cities. The major industrial companies and cities, like Qingdao, Weihai and Yantai were all located in the coastal zone (Figure 1). Since the meteorological stations set up in these cities were more likely affected by urban climate conditions, the hydrolo- gical and meteorological data from the central Peninsula were chosen here to investigate the relationship between the coastal climate of the Peninsula and global climate change. 3. Methodology 3.1. Data It was generally acknowledged that human activities be- gan to have a notable impact on climate since 1950’s [2], and taking into account the availability of the data, the last 50 years was selected as the study period. In this paper, the observation data of temperature and precipitation from hydrological and meteorological sta- tions in the central Peninsula were used to analyze the climate change in Shandong Peninsula for the last 50 years. In which, the precipitation data employed were from 18 hydrological stations, including two indicators of the annual precipitation and precipitation from June to September, and the observation period was from 49 to 58 years (52 years in average); the temperature data includ- ing 3 indicators, the annual mean, maximum and mini- mum temperature respectively, were from 8 meteoro- logical stations. The observation period was from 44 to 58 years (53 years in average). All of the stations men- tioned above are the National Basic Weather Stations, and the observation data are continuous data records for the period of the last 50 years, of good quality. As the temperate monsoon climate in the Peninsula is charac- terized by the synchronization of high temperature and ample precipitation, the 5 climate indicators selected in this paper were the best to reflect its climatic characteris- tics. The location of the stations was shown in Figure 1. 3.2. Methods In this study, the non-parametric Mann-Kendall test [17- 20], Accumulated Difference Curve [18] and Order Clus- ter Analysis (OCA) [21] were applied, to identify the long-term trend and the abrupt change of both precipita- tion and temperature series in Shandong Peninsula during the last 50 years. The Mann-Kendall test was first used to describe the general change trend for the climatic indica- tors. An Accumulated Difference Curve method was em- ployed next to analyze the periodical fluctuation of the climate element series. Finally, the transition point of the series was detected by OCA, a method to find the opti- mal dividing point of the time-series. All of the tests were under the 95% confidence level in this paper, and were calculated by Matlab software. 3.2.1. Mann- Kendall Test Mann-Kendall test is a non-parametric method, it has the advantage of not assuming any distribution form for the data series, the test capacity is not affected by the break- point, and is more powerful than its parametric competi- tors. Therefore, it is highly recommended by the World Meteorological Organization to assess the monotonic trend in hydro-meteorological time-series. This test is based on the null hypothesis Ho, which supposes that the analyzed series are independent and randomly ordered, and there is no obvious change trend. The test statistics: Zc and β are stated simply as follows. 1) Parameter Zc reflects the general change trend of the series. For the analyzed series (x1, x2 xn) 10 var 0 10 var SS S Zc SS S 0 (1) In which, 1 11 sign nn i iji x S (2) 10 0 sign 10 ji ji ji ji xx xx xx xx 0 (3) 12 5 var 18 nnn S (4) Zc follows the standard normal distribution. Therefore, Ho is rejected if |Zc| ≤ Z1−α/2, which means there is a sig- nificant change trend for the series (abbreviated as R), while accepting Ho suggests no obvious trend for the series (abbreviated as A). Besides, Zc > 0 represents an upward trend of the series, while Zc < 0 denotes a nega- tive trend. In which, α is the significance level for the test; ±Z1−α/2 are the standard normal deviates. In this paper, α Copyright © 2012 SciRes. IJG  Q. TIAN ET AL. 382 = 95% was applied, ±Z1−α/2 = ±1.96. 2) Parameter β is the Kendall gradient, and it is used to estimate of average change rate of the series. It is based on the assumption that the change trend of the series is monotonic, which means the trend is a linear function of time. Median 1 ij xx jin ij (5) 3.2.2. Accumulated Difference Curve ed difference of For the series (x1, x2…xn), the accumulat every point was given as: 1 1, 2,, t ti i Xtn XX (6) In which, 1 1n i i X n (7) Draw the accumulated difference curve according to the results, the horizontal axis of the curve represents time (year), and the vertical axis of the curve is i X . An upward gradient of the curve indicates a relatively high temperature period or a pluvial period; a relatively cold or dry period conversely. And thus the change process of the series can be divided into stages with dif- ferent change trend, and the variation of the trend may be attributed to the abrupt change of the climatic elements. 3.2.3. Order Clust er An al y sis (OCA) CA, a method to was de The transition point was detected by O find the optimal dividing point of the time-series. This method was similar to the cluster analysis, but the se- quence of the series should not be disrupted. For the se- ries (x1 xi xj xn) (1 < i < j < n), if the series with n points ividd into m groups, the optimal dividing point was obtained as follows: 22 3 11 2 1 ,1,,1 ,12,,1 ,1,,1, 1,, kk kmm ii i ii i iiii in , j kij kij ki Dij xxx (8) 1 1 j ij k ki x ji (9) (10) where k represents the group number, ik is the first sam- rend of Temperature in Shandong 4.1. Shandong Peninsula rature in Sh n point of re increase in Shandong Peninsula sh 1 1 ,1 , m kk k pDii mn ple of group k. The series was divided into 2 groups in this paper, and thus the point with the minimum φ{p(2, n)} value will be the optimal dividing point. 4. Results 4.1. Chan g e T Peninsula over the Past 50 Years 1. Annual Mea n Temperature The annual mean temperature of over the past 5 decades exhibited a significant increasing trend overall. The Mann-Kendall results showed that Ho was rejected (Table 1), which means the increasing trend of annual mean temperature series was significant at the 95% significance level. The annual mean temperature of Shandong Peninsula has increased 1˚C - 2˚C approxi- mately over the past 5 decades, with an average increas- ing rate of 0.26˚C - 0.46˚C (10a)−1 (Table 1). The long-term trend of annual mean tempe andong Peninsula was characterized by distinct perio- dical fluctuations over the past 50 years, instead of mo- notonic increasing trend. The accumulated difference curves showed that 1990 can be defined as the split point, to divide the annual mean temperature series into two periods: a downward trend in the early period and a con- tinuous increasing trend in the late period (Figure 2(a)). As a consequence, there may be an abrupt change of an- nual mean temperature around 1990: it shifted from a re- latively cool period to a warm period after 1990. According to the results of OCA, the transitio annual mean temperature at all stations existed in the period of 1988-1994, the annual mean temperature in- creased by 7.52% - 12.21% after the abrupt change (Ta- ble 2). Therefore, 1990 could be considered as the divid- ing point on the whole, and the annual mean temperature increased by about 10% after 1990, over the past 5 de- cades in Shandong Peninsula. Additionally, as can be seen from Figure 1 that the stations with more signifi- cant in creasing rate of annual mean temperature were mostly located in the northwest of the Peninsula during the past 50 years. The temperatu ould be an active local response to global warming, but the specific change process and the exact transition point were not quite the same. The increasing rate of annual mean temperature for the past 50 years in Shandong Pen- insula was much higher than that of the entire globe (an increasing rate of 0.13˚C (10a)–1 from 1906 to 2005) ac- cording to the IPCC (2007), China (an increasing rate of 0.3˚C (10a)–1 from 1961 to 2006) [22] and the monsoon region of Eastern China (an increasing rate of 0.26˚C (10a)–1 from 1951 to 2002) [23], also, it was more sig- nificant compared to the western inland area, at the same latitude (an increasing rate of 0.18˚C (10a)–1 from 1951 to 2002) [24]. Moreover, many research have found that the transition point of annual mean temperature was ob- served at 1993 in the Northern Hemisphere [25], 1989 in China [22], 1992 in the warm temperate zone where Copyright © 2012 SciRes. IJG 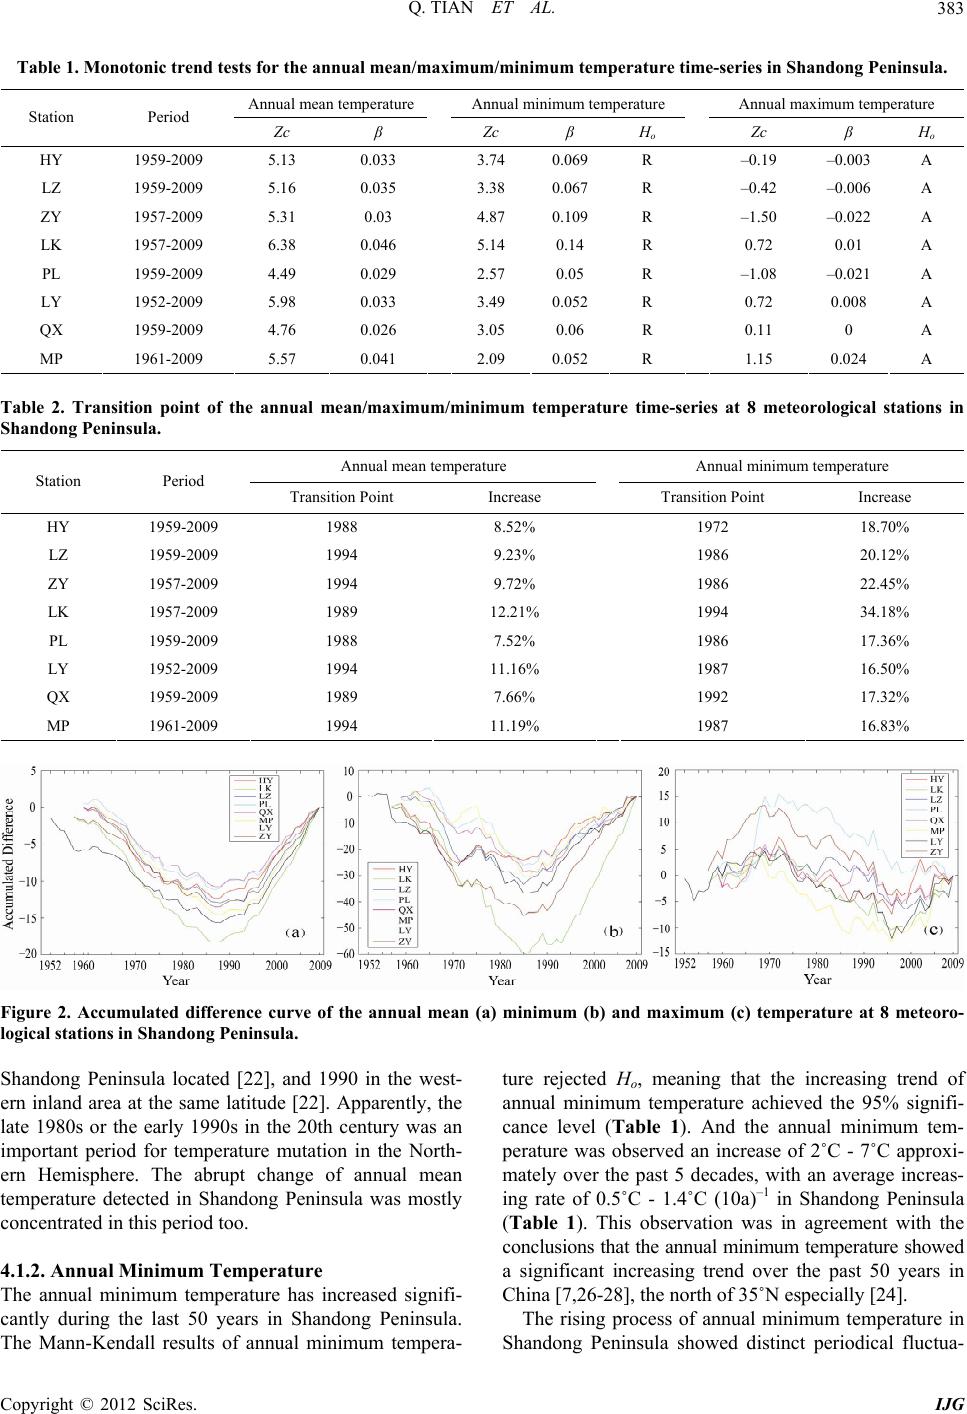 Q. TIAN ET AL. Copyright © 2012 SciRes. IJG 383 rature time-series in Shandong Peninsula. Table 1. Monotonic trend tests for the annual mean/maximum/minimum tempe Annual mean temperatureAnnual minimum temperature Annual maximum temperature Station Period Zc β Zc β H o Zc β H o HY 1959-2009 0. 0. – –0.3 5.13 0333.74069R 0.1900A LZ 1959-2009 5.16 0.035 3.38 0.067 R –0.42 –0.006 A ZY 1957-2009 5.31 0.03 4.87 0.109 R –1.50 –0.022 A LK 1957-2009 6.38 0.046 5.14 0.14 R 0.72 0.01 A PL 1959-2009 4.49 0.029 2.57 0.05 R –1.08 – 0. 0.021 A LY 1952-2009 5.98 0.033 3.49 0.052 R 0.72 0.008 A QX 1959-2009 4.76 0.026 3.05 0.06 R 0.11 0 A MP 1961-2009 5.57 0.041 2.09 0.052 R 1.15 024A able 2. Transition point of the annual mean/maximum/minimum temperature time-series at 8 meteorological stations in Annual mean temperature Annual minimum temperature T Shandong Peninsula. Station Period Transitease Transe ion Point Incrsition Point Increa HY 1959-2009 1988 8.52% 1972 18.70% LZ 1959-2009 1994 9.23% 1986 20.12% ZY 1957-2009 1994 9.72% 1986 22.45% LK 1957-2009 1989 12.21% 1994 34.18% PL 1959-2009 1988 7.52% 1986 17.36% LY 1952-2009 1994 11.16% 1987 16.50% QX 1959-2009 1989 7.66% 1992 17.32% MP 1961-2009 1994 11.19% 1987 16.83% Figure 2. Accumulated difference curve of the annual mean (a) minimum (b) and maximum (c) temperature at 8 meteoro- handong Peninsula located [22], and 1990 in the west- 4.1.2. Annual Minimum Temperature creased signifi- ture rejected H, meaning that the increasing trend of tua- logical stations in Shandong Peninsula. S ern inland area at the same latitude [22]. Apparently, the late 1980s or the early 1990s in the 20th century was an important period for temperature mutation in the North- ern Hemisphere. The abrupt change of annual mean temperature detected in Shandong Peninsula was mostly concentrated in this period too. The annual minimum temperature has in cantly during the last 50 years in Shandong Peninsula. The Mann-Kendall results of annual minimum tempera- o annual minimum temperature achieved the 95% signifi- cance level (Table 1). And the annual minimum tem- perature was observed an increase of 2˚C - 7˚C approxi- mately over the past 5 decades, with an average increas- ing rate of 0.5˚C - 1.4˚C (10a)–1 in Shandong Peninsula (Table 1). This observation was in agreement with the conclusions that the annual minimum temperature showed a significant increasing trend over the past 50 years in China [7,26-28], the north of 35˚N especially [24]. The rising process of annual minimum temperature in Shandong Peninsula showed distinct periodical fluc  Q. TIAN ET AL. 384 tio re at most stations was in the pe The annual maximum temperature demonstrated a mixed he past 50 years l minimum temperature was m Peninsula over the Past 50 Years Theninsula exhi- ing the last 50 years. The bvious periodical fluctuations, ot r the abrupt change with the reduction m ns over the past 5 decades, but not a monotonic in- creasing trend. The accumulated difference curves at most stations showed a decreasing trend before 1990, a continuous increasing trend afterwards, but there was an obvious fluctuation around 1970 (Figure 2(b)). Since it can be inferred that the possible transition point of annual minimum temperature existed around 1990. However, accumulated difference curve for Haiyang station ap- peared to show a decreasing trend before 1970s, an in- creasing trend after 1990 and a horizontal period between them (Figure 2(b)). Evidently, the abrupt change of an- nual minimum temperature probably existed in 1970s- 1990s at Haiyang station. The OCA results showed that the transition point of annual minimum temperatu riod of 1986-1994, except Haiyang Station, which has an earlier transition point at 1972 (Table 2). Moreover, the annual minimum temperature showed an increase of 16.50% - 34.18% after the abrupt change (Table 2). Therefore, the annual minimum temperature in Shandong Peninsula increased by about 20% after 1990 over the past 5 decades, and thus the abrupt change was distinct. 4.1.3. Annu al Ma x i mu n Temperature trend of decreasing and increasing over t in Shandong Peninsula. Longkou, Muping, Laiyang and Qixia stations showed a slight upward trend of annual maximum temperature, while it displayed a gentle de- creasing trend at Haiyang, Laizhou, Penglai and Zhao- yuan station. The Mann-Kendall test indicated that the change trend was statistically insignificant (Table 1). Furthermore, the change pattern of annual maximum temperature was quite complex and no obvious abrupt change was observed, seen from the accumulated differ- rence curve (Figure 2(c)). According to the analysis described above, the in- crease amplitude in annua uch higher than that of the annual maximum tempera- ture in Shandong Peninsula over the last 50 years. Con- sequently, the climate warming of Shandong Peninsula over the last 50 years was largely due to the significant increase of annual minimum temperature, especially after the 1990s. A similar story exists all over China [29]. 4.2. Precipitation Changes in Shandong 4.2.1. Annual Precipitation annual precipitation of Shandong Pe bited a decreasing trend dur Mann-Kendall test results indicated that the annual pre- cipitation at 18 stations showed a decreasing trend, and the decreasing trend was significant at Muyushuiku, Lai- yang, Tiekou, Miaohou and Menlou stations (Table 3). The annual precipitation was observed a decrease of about 60 - 200 mm over the past 5 decades, the decreas- ing rate was 1.33 - 4.13 mm·a–1, with an average value of 2.73 mm·a–1 (Table 3). Thus, the annual precipitation reduction differs considerably in different regions of Shandong Peninsula. The decreasing rate of annual pre- cipitation over the past 50 years in Shandong Peninsula is slightly higher than that of the warm temperate zone in China (–2.13 mm·a–1), which was detected a more marked reduction in annual precipitation than the other climate zones of China [22,26]. Therefore, the decreasing trend of annual precipitation in Shandong Peninsula over the past 50 years was more notable compared with the other climate zones of China. The change process of annual precipitation in Shan- dong Peninsula showed o her than monotonic increasing trend over the past 5 decades. The accumulated difference curves at Muyu- shuiku, Laiyang and Shewopo stations showed an in- creasing trend before 1966, after a short-term fluctuation, then started to decrease around 1980 (Figure 3(a)). How- ever, the accumulated difference curves for the other 15 stations were divided into 2 periods at 1980, but there was an obvious fluctuation at about 1966, especially the Sikou, Tuanwang, Zangjiazhuang and Wandi station (Figure 3(b)). This suggested that the annual precipita- tion transitioned from a relatively wet season to a dry season after 1980s in the study area. Therefore, 1966 or 1980 was thought as the possible transition point of an- nual precipitation in Shandong Peninsula. Further analy- sis based to the results of OCA showed that, the transi- tion point of annual precipitation was 1966 at Muyu- shuiku, Laiyang and Shewopo station, which were lo- cated in the Southeastern Peninsula, while that at the other 15 stations was around 1980 (Table 4), this is the same time when the major precipitation belt moved in a Northern to Southern China trajectory throughout the last 50 years [30]. The annual precipitation in Shandong Peninsula has decreased afte agnitude ranges from 13.81% to 24.75% over the past 5 decades, and the mean value was 18.77% approximately (Table 4). The study area can be divided into two parts: the northwest (9 stations) and the southeast (9 stations), respectively, according to the line joining points of Yan- tai and Miaohou. Among the 8 stations with the reduced amplitude of annual precipitation below the mean value (18.77%), 7 were located in the northwest, while only 2 of the 10 stations with the reduced amplitude above the mean value (18.77%) were located in the northwest (Figure 1). Therefore, the reduction of annual precipita- tion in the northwest was much smaller than that in the southeast in the past 50 years. Different from the decreasing trend of annual precipi- Copyright © 2012 SciRes. IJG  Q. TIAN ET AL. Copyright © 2012 SciRes. IJG 385 or the annual/June-September precipitation time-series at 18 hydrological stations in Shan- do Table 1. Monotonic trend tests f ng Peninsula. Annual precipitation June-September precipitation Station Period Zc β H o Period Zc β H o JQ 1965-2009 .34 A 1965-2009 A –1.13 –2–1.54 –2.31 CLGJ 1 – 1 – –2 M SW –2. 960-2009–1.2 2.24A 960-20091.16.22A WW 1959-2009 –0.96 –1.33 A 1959-2009 –1.24 –1.84 A SK 1956-2009 –1.36 –2.13 A 1958-2009 –1.35 –2.41 A GL 1952-2009 –1.05 –1.49 A 1952-2009 –1.25 –2.07 A YSK 1956-2009 –2.16 –3.42 R 1959-2009 –1.97 –3.13 R LY 1956-2009 –2.2 –3.24 R 1956-2009 –1.84 –2.95 A TW 1952-2009 –1.8 –2.4 A 1957-2009 –1.07 –1.84 A WD 1952-2009 –1.83 –2.57 A 1952-2009 –1.47 –1.88 A P 1953-2009 –1.8 79 A 1953-2009 –1.69 –2.79 A JX 1956-2009 –1.69 –3.04 A 1960-2009 –1.99 –3.47 R TK 1952-2009 –2.07 –3.25 R 1952-2009 –2.12 –2.98 R MH 1960-2009 –2.08 –3.95 R 1960-2009 –2.12 –3.48 R ZJZ 1960-2009 –1.36 –2.21 A 1960-2009 –1.64 –2.58 A FS 1966-2009 –1.61 –3.68 A 1966-2009 –1.35 –2.8 A ML 1960-2009 –2.41 –4.13 R 1960-2009 –2.31 –4.44 R TC 1952-2009 –1.36 –1.81 A 1952-2009 –1.47 –2.37 A QX 1960-2009 –1.82 –3.09 A 1960-2009 –1.66 –2.95 A Tableransition points of the annual/June-Seer preitation at 18 hgical s in Shong eninsula. 2. Tptembciptime-seriesydrolostationand P Annual precipitation June-September precipitation Station Period Transition point Decrease Period Transition point Decrease JQ 191965-65-2009 1979 14.44% 2009 1979 19.08% CLGJ 1960-1960- GL 1952-2009 1980 13.81% 1952-2009 1980 15.77% M 2009 1986 17.27% 2009 1986 20.54% WW 1959-2009 1979 15.08% 1959-2009 1979 20.77% SK 1956-2009 1977 14.61% 1958-2009 1977 16.55% YSK 1956- LY 1956- 2009 2009 1966 1966 22.11% 24.75% 1959-2009 1956-2009 1966 1966 31.27% 29.51% TW 1952-2009 1977 20.09% 1957-2009 1966 29.32% WD 1952-2009 1977 20.01% 1952-2009 1966 23.94% SWP 1953-2009 1966 18.84% 1953-2009 1966 22.85% JX 1956-2009 1977 22.98% 1960-2009 1977 26.78% TK 1952-2009 1980 23.68% 1952-2009 1980 26.79% MH 1960-2009 1977 19.37% 1960-2009 1979 21.47% ZJZ 1960-2009 1980 15.93% 1960-2009 1979 20.11% FS 1966-2009 1977 20.26% 1966-2009 1979 23.05% ML 1960-2009 1980 22.13% 1960-2009 1979 27.84% TC 1952-2009 1977 14.29% 1952-2009 1979 16.74% QX 1960-2009 1980 18.16% 1960-2009 1980 21.63% 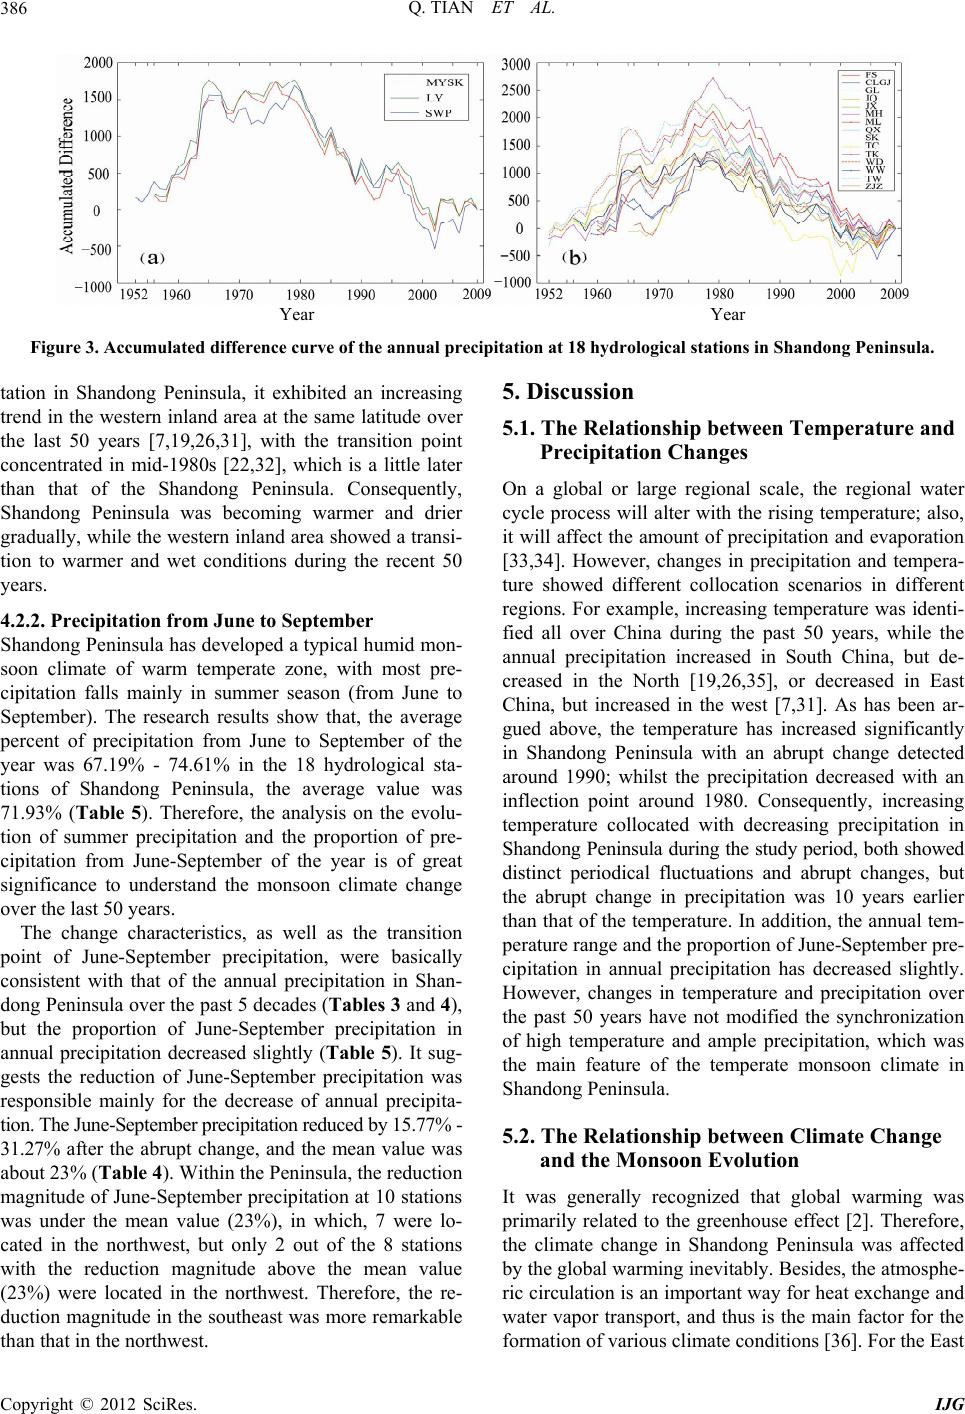 Q. TIAN ET AL. 386 Year Year Figure 3. Accumulated difference curve of the annual precipitation at 18 hydrological stations in Shandong Peninsula. tati en ng Peninsula has developed a typical humid mon- most pre- 5.1. The Relationship between Temperature and the rising temperature; also, mount of precipitation and evaporation tureon scenarios in different greenhouse effect [2]. Therefore, the climate change in Shandong Peninsula was affected - ric c exchange and on in Shandong Peninsula, it exhibited an increasing d in the western inland area at the same latitude over 5. Discussion tr the last 50 years [7,19,26,31], with the transition point concentrated in mid-1980s [22,32], which is a little later than that of the Shandong Peninsula. Consequently, Shandong Peninsula was becoming warmer and drier gradually, while the western inland area showed a transi- tion to warmer and wet conditions during the recent 50 years. 4.2.2. Precipitation from June to September Shando soon climate of warm temperate zone, with cipitation falls mainly in summer season (from June to September). The research results show that, the average percent of precipitation from June to September of the year was 67.19% - 74.61% in the 18 hydrological sta- tions of Shandong Peninsula, the average value was 71.93% (Table 5). Therefore, the analysis on the evolu- tion of summer precipitation and the proportion of pre- cipitation from June-September of the year is of great significance to understand the monsoon climate change over the last 50 years. The change characteristics, as well as the transition point of June-September precipitation, were basically consistent with that of the annual precipitation in Shan- dong Peninsula over the past 5 decades (Tables 3 and 4), but the proportion of June-September precipitation in annual precipitation decreased slightly (Table 5). It sug- gests the reduction of June-September precipitation was responsible mainly for the decrease of annual precipita- tion. The June-September precipitation reduced by 15.77% - 31.27% after the abrupt change, and the mean value was about 23% (Table 4). Within the Peninsula, the reduction magnitude of June-September precipitation at 10 stations was under the mean value (23%), in which, 7 were lo- cated in the northwest, but only 2 out of the 8 stations with the reduction magnitude above the mean value (23%) were located in the northwest. Therefore, the re- duction magnitude in the southeast was more remarkable than that in the northwest. Precipitation Changes On a global or large regional scale, the regional water alter withcycle process will it will affect the a [33,34]. However, changes in precipitation and tempera- showed different collocati regions. For example, increasing temperature was identi- fied all over China during the past 50 years, while the annual precipitation increased in South China, but de- creased in the North [19,26,35], or decreased in East China, but increased in the west [7,31]. As has been ar- gued above, the temperature has increased significantly in Shandong Peninsula with an abrupt change detected around 1990; whilst the precipitation decreased with an inflection point around 1980. Consequently, increasing temperature collocated with decreasing precipitation in Shandong Peninsula during the study period, both showed distinct periodical fluctuations and abrupt changes, but the abrupt change in precipitation was 10 years earlier than that of the temperature. In addition, the annual tem- perature range and the proportion of June-September pre- cipitation in annual precipitation has decreased slightly. However, changes in temperature and precipitation over the past 50 years have not modified the synchronization of high temperature and ample precipitation, which was the main feature of the temperate monsoon climate in Shandong Peninsula. 5.2. The Relationship between Climate Change and the Monsoon Evolution It was generally recognized that global warming was primarily related to the by the global warming inevitably. Besides, the atmosphe irculation is an important way for heat water vapor transport, and thus is the main factor for the formation of various climate conditions [36]. For the East Copyright © 2012 SciRes. IJG  Q. TIAN ET AL. 387 Table 5. Monotonic trend tests for the percentage of June-Sember precipitation in the year at 18 hydrological stations in Shandong Peninsula. Station Period Zc Percent pte Staton Period Zc Percent Ho i JQ 1965-2009 –0.85 69.84% SWP 1953-2009 –1.18 74.18% A CLGJ 1960-2009 –0.74 70.88% JX 1960-2009 –1.72 73.40% A 1 –1 – WW 959-20091.54 71.70% TK 952-20091.09 72.62% A SK 1958-2009 –0.81 72.23% MH 1960-2009 –0.6 70.18% A GL 1952-2009 –0.93 74.61% ZJZ 1960-2009 –0.97 70.82% A MYSK1959-2009 –0.75 73.40% FS 1966-2009 –0.35 67.19% A LY 1956-2009 –0.81 72.24% ML 1960-2009 –1.22 69.16% A TW 1957-2009 –0.31 71.95% TC 1952-2009 –1.02 74.02% A WD 1952-2009 –0.23 74.30% QX 1960-2009 –0.77 72.06% A Asia moon cl Shandninsul was closeelated tactioneen won- soon summn [14any shave und that the Siberia-Mongolia high was an important l precipitation in Eas- te e impact of natural an nsula lhe rgiate ange in ninquirer resea. 5.3. Spatial Difference of Climate Change in ribed the sout of temperature was more dy reasing trend and a distinct onsimate inong Pea, it ly ro the inter betwinter m ander monsoo]. Mtudies fo factor for temperature change in the East Asian monsoon area. The 1030 hPa isobar southward expansion of Sibe- rian high and the 500 hPa geopotential height of Siberia- Mongolian Plateau both experienced an abrupt change in mid-1980s [37,38], which was basically consistent with the transition point of temperature in Shandong Peninsula during the last 50 years. Since it can be inferred that the temperature change in Shandong Peninsula over the past 50 years may be highly impacted by the abrupt change of Siberia-Mongolia winter monsoon. Precipitation in the East Asian monsoon region was directly related to the summer monsoon [29,39-45]. The maritime air masses associated with the summer mon- soon brings about 75% of the annua rn China [46]. Many research has shown that the East Asian summer monsoon suddenly weakened in late 1970s during the last 50 years, which might be related to the changes of the snow cover conditions in the Tibetan Pla- teau and the sea surface temperature in east central tro- pical Pacific [41-43,47]. Correspondingly, the precipita- tion in Northeastern China reduced significantly in late 1970s, resulted by the sudden weaken of the summer monsoon [30,35,43,44,48]. The precipitation reduction in Shandong Peninsula was in the same period, therefore, we can speculate that the decrease of precipitation in Shandong Peninsula may be attributed to the changes in East Asian summer monsoon. There are great difficulties to analyze the driving me- chanism of climate change under the continental scale. The causal factors for climate change are diverse and complicated. It is hard to identify th d anthoropogenic factors due to the local circulation and topographic complexity on a small scale [49]. This article is only a preliminary study for the main reason of climate change in the large-scale area where Shandong Shandong Peninsula As the barrier effect of the nearly east-west watershed located in central Peninsula, the northwestern Peninsula was more influenced by winter monsoon, while the sum- mer monsoon was more significant in the southeast. Con- sequently, it presented distinct spatial variations of cli- Peni ocated, tonal reason for the clim chShandong Pesula res furtherch mate change within Shandong Peninsula. As desc above, the reduction of precipitation was larger in heast while the increase significant in the northwest; meanwhile, the stations with earlier transition points of precipitation and temperature were located mostly in the southeastern Peninsula. This implied that the summer monsoon had an earlier change than winter monsoon. And we can further speculate that the impact of the Pacific Ocean on the monsoon climate in the study area was possibly greater than the Eurasia. In conclusion, the coastal climate of Shandong Penin- sula was characterised by a remarkable warming trend, which was on the basis of getting drier over the past 50 years. This variation in climate, coupled with the in- crease of the exploitation of water resources, will inevi- tably reduce the river runoff and sediment load into the coastal area [50-53]. Correspondingly, it will exert far- reaching effects on the hydrological regime and sediment namic conditions of the bay and estuary: this will be the focus of further research. 6. Conclusions The variation characteristics of both precipitation and temperature in Shandong Peninsula of China over the past 50 years have been studied in this paper. The major conclusions are: 1) The annual mean temperature of Shandong Penin- sula showed a significant inc Copyright © 2012 SciRes. IJG  Q. TIAN ET AL. 388 abrupt change was detected around 1990 during the past o. Z2008E03); ning Project of Higher Edu- , China (No. J09LE07); Sci- 5 decades. The change characteristics observed in annual minimum temperature was basically consistent with the annual mean temperature throughout the study area, ex- cept the Haiyang Station, which has an earlier transition point at 1972. The annual maximum temperature exhi- bited a very complex change trend. Some stations showed a slight upward trend for the annual maximum tempera- ture, while the opposite trend was observed in the other stations, but they were all statistically insignificant and no abrupt change was observed. Therefore, the direct cause that leads to the warming of Shandong Peninsula for the last 50 years was the significant increase of the annual minimum temperature. 2) The variation characteristics of precipitation, from June to September, seem to be in good agreement with the annual precipitation in Jiaodong Peninsula over the past 50 years. They showed a decreasing trend conform- ably, but the decreasing trend was significant at a few stations. The transition points of annual precipitation and June-September precipitation at most stations were de- tected around 1980, while a few stations showed an ear- lier transition point at 1966. The reduction in the June- September precipitation was responsible mainly for the decrease of annual precipitation. Meanwhile, the propor- tion of June-September rainfall of the whole year de- clined slightly, but it was not significant. 3) The temperature increasing collocated with pre- cipitation decreasing in Shandong Peninsula over the past 50 years. However, the abrupt change of precipitation was delayed for about 10 years, after the temperature. The variation characteristics of temperature in Shandong Peninsula was basically consistent with most parts of China, with the exact transition point being almost syn- chronous, but warmed at a faster rate over the same pe- riod; and the decreasing trend of precipitation in Shan- dong Peninsula was most significant all over China. Within the Peninsula, the abrupt change of temperature and precipitation in the Southeast was earlier than that in the Northwest; besides, the reduction of precipitation was larger in the Southeast while the increase of temperature was more significant in the Northwest. 7. Acknowledgements This study was jointly funded by National Natural Sci- ence Foundation of China (No. 41071011 and No. 41171158); Key Project of Chinese Ministry of Educa- tion (No. 210122); Key Project of Natural Science Foun- dation of Shandong Province, China (N Science and Technology Plan cation in Shandong Province entific and Technological Project of Yantai, China (No. 2008323). The authors are grateful for the support. REFERENCES [1] C. Keltoum, N. Luc, D. Claudine, P. Nicolas, L. Bernard, M. Eric, S. Dallas and C. Yvan, “Analyses of Precipita- tion, Temperature and Evapotranspiration in a French Mediterranean Region in the Context of Climate Change,” Comptes Rendus Geoscience, Vol. 342, No. 3, 2010, pp. 234-243. doi:10.1016/j.crte.2010.02.001 [2] Intergovernmental Panel on Climate Change (I “Summary for Policymakers, in Climate Change 2007: PCC), the Physical Science Basis,” In: S. Solomon, et al., Eds., Contribution othe 4th Assessment f Working Group I to Report of the Intergovernmental Panel on Climate Change, Cambridge University Press, Cambridge, 2007, pp. 1-13. [3] M. V. Flavio, L. D. P. Susana and A. S. Marcelo, “Ana- lysis of the Global Warming Dynamics from Temperature Time Series,” Ecological Modelling, Vol. 221, No. 16, 2010, pp. 1964-1978. doi:10.1016/j.ecolmodel.2010.05.001 [4] V. Ramanathan and Y. Feng, “Air Pollution, Greenhouse Gases and Climate Change: Global and Regional Pers- pectives,” Atmospheric Environment, Vol. 43, No. 1, 2009, pp. 37-50. doi:10.1016/j.atmosenv.2008.09.063 [5] Meteorological Administration of China, “Climate and tions,” Journal of Arid Environ- 77. Environment in China,” Meteorology Press, Beijing, 2006. [6] E. Lioubimtseva and G. M. Henebry, “Climate and Envi- ronmental Change in Arid Central Asia: Impacts, Vul- nerability, and Adapta ments, Vol. 73, No. 11, 2009, pp. 963-9 doi:10.1016/j.jaridenv.2009.04.022 [7] Y. X. Liu, X. Li, Q. Zhang, Y. F. Guo, G. Gao and J. P. Wang, “Simulation of Regional Temperature and Pre- cipitation in the Past 50 Years and the Next 30 Years over China,” Quaternary International, Vol. 212, No. 1, 2010, pp. 57-63. doi:10.1016/j.quaint.2009.01.007 [8] T. Malone, P. Di Giacomo and E. Gonçalves, “Climate Change, Sustainable Development and Coastal Ocean In- formation Needs,” Procedia Environmental Sciences, Vol. 1, 2010, pp. 324-341. doi:10.1016/j.proenv.2010.09.021 [9] C. S. Biliana and K. Robert, “Integrated Coastal and eninsula and Ocean Management: Concepts and Practices,” Island Press, Washington DC, 1998. [10] N. Isabelle, D. Mamadou, F. Serigne, G. Khadim and N. Pape, “Impacts of Climate Change on the Senegalese Coastal Zones: Examples of the Cap Vert P Saloum Estuary,” Global and Planetary Change, Vol. 72, No. 4, 2010, pp. 294-301. doi:10.1016/j.gloplacha.2010.01.005 [11] J. N. Robert and A. L. Jason, “Benefits of Mitigation of Climate Change for Coastal Areas,” Global Environ- mental Change Part A, Vol. 14, No. 3, 2004, pp. 229- 244. [12] W. Z. Cao and M. H. Wong, “Current Status of Coastal Zone Issues and Management in China: A Review,” En- vironment International, Vol. 33, No. 7, 2007, pp. 985- 992. doi:10.1016/j.envint.2007.04.009 [13] Y. Z. Zhang and D. K. Z Area to the Studies on Global Chang hu, “Coastal Zone—The Key e,” Marine Science Bulletin, Vol. 16, No. 3, 1997, pp. 69-80. Copyright © 2012 SciRes. IJG  Q. TIAN ET AL. 389 [14] Q . J. Sun, Y. Z. Lin, Y. L. Wu, S. D. Li and R. X. Jin, “Geography of Shandong Province,” China Education Press, Beijing, 1987, p. 97. [15] M. Domros and G. B. Peng, “The Climate of China,” Springer-Verlag, Berlin, 1988, p. 360. doi:10.1007/978-3-642-73333-8 [16] Shandong China, Office of Land and Resources Staff, “Shandong Land Resources Atlas,” Shandong Carto- reme Tempera- 0. graphic Publishing House, Jinan, 2007, p. 13. [17] Z. Li, F. L. Zheng, W. Z. Liu and C. F. Dennis, “Spatial Distribution and Temporal Trends of Ext ture and Precipitation Events on the Loess Plateau of China during 1961-2007,” Quaternary International, Vol. 226, No. 1-2, 2010, pp. 92-10 doi:10.1016/j.quaint.2010.03.003 [18] X. M. Hao, Y. N. Chen, C. C. Xu and W of Climate Change and Human Activit . H. Li, “Im ies on the Surface pacts Runoff in the Tarim River Basin over the Last Fifty Years,” Water Resour Manage, Vol. 22, 2008, pp. 1159- 1171. doi:10.1007/s11269-007-9218-4 [19] K. H. Xu, D. M. John and H. Xu, “Temporal Trend of Precipitation and Runoff in Major Chinese Rivers since 1951,” Journal of Hydrology, Vol. 73, No. 3-4, 2010, pp. 219-232. [20] Z. T. Cong, J. J. Zhao, D. W. Yang and derstanding the Hydrological Tren G. H. Ni, “Un- ds of River Basins in China,” Journal of Hydrology, Vol. 388, No. 3-4, 2010, pp. 350-356. doi:10.1016/j.jhydrol.2010.05.013 [21] X. Y. Li, Y. Luo and L. X. Wang, “Study on the Distur- bance of Human Activities on the Hydrological Process in Tarim River Watershed,” Journal of Zhengzhou Univer- Trend and Abrupt Climate Change in China a Diurnal Range in China during 1951-2002,” Climatic ation across China un- . Liu, “Climate Changes of alf of the 20th Century,” Acta Geographica Geographica 8, sian Summer Monsoon. sity (Engineering Science), Vol. 23, No. 4, 2003, pp. 93- 98. [22] Y. H. Yin, S. H. Wu and G. Chen, “Regional Difference of Climate during 1961-2006,” Journal of Natural Resources, Vol. 24, No. 12, 2009, pp. 2147-2157. [23] H. Y. Tang and P. M. Zhai, “Contrast of Variations of Surface Air Temperatures in Eastern and Western Chin during 1951-2002,” Chinese Journal of Geophysics, Vol. 48, No. 3, 2005, pp. 61-69. [24] H. Y. Tang, P. M. Zhai and Z. Y. Wang, “On Change in Mean Maximum Temperature, Minimum Temperature and and Environmental Research, Vol. 10, No. 4, 2005, pp. 728-735. [25] A. G. Lu, S. C. Kang, D. Q. Pang and T. M. Wang, “Asynchronous Temperature Vari der the Background of Global Warming,” Arid Land Ge- ography, Vol. 32, No. 4, 2009, pp. 506-511. [26] G. Y. Ren, J. Guo, M. Z. Xu, Z. Y. Chu, L. Zhang, X. K. Zou, Q. X. Li and X. N China’s Mainland over the Past Half Century,” Acta Me- teorologica Sinica, Vol. 63, No. 6, 2005, pp. 942-956. [27] P. M. Zhai and X. H. Pan, “Change in Extreme Tempera- ture and Precipitation over Northern China during the Second H Sinica, Vol. 58, 2003, pp. 1-10. [28] Z. G. Ma, C. B. Fu, X. B. Ren and C. Yang, “Trend of Annual Extreme Temperature and Its Relationship to Re- gional Warming in Northern China,” Acta Sinica, Vol. 58, 2003, pp. 11-20. [29] N. Zhang, Z. B. Sun and G. Zeng, “Change of Extreme Temperatures in China during 1955-2005,” Journal of Nanjing Institute of Meteorology, Vol. 30, No. 1, 200 pp. 123-128. [30] Y. H. Ding, Z. Y. Wang and Y. Sun, “Inter-Decadal Variation of the Summer Precipitation in East China and Its Association with Decreasing A Part I: Observed Evidences,” International Journal of Climatology, Vol. 28, No. 9, 2008, pp. 1139-1161. doi:10.1002/joc.1615 [31] Y. N. Chen, C. C. Xu, X. M. Hao, W. H. Li, Y. P. Chen, C. G. Zhu and Z. X. Ye, “Fifty-Year Climate Change and Its Effect on Annual Runoff in the Tarim River Basin, China,” Quaternary International, Vol. 208, No. 1-2, 2009, pp. 53-61. doi:10.1016/j.quaint.2008.11.011 [32] Y. F. Shi, Y. P. Shen and R. J. Hu, “Preliminary Study on Signal, Impact and Foreground of Climatic Shift from Warm-Dry to Warm-Humid in Northwest China,” Jour- nal of Glaciology and Geocryolog, Vol. 24, No. 3, 2002, pp. 219-226. [33] P. M. Zhai, X. B. Zhang, H. Wan and X. H. Pan, “Trends in Total Precipitation and Frequency of Daily Precipita- tion Extremes over China,” Journal of Climate, Vol. 18, No. 7, 2005, pp. 1096-1108. doi:10.1175/JCLI-3318.1 [34] S. Buda, G. Marco and J. Tong, “Spatial and Temporal Variation of Extreme Precipitation over the Yangtze River Basin,” Quaternary International, Vol. 186, No. 1, 2008, pp. 22-31. doi:10.1016/j.quaint.2007.09.001 [35] Q. Zhang, C. Y. Xu, Z. Zhang, Y. D. Chen and C. L. Liu, “Spatial and Temporal Variability of Precipitation over China, 1951-2005,” Theoretical and Applied Climatology, Vol. 95, No. 1-2, 2009, pp. 53-68. doi:10.1007/s00704-007-0375-4 [36] Z. G. Zhao and L. Xu, “Potential Impact on El Ni~no Events on the Circulation and Climate Variation in for the China,” Wea Climate, Vol. 1, 2002, pp. 109-118. [37] W. H. Qian, H. N. Zhang and Y. F. Zhu, “Interannual and Interdecadal Variability of East Asian Acas and Their Impact on Temperature of China in Winter Season Last Century,” Advances in Atmospheric Science, Vol. 18, No. 4, 2001, pp. 511-523. doi:10.1007/s00376-001-0041-1 [38] D. Y. Gong and C. H. Ho, “The S mate Change over Middle to High La iberian High and Cli- titude Asia,” Earth and Theoretical and Applied Climatology, Vol. 72, No. 1-2, 2002, pp. 1-9. doi:10.1007/s007040200008 [39] D. E. Zhang, H. C. Li, T. L. Ku and L. H. Lu, “On Link- ing Climate to Chinese Dynastic Change: Spatial and Temporal Variations of Monsoonal Rain,” Chinese Sci- ence Bulletin, Vol. 55, No. 1, 2010, pp. 77-83. doi:10.1007/s11434-009-0584-6 [40] Q. Y. Guo, J. N. Cai, X. M. Sha decadal Variability of East-Asian o and W. Y. Sha, “Inter- Summer Monsoon and Its Impact on the Climate of China,” Acta Geographica Copyright © 2012 SciRes. IJG  Q. TIAN ET AL. Copyright © 2012 SciRes. IJG 390 Precipi- Sinica, Vol. 4, 2003, pp. 569-576. [41] Y. H. Ding, Y. Sun, Z. Y. Wang, Y. X. Zhu and Y. F. Song, “Inter-Decadal Variation of the Summer tation in China and Its Association with Decreasing Asian Summer Monsoon. Part II: Possible Causes,” Interna- tional Journal of Climatology, Vol. 29, No. 13, 2009, pp. 1926-1944. doi:10.1002/joc.1759 [42] F. L. Yang and K. M. Lau, “Trend and Variability of China Precipitation in Spring and Summer: Linkage to Sea-Surface Temperatures,” International Journal of Cli- matology, Vol. 24, No. 13, 2004, pp. 1625-1644. doi:10.1002/joc.1094 [43] F. Huang, H. Wang and P. Dai, “Spatial-Temporal Char- acters of the Monsoon-Ocean Coupled Mode over the South China Sea and Its Relation with Summer Precipita- tion of China,” Periodical of Ocean University of China, Vol. 37, No. 3, 2007, pp. 351-356. [44] H. J. Wang, “The Weakening of the Asian Monsoon Cir- te- 22, No. 4, 2008, pp. 404-418. Plateau: The Asso- culation after the End of the 1970’s,” Advances in At- mospheric Sciences, Vol. 18, No. 3, 2001, pp. 376-386. [45] Y. H. Ding and Y. Y. Liu, “A Study of the Teleconnec- tions in the Asian-Pacific Monsoon Region,” Acta Me orologica Sinica, Vol. [46] L. Q. Liang, L. J. Li and Q. Liu, “Precipitation Variability in Northeast China from 1961 to 2008,” Journal of Hy- drology, Vol. 404, No. 1-2, 2011, pp. 67-76. [47] Y. S. Zhang, T. Li and B. Wang, “Decadal Change of the Spring Snow Depth over the Tibetan ciated Circulation and Influence on the East Asian Sum- mer Monsoon,” Journal of Climate, Vol. 17, No. 14, 2004, pp. 2780-2793. doi:10.1175/1520-0442(2004)017<2780:DCOTSS>2.0.C O;2 [48] N. J. Wan, H. C. Li, Z. Q. Liu, H. Y. Yang, D. X. Yuan and Y. H. Chen, “Spatial Variations of Monsoonal Rain in Eastern China: Instrumental, Historic and Speleothem Records,” Journal of Asian Earth Sciences, Vol. 40, No. 6, 20 11, pp. 1139-1150. doi:10.1016/j.jseaes.2010.10.003 [49] M. V. C. Leila, J. Charles and L. Brant, “Extreme Pre- cipitation Events in Southeastern South America and Large-Scale Convective Patterns in the South Atlantic Convergence Zone,” Journal of Climate, Vol. 15, No. 17, 2002, pp. 2377-2394. doi:10.1175/1520-0442(2002)015<2377:EPEISS>2.0.CO ;2 [50] B. Claudine, C. Diane, C. Isabelle and G. R. André, “Im- pact of Climate Change on the Hydrology of St. Law- rence Tributaries,” Journal of Hydrology, Vol. 384, No. 1-2, 2010, pp. 65-83. doi:10.1016/j.jhydrol.2010.01.011 [51] T. Hans, “The Influence of Climate Change on Stream Flow in Danish Rivers,” Journal of Hydrology, Vol. 333, No. 2-4, 2007, pp. 226-238. doi:10.1016/j.jhydrol.2006.08.012 [52] D. E. Walling and D. Fang, “Recent Trends in the Sus- pended Sediment Loads of the World’s Rivers,” Global and Planetary Change, Vol. 39, No. 2-3, 2003, pp. 111- 126. doi:10.1016/S0921-8181(03)00020-1 2007.05.001 [53] Y. M. Zhu, X. X. Lu and Y. Zhou, “Sediment Flux Sen- sitivity to Climate Change: A Case Study in the Long- chuanjiang Catchment of the Upper Yangtze River, China,” Global and Planetary Change, Vol. 60, No. 3-4, 2008, pp. 429-442. doi:10.1016/j.gloplacha.
|