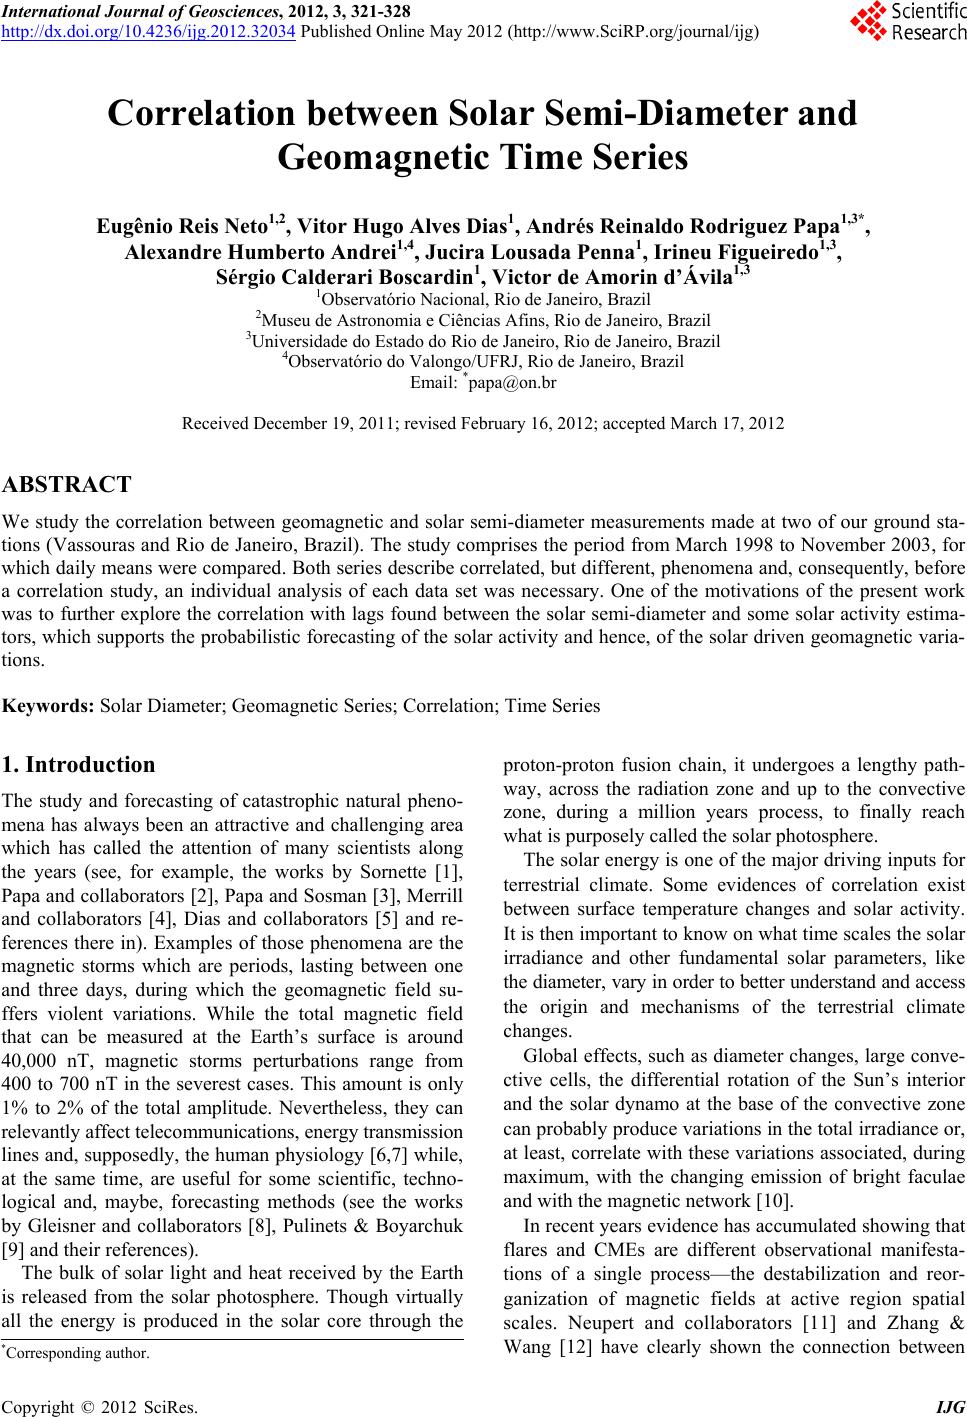
 International Journal of Geosciences, 2012, 3, 321-328 http://dx.doi.org/10.4236/ijg.2012.32034 Published Online May 2012 (http://www.SciRP.org/journal/ijg) Correlation between Solar Semi-Diameter and Geomagnetic Time Series Eugênio Reis Neto1,2, Vitor Hugo Alves Dias1, Andrés Reinaldo Rodriguez Papa1,3*, Alexandre Humberto Andrei1,4, Jucira Lousada Penna1, Irineu Figueiredo1,3, Sérgio Calderari Boscardin1, Victor de Amorin d’Ávila1,3 1Observatório Nacional, Rio de Janeiro, Brazil 2Museu de Astronomia e Ciências Afins, Rio de Janeiro, Brazil 3Universidade do Estado do Rio de Janeiro, Rio de Janeiro, Brazil 4Observatório do Valongo/UFRJ, Rio de Janeiro, Brazil Email: *papa@on.br Received December 19, 2011; revised February 16, 2012; accepted March 17, 2012 ABSTRACT We study the correlation between geomagnetic and solar semi-diameter measurements made at two of our ground sta- tions (Vassouras and Rio de Janeiro, Brazil). The study comprises the period from March 1998 to November 2003, for which daily means were compared. Both series describe correlated, but different, phenomena and, consequently, before a correlation study, an individual analysis of each data set was necessary. One of the motivations of the present work was to further explore the correlation with lags found between the solar semi-diameter and some solar activity estima- tors, which supports the probabilistic forecasting of the solar activity and hence, of the solar driven geomagnetic varia- tions. Keywords: Solar Diameter; Geomagnetic Series; Correlation; Time Series 1. Introduction The study and forecasting of catastrophic natural pheno- mena has always been an attractive and challenging area which has called the attention of many scientists along the years (see, for example, the works by Sornette [1], Papa and collaborators [2], Papa and Sosman [3], Merrill and collaborators [4], Dias and collaborators [5] and re- ferences there in). Examples of those phenomena are the magnetic storms which are periods, lasting between one and three days, during which the geomagnetic field su- ffers violent variations. While the total magnetic field that can be measured at the Earth’s surface is around 40,000 nT, magnetic storms perturbations range from 400 to 700 nT in the severest cases. This amount is only 1% to 2% of the total amplitude. Nevertheless, they can relevantly affect telecommunications, energy transmission lines and, supposedly, the human physiology [6,7] while, at the same time, are useful for some scientific, techno- logical and, maybe, forecasting methods (see the works by Gleisner and collaborators [8], Pulinets & Boyarchuk [9] and their references). The bulk of solar light and heat received by the Earth is released from the solar photosphere. Though virtually all the energy is produced in the solar core through the proton-proton fusion chain, it undergoes a lengthy path- way, across the radiation zone and up to the convective zone, during a million years process, to finally reach what is purposely called the solar photosphere. The solar energy is one of the major driving inputs for terrestrial climate. Some evidences of correlation exist between surface temperature changes and solar activity. It is then important to know on what time scales the solar irradiance and other fundamental solar parameters, like the diameter, vary in order to better understand and access the origin and mechanisms of the terrestrial climate changes. Global effects, such as diameter changes, large conve- ctive cells, the differential rotation of the Sun’s interior and the solar dynamo at the base of the convective zone can probably produce variations in the total irradiance or, at least, correlate with these variations associated, during maximum, with the changing emission of bright faculae and with the magnetic network [10]. In recent years evidence has accumulated showing that flares and CMEs are different observational manifesta- tions of a single process—the destabilization and reor- ganization of magnetic fields at active region spatial scales. Neupert and collaborators [11] and Zhang & Wang [12] have clearly shown the connection between *Corresponding author. C opyright © 2012 SciRes. IJG 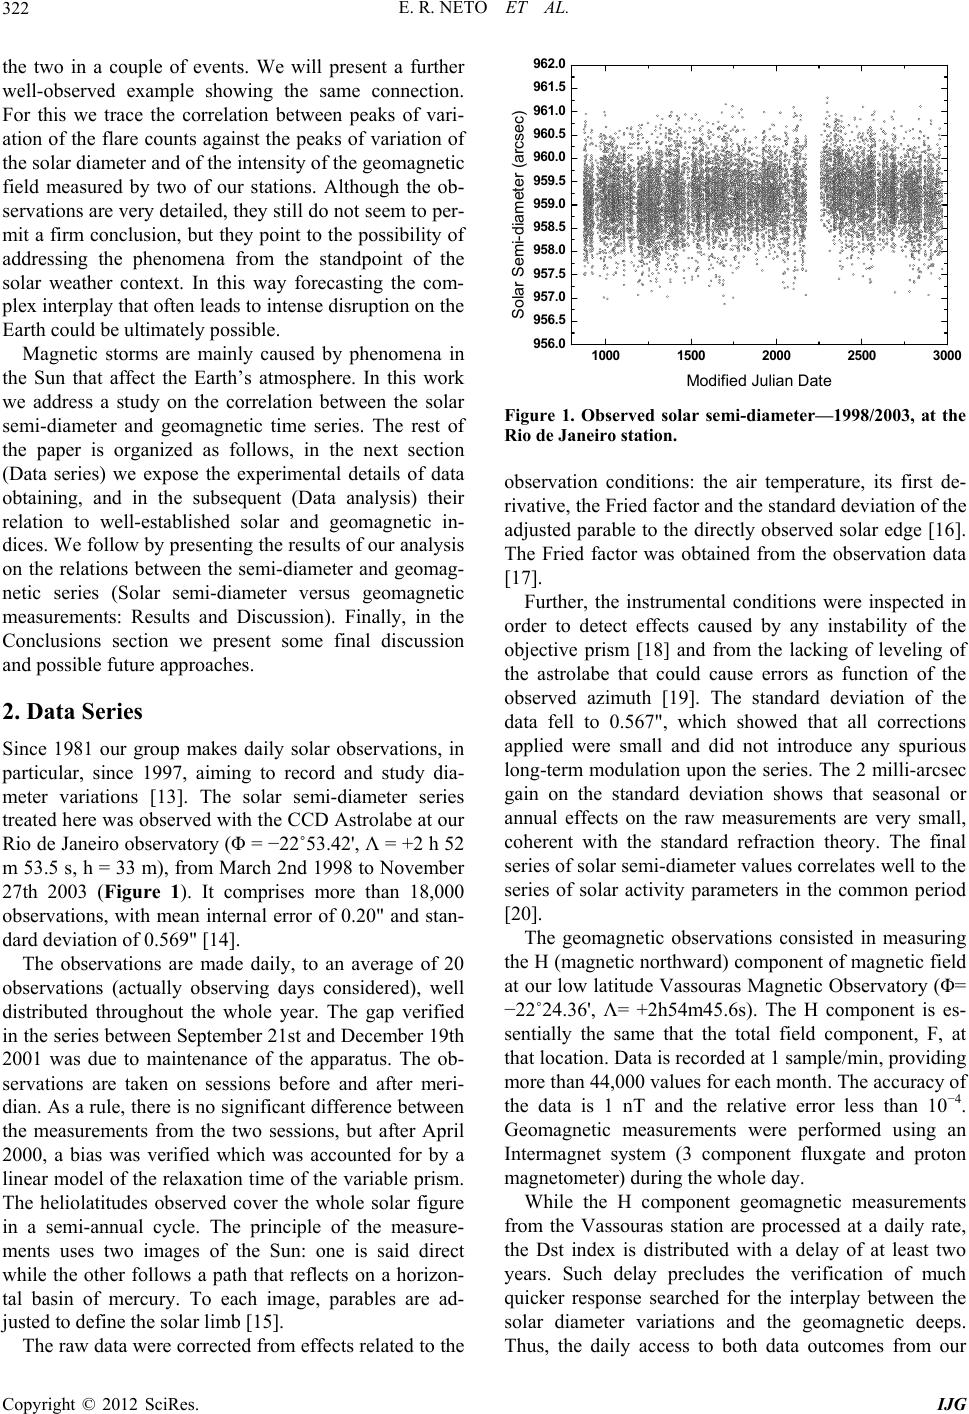 E. R. NETO ET AL. 322 the two in a couple of events. We will present a further 1000 1500 2000 2500 3000 956.0 956.5 957.0 957.5 958.0 958.5 959.0 959.5 960.0 960.5 961.0 961.5 962.0 well-observed example showing the same connection. For this we trace the correlation between peaks of vari- ation of the flare counts against the peaks of variation of the solar diameter and of the intensity of the geomagnetic field measured by two of our stations. Although the ob- servations are very detailed, they still do not seem to per- mit a firm conclusion, but they point to the possibility of addressing the phenomena from the standpoint of the solar weather context. In this way forecasting the com- plex interplay that often leads to intense disruption on the Earth could be ultimately possible. Solar Semi-diameter (arcsec) Modified Julian Date Magnetic storms are mainly caused by phenomena in the Sun that affect the Earth’s atmosphere. In this work we address a study on the correlation between the solar semi-diameter and geomagnetic time series. The rest of the paper is organized as follows, in the next section (Data series) we expose the experimental details of data obtaining, and in the subsequent (Data analysis) their relation to well-established solar and geomagnetic in- dices. We follow by presenting the results of our analysis on the relations between the semi-diameter and geomag- netic series (Solar semi-diameter versus geomagnetic measurements: Results and Discussion). Finally, in the Conclusions section we present some final discussion and possible future approaches. 2. Data Series Since 1981 our group makes daily solar observations, in particular, since 1997, aiming to record and study dia- meter variations [13]. The solar semi-diameter series treated here was observed with the CCD Astrolabe at our Rio de Janeiro observatory (Φ = −22˚53.42', Λ = +2 h 52 m 53.5 s, h = 33 m), from March 2nd 1998 to November 27th 2003 (Figure 1). It comprises more than 18,000 observations, with mean internal error of 0.20" and stan- dard deviation of 0.569" [14]. The observations are made daily, to an average of 20 observations (actually observing days considered), well distributed throughout the whole year. The gap verified in the series between September 21st and December 19th 2001 was due to maintenance of the apparatus. The ob- servations are taken on sessions before and after meri- dian. As a rule, there is no significant difference between the measurements from the two sessions, but after April 2000, a bias was verified which was accounted for by a linear model of the relaxation time of the variable prism. The heliolatitudes observed cover the whole solar figure in a semi-annual cycle. The principle of the measure- ments uses two images of the Sun: one is said direct while the other follows a path that reflects on a horizon- tal basin of mercury. To each image, parables are ad- justed to define the solar limb [15]. The raw data were corrected from effects related to the Figure 1. Observed solar semi-diameter—1998/2003, at the Rio de Janeiro station. observation conditions: the air temperature, its first de- rivative, the Fried factor and the standard deviation of the adjusted parable to the directly observed solar edge [16]. The Fried factor was obtained from the observation data [17]. Further, the instrumental conditions were inspected in order to detect effects caused by any instability of the objective prism [18] and from the lacking of leveling of the astrolabe that could cause errors as function of the observed azimuth [19]. The standard deviation of the data fell to 0.567", which showed that all corrections applied were small and did not introduce any spurious long-term modulation upon the series. The 2 milli-arcsec gain on the standard deviation shows that seasonal or annual effects on the raw measurements are very small, coherent with the standard refraction theory. The final series of solar semi-diameter values correlates well to the series of solar activity parameters in the common period [20]. The geomagnetic observations consisted in measuring the H (magnetic northward) component of magnetic field at our low latitude Vassouras Magnetic Observatory (Φ= −22˚24.36', Λ= +2h54m45.6s). The H component is es- sentially the same that the total field component, F, at that location. Data is recorded at 1 sample/min, providing more than 44,000 values for each month. The accuracy of the data is 1 nT and the relative error less than 10−4. Geomagnetic measurements were performed using an Intermagnet system (3 component fluxgate and proton magnetometer) during the whole day. While the H component geomagnetic measurements from the Vassouras station are processed at a daily rate, the Dst index is distributed with a delay of at least two years. Such delay precludes the verification of much quicker response searched for the interplay between the solar diameter variations and the geomagnetic deeps. Thus, the daily access to both data outcomes from our Copyright © 2012 SciRes. IJG 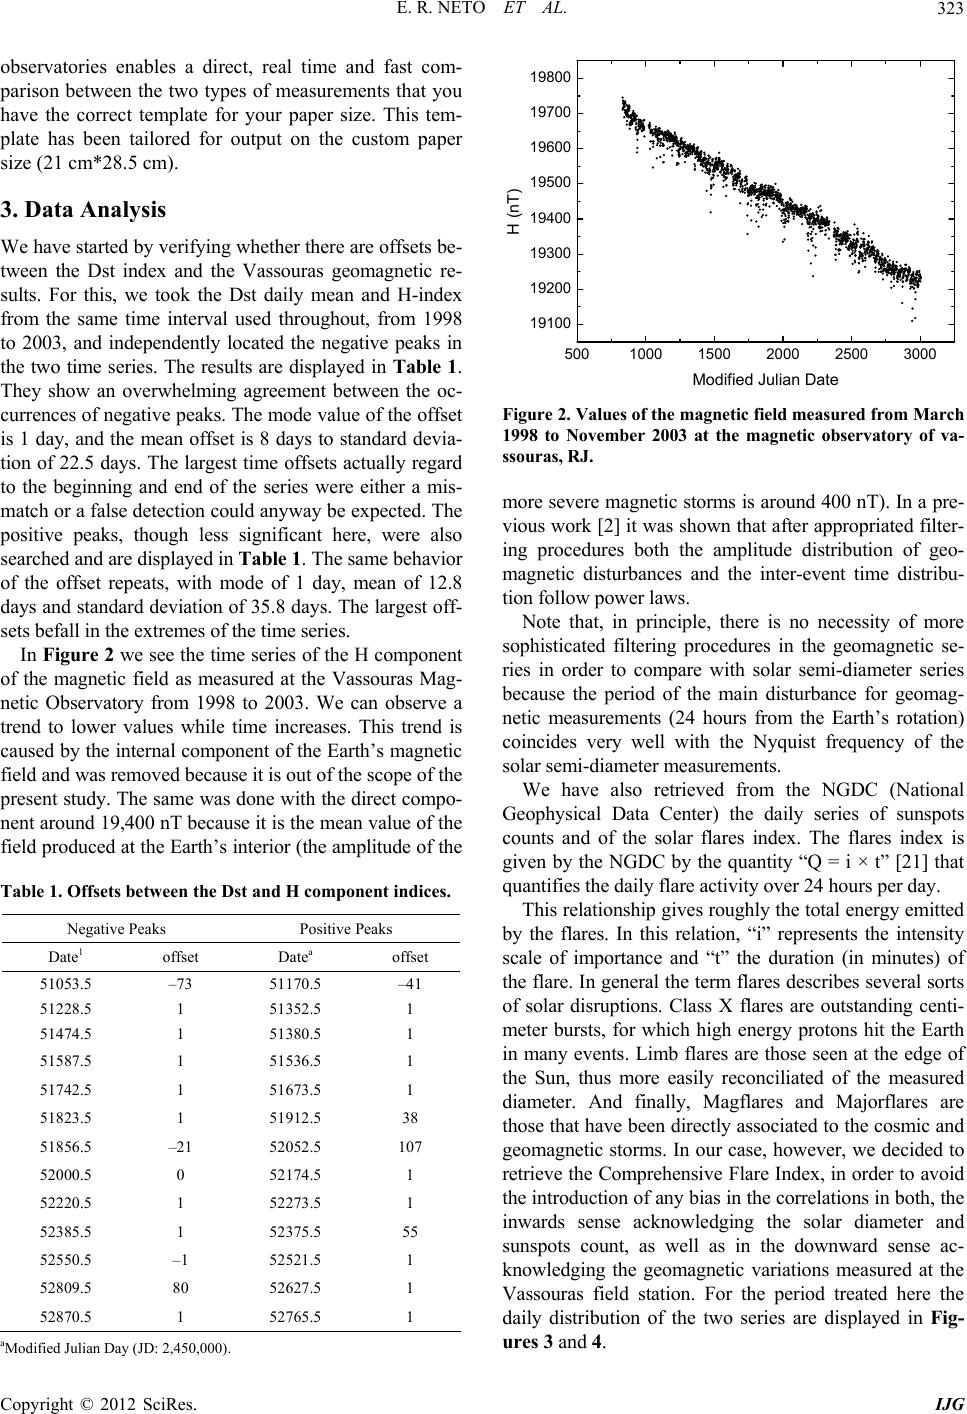 E. R. NETO ET AL. 323 observatories enables a direct, real time and fast com- parison between the two types of measurements that you have the correct template for your paper size. This tem- plate has been tailored for output on the custom paper size (21 cm*28.5 cm). 5001000 1500 2000 2500 3000 19100 19200 19300 19400 19500 19600 19700 19800 H (nT) Modified Julian Date 3. Data Analysis We have started by verifying whether there are offsets be- tween the Dst index and the Vassouras geomagnetic re- sults. For this, we took the Dst daily mean and H-index from the same time interval used throughout, from 1998 to 2003, and independently located the negative peaks in the two time series. The results are displayed in Table 1. They show an overwhelming agreement between the oc- currences of negative peaks. The mode value of the offset is 1 day, and the mean offset is 8 days to standard devia- tion of 22.5 days. The largest time offsets actually regard to the beginning and end of the series were either a mis- match or a false detection could anyway be expected. The positive peaks, though less significant here, were also searched and are displayed in Table 1. The same behavior of the offset repeats, with mode of 1 day, mean of 12.8 days and standard deviation of 35.8 days. The largest off- sets befall in the extremes of the time series. In Figure 2 we see the time series of the H component of the magnetic field as measured at the Vassouras Mag- netic Observatory from 1998 to 2003. We can observe a trend to lower values while time increases. This trend is caused by the internal component of the Earth’s magnetic field and was removed because it is out of the scope of the present study. The same was done with the direct compo- nent around 19,400 nT because it is the mean value of the field produced at the Earth’s interior (the amplitude of the Table 1. Offsets between the Dst and H component indices. Negative Peaks Positive Peaks Date1 offset Datea offset 51053.5 –73 51170.5 –41 51228.5 1 51352.5 1 51474.5 1 51380.5 1 51587.5 1 51536.5 1 51742.5 1 51673.5 1 51823.5 1 51912.5 38 51856.5 –21 52052.5 107 52000.5 0 52174.5 1 52220.5 1 52273.5 1 52385.5 1 52375.5 55 52550.5 –1 52521.5 1 52809.5 80 52627.5 1 52870.5 1 52765.5 1 aModified Julian Day (JD: 2,450,000). Figure 2. Values of the magnetic field measured from March 1998 to November 2003 at the magnetic observatory of va- ssouras, RJ. more severe magnetic storms is around 400 nT). In a pre- vious work [2] it was shown that after appropriated filter- ing procedures both the amplitude distribution of geo- magnetic disturbances and the inter-event time distribu- tion follow power laws. Note that, in principle, there is no necessity of more sophisticated filtering procedures in the geomagnetic se- ries in order to compare with solar semi-diameter series because the period of the main disturbance for geomag- netic measurements (24 hours from the Earth’s rotation) coincides very well with the Nyquist frequency of the solar semi-diameter measurements. We have also retrieved from the NGDC (National Geophysical Data Center) the daily series of sunspots counts and of the solar flares index. The flares index is given by the NGDC by the quantity “Q = i × t” [21] that quantifies the daily flare activity over 24 hours per day. This relationship gives roughly the total energy emitted by the flares. In this relation, “i” represents the intensity scale of importance and “t” the duration (in minutes) of the flare. In general the term flares describes several sorts of solar disruptions. Class X flares are outstanding centi- meter bursts, for which high energy protons hit the Earth in many events. Limb flares are those seen at the edge of the Sun, thus more easily reconciliated of the measured diameter. And finally, Magflares and Majorflares are those that have been directly associated to the cosmic and geomagnetic storms. In our case, however, we decided to retrieve the Comprehensive Flare Index, in order to avoid the introduction of any bias in the correlations in both, the inwards sense acknowledging the solar diameter and sunspots count, as well as in the downward sense ac- knowledging the geomagnetic variations measured at the Vassouras field station. For the period treated here the daily distribution of the two series are displayed in Fig- ures 3 and 4. Copyright © 2012 SciRes. IJG 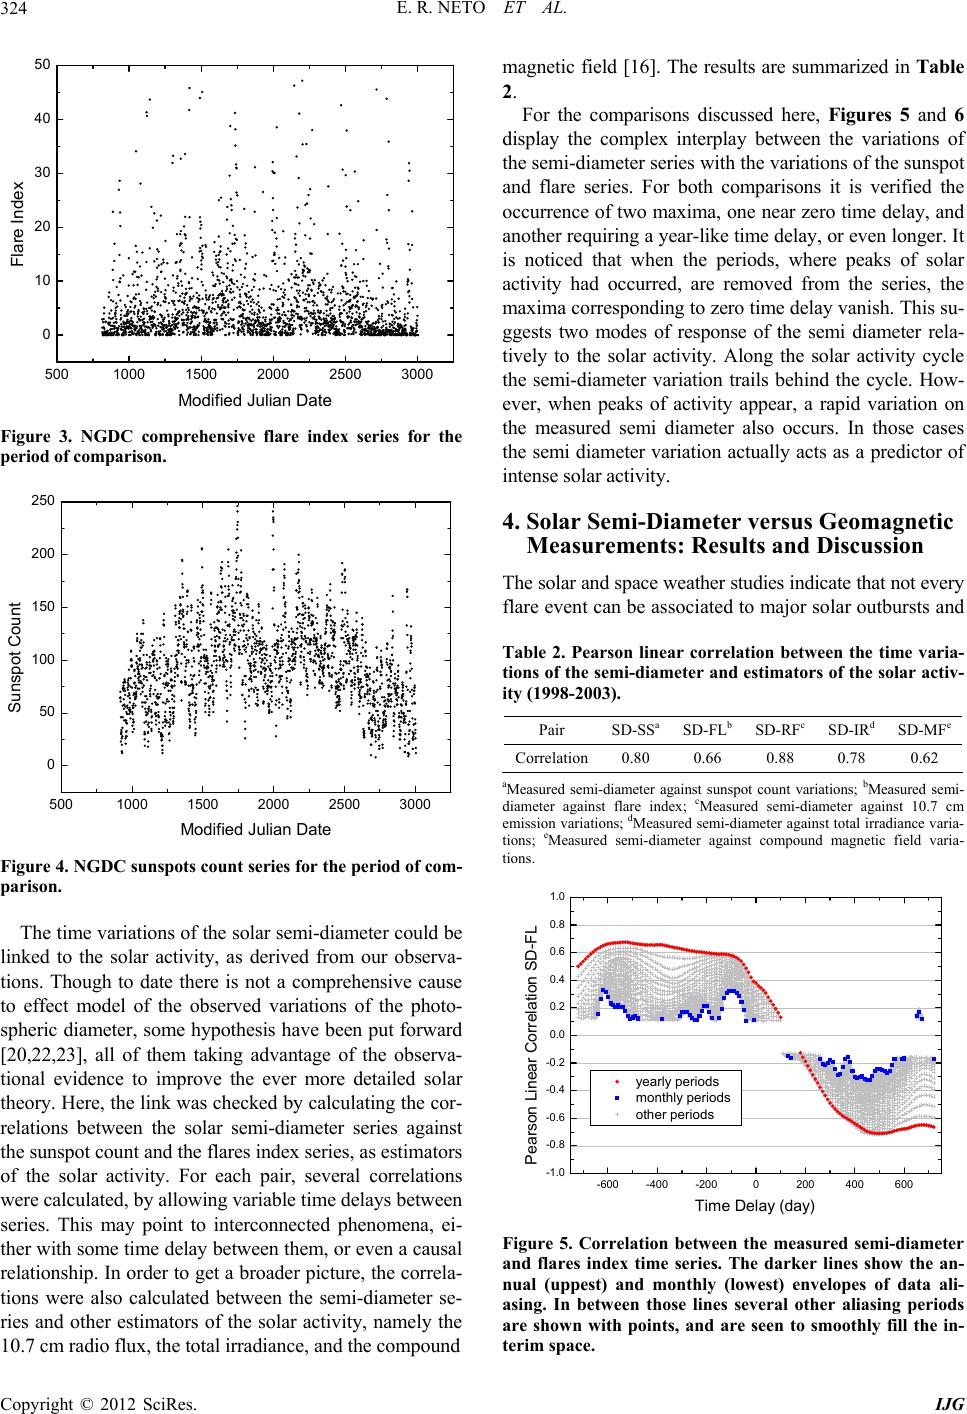 E. R. NETO ET AL. 324 5001000 1500 2000 2500 0 10 20 30 40 50 3000 Flare Index Modified Julian Date Figure 3. NGDC comprehensive flare index series for the period of comparison. 5001000 1500 2000 250 0 50 100 150 200 250 0 3000 Sunspot Count Modified Julian Date Figure 4. NGDC sunspots count series for the period of com- parison. The time variations of the solar semi-diameter could be linked to the solar activity, as derived from our observa- tions. Though to date there is not a comprehensive cause to effect model of the observed variations of the photo- spheric diameter, some hypothesis have been put forward [20,22,23], all of them taking advantage of the observa- tional evidence to improve the ever more detailed solar theory. Here, the link was checked by calculating the cor- relations between the solar semi-diameter series against the sunspot count and the flares index series, as estimators of the solar activity. For each pair, several correlations were calculated, by allowing variable time delays between series. This may point to interconnected phenomena, ei- ther with some time delay between them, or even a causal relationship. In order to get a broader picture, the correla- tions were also calculated between the semi-diameter se- ries and other estimators of the solar activity, namely the 10.7 cm radio flux, the total irradiance, and the compound magnetic field [16]. The results are summarized in Table 2. For the comparisons discussed here, Figures 5 and 6 display the complex interplay between the variations of the semi-diameter series with the variations of the sunspot and flare series. For both comparisons it is verified the occurrence of two maxima, one near zero time delay, and another requiring a year-like time delay, or even longer. It is noticed that when the periods, where peaks of solar activity had occurred, are removed from the series, the maxima corresponding to zero time delay vanish. This su- ggests two modes of response of the semi diameter rela- tively to the solar activity. Along the solar activity cycle the semi-diameter variation trails behind the cycle. How- ever, when peaks of activity appear, a rapid variation on the measured semi diameter also occurs. In those cases the semi diameter variation actually acts as a predictor of intense solar activity. 4. Solar Semi-Diameter versus Geomagnetic Measurements: Results and Discussion The solar and space weather studies indicate that not every flare event can be associated to major solar outbursts and Table 2. Pearson linear correlation between the time varia- tions of the semi-diameter and estimators of the solar activ- ity (1998-2003). Pair SD-SSaSD-FLb SD-RFc SD-IRdSD-MFe Correlation0.80 0.66 0.88 0.78 0.62 aMeasured semi-diameter against sunspot count variations; bMeasured semi- diameter against flare index; cMeasured semi-diameter against 10.7 cm emission variations; dMeasured semi-diameter against total irradiance varia- tions; eMeasured semi-diameter against compound magnetic field varia- tions. -600-400-2000200 400 600 -1.0 -0.8 -0.6 -0.4 -0.2 0.0 0.2 0.4 0.6 0.8 1.0 yearly peri od s monthly per iod s oth e r per iods Pearson Linear Correlation SD-F L Time Delay (day) Figure 5. Correlation between the measured semi-diameter and flares index time series. The darker lines show the an- nual (uppest) and monthly (lowest) envelopes of data ali- asing. In between those lines several other aliasing periods are shown with points, and are seen to smoothly fill the in- terim space. Copyright © 2012 SciRes. IJG 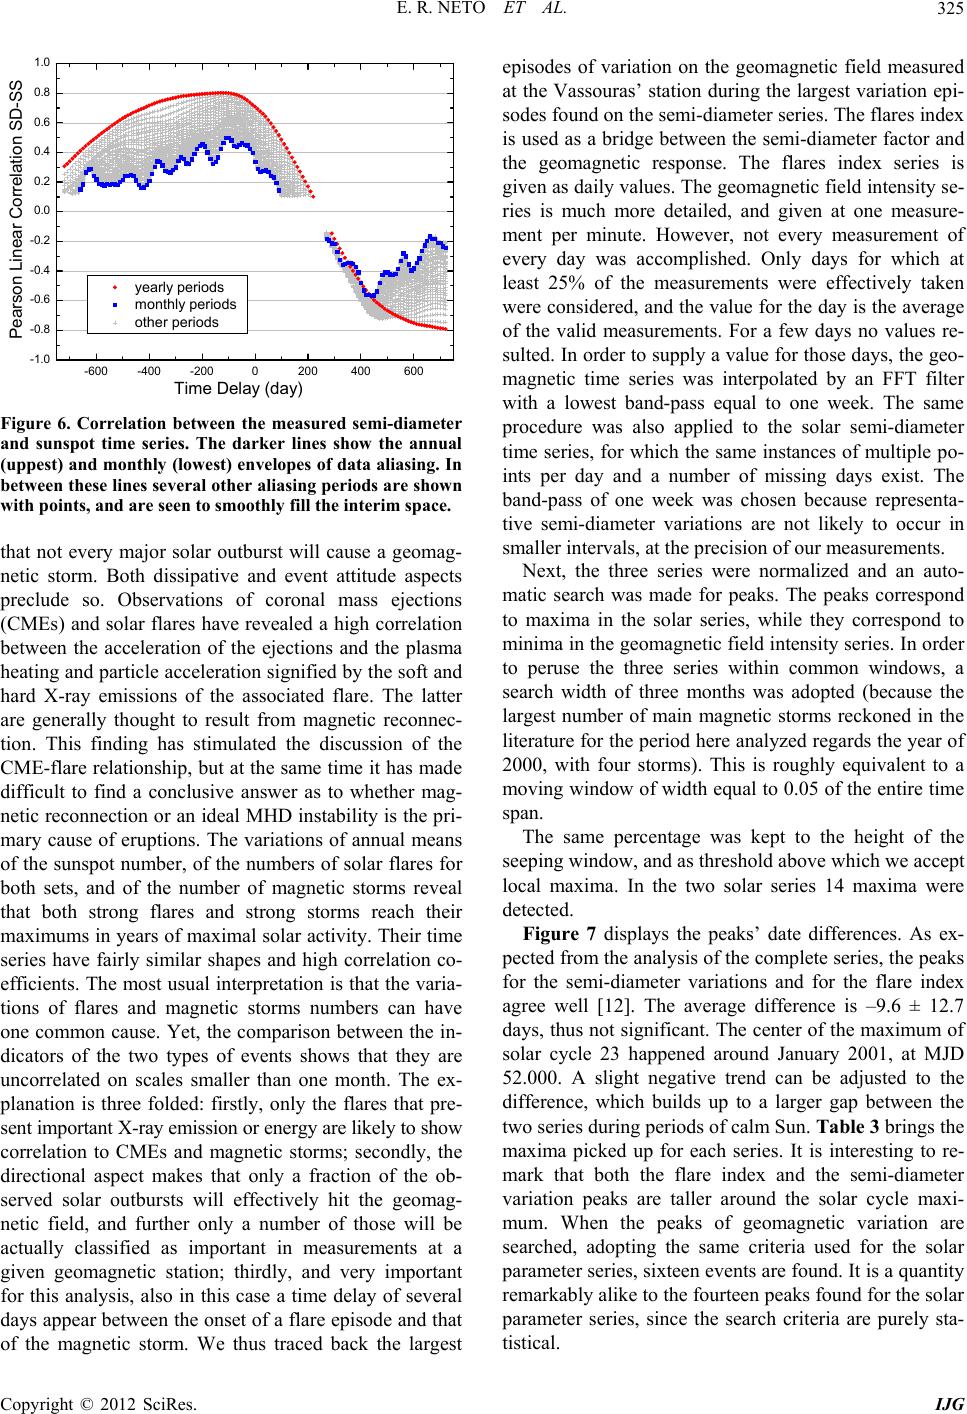 E. R. NETO ET AL. 325 -600 -400 -2000200 -1.0 -0.8 -0.6 -0.4 -0.2 0.0 0.2 0.4 0.6 0.8 1.0 400 600 Pearson Linear Correlat ion SD-SS Time Delay (day) yearly p er io ds monthly periods other periods Figure 6. Correlation between the measured semi-diameter and sunspot time series. The darker lines show the annual (uppest) and monthly (lowest) envelopes of data aliasing. In between these lines several other aliasing periods are shown with points, and are seen to smoothly fill the interim space. that not every major solar outburst will cause a geomag- netic storm. Both dissipative and event attitude aspects preclude so. Observations of coronal mass ejections (CMEs) and solar flares have revealed a high correlation between the acceleration of the ejections and the plasma heating and particle acceleration signified by the soft and hard X-ray emissions of the associated flare. The latter are generally thought to result from magnetic reconnec- tion. This finding has stimulated the discussion of the CME-flare relationship, but at the same time it has made difficult to find a conclusive answer as to whether mag- netic reconnection or an ideal MHD instability is the pri- mary cause of eruptions. The variations of annual means of the sunspot number, of the numbers of solar flares for both sets, and of the number of magnetic storms reveal that both strong flares and strong storms reach their maximums in years of maximal solar activity. Their time series have fairly similar shapes and high correlation co- efficients. The most usual interpretation is that the varia- tions of flares and magnetic storms numbers can have one common cause. Yet, the comparison between the in- dicators of the two types of events shows that they are uncorrelated on scales smaller than one month. The ex- planation is three folded: firstly, only the flares that pre- sent important X-ray emission or energy are likely to show correlation to CMEs and magnetic storms; secondly, the directional aspect makes that only a fraction of the ob- served solar outbursts will effectively hit the geomag- netic field, and further only a number of those will be actually classified as important in measurements at a given geomagnetic station; thirdly, and very important for this analysis, also in this case a time delay of several days appear between the onset of a flare episode and that of the magnetic storm. We thus traced back the largest episodes of variation on the geomagnetic field measured at the Vassouras’ station during the largest variation epi- sodes found on the semi-diameter series. The flares index is used as a bridge between the semi-diameter factor and the geomagnetic response. The flares index series is given as daily values. The geomagnetic field intensity se- ries is much more detailed, and given at one measure- ment per minute. However, not every measurement of every day was accomplished. Only days for which at least 25% of the measurements were effectively taken were considered, and the value for the day is the average of the valid measurements. For a few days no values re- sulted. In order to supply a value for those days, the geo- magnetic time series was interpolated by an FFT filter with a lowest band-pass equal to one week. The same procedure was also applied to the solar semi-diameter time series, for which the same instances of multiple po- ints per day and a number of missing days exist. The band-pass of one week was chosen because representa- tive semi-diameter variations are not likely to occur in smaller intervals, at the precision of our measurements. Next, the three series were normalized and an auto- matic search was made for peaks. The peaks correspond to maxima in the solar series, while they correspond to minima in the geomagnetic field intensity series. In order to peruse the three series within common windows, a search width of three months was adopted (because the largest number of main magnetic storms reckoned in the literature for the period here analyzed regards the year of 2000, with four storms). This is roughly equivalent to a moving window of width equal to 0.05 of the entire time span. The same percentage was kept to the height of the seeping window, and as threshold above which we accept local maxima. In the two solar series 14 maxima were detected. Figure 7 displays the peaks’ date differences. As ex- pected from the analysis of the complete series, the peaks for the semi-diameter variations and for the flare index agree well [12]. The average difference is –9.6 ± 12.7 days, thus not significant. The center of the maximum of solar cycle 23 happened around January 2001, at MJD 52.000. A slight negative trend can be adjusted to the difference, which builds up to a larger gap between the two series during periods of calm Sun. Table 3 brings the maxima picked up for each series. It is interesting to re- mark that both the flare index and the semi-diameter variation peaks are taller around the solar cycle maxi- mum. When the peaks of geomagnetic variation are searched, adopting the same criteria used for the solar parameter series, sixteen events are found. It is a quantity remarkably alike to the fourteen peaks found for the solar parameter series, since the search criteria are purely sta- tistical. Copyright © 2012 SciRes. IJG 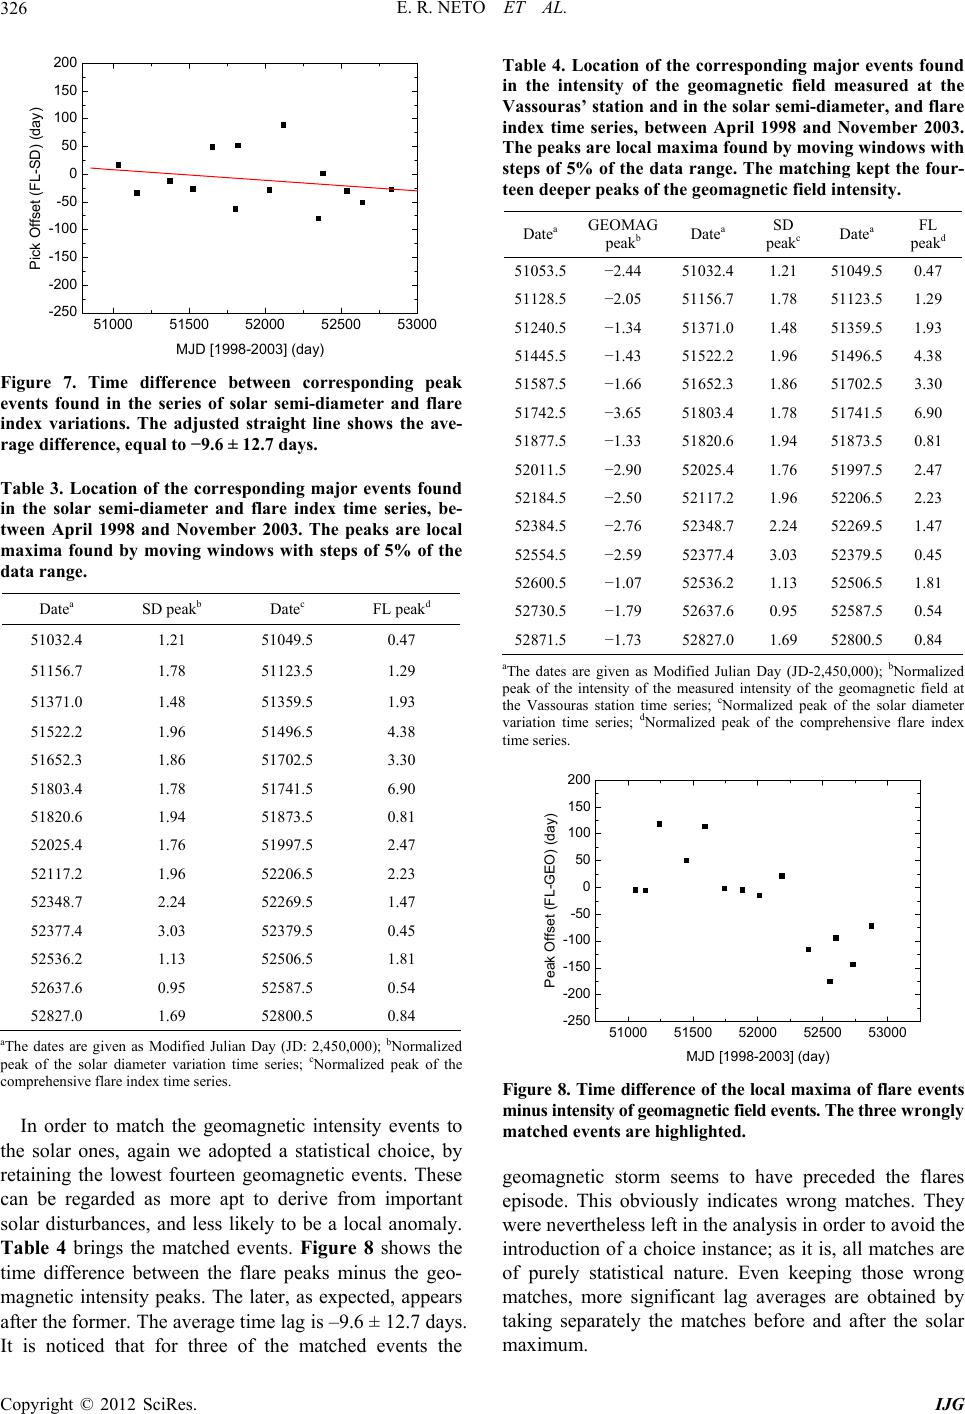 E. R. NETO ET AL. 326 51000 51500 52000 5 -250 -200 -150 -100 -50 0 50 100 150 200 2500 53000 Pick Offset (FL-SD) (day) MJD [1998-2003] (day) Figure 7. Time difference between corresponding peak events found in the series of solar semi-diameter and flare index variations. The adjusted straight line shows the ave- rage difference, equal to −9.6 ± 12.7 days. Table 3. Location of the corresponding major events found in the solar semi-diameter and flare index time series, be- tween April 1998 and November 2003. The peaks are local maxima found by moving windows with steps of 5% of the data range. Datea SD peakb Datec FL peakd 51032.4 1.21 51049.5 0.47 51156.7 1.78 51123.5 1.29 51371.0 1.48 51359.5 1.93 51522.2 1.96 51496.5 4.38 51652.3 1.86 51702.5 3.30 51803.4 1.78 51741.5 6.90 51820.6 1.94 51873.5 0.81 52025.4 1.76 51997.5 2.47 52117.2 1.96 52206.5 2.23 52348.7 2.24 52269.5 1.47 52377.4 3.03 52379.5 0.45 52536.2 1.13 52506.5 1.81 52637.6 0.95 52587.5 0.54 52827.0 1.69 52800.5 0.84 aThe dates are given as Modified Julian Day (JD: 2,450,000); bNormalized peak of the solar diameter variation time series; cNormalized peak of the comprehensive flare index time series. In order to match the geomagnetic intensity events to the solar ones, again we adopted a statistical choice, by retaining the lowest fourteen geomagnetic events. These can be regarded as more apt to derive from important solar disturbances, and less likely to be a local anomaly. Table 4 brings the matched events. Figure 8 shows the time difference between the flare peaks minus the geo- magnetic intensity peaks. The later, as expected, appears after the former. The average time lag is –9.6 ± 12.7 days. It is noticed that for three of the matched events the Table 4. Location of the corresponding major events found in the intensity of the geomagnetic field measured at the Vassouras’ station and in the solar semi-diameter, and flare index time series, between April 1998 and November 2003. The peaks are local maxima found by moving windows with steps of 5% of the data range. The matching kept the four- teen deeper peaks of the geomagnetic field intensity. Datea GEOMAG peakb Datea SD peakc Datea FL peakd 51053.5 −2.44 51032.4 1.21 51049.50.47 51128.5 −2.05 51156.7 1.78 51123.51.29 51240.5 −1.34 51371.0 1.48 51359.51.93 51445.5 −1.43 51522.2 1.96 51496.54.38 51587.5 −1.66 51652.3 1.86 51702.53.30 51742.5 −3.65 51803.4 1.78 51741.56.90 51877.5 −1.33 51820.6 1.94 51873.50.81 52011.5 −2.90 52025.4 1.76 51997.52.47 52184.5 −2.50 52117.2 1.96 52206.52.23 52384.5 −2.76 52348.7 2.24 52269.51.47 52554.5 −2.59 52377.4 3.03 52379.50.45 52600.5 −1.07 52536.2 1.13 52506.51.81 52730.5 −1.79 52637.6 0.95 52587.50.54 52871.5 −1.73 52827.0 1.69 52800.50.84 aThe dates are given as Modified Julian Day (JD-2,450,000); bNormalized peak of the intensity of the measured intensity of the geomagnetic field at the Vassouras station time series; cNormalized peak of the solar diameter variation time series; dNormalized peak of the comprehensive flare index time series. 51000 51500 52000 52500 53000 -250 -200 -150 -100 -50 0 50 100 150 200 Peak Offset (FL-GEO) (day) MJD [1998-2003] (day) Figure 8. Time difference of the local maxima of flare events minus intensity of geomagnetic field events. The three wrongly matched events are highlighted. geomagnetic storm seems to have preceded the flares episode. This obviously indicates wrong matches. They were nevertheless left in the analysis in order to avoid the introduction of a choice instance; as it is, all matches are of purely statistical nature. Even keeping those wrong matches, more significant lag averages are obtained by taking separately the matches before and after the solar maximum. Copyright © 2012 SciRes. IJG 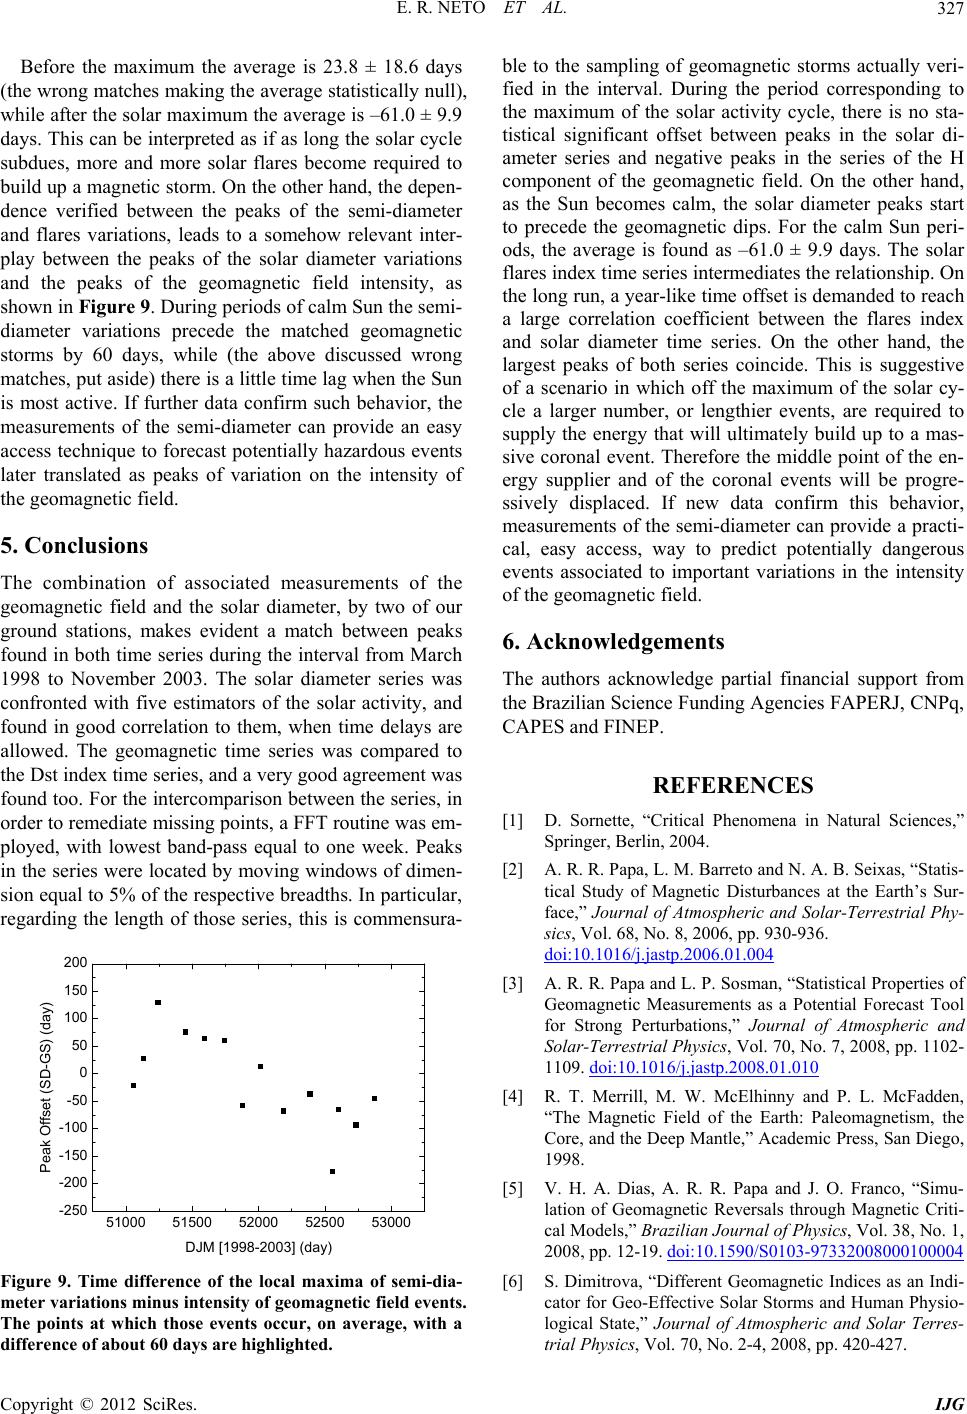 E. R. NETO ET AL. 327 Before the maximum the average is 23.8 ± 18.6 days (the wrong matches making the average statistically null), while after the solar maximum the average is –61.0 ± 9.9 days. This can be interpreted as if as long the solar cycle subdues, more and more solar flares become required to build up a magnetic storm. On the other hand, the depen- dence verified between the peaks of the semi-diameter and flares variations, leads to a somehow relevant inter- play between the peaks of the solar diameter variations and the peaks of the geomagnetic field intensity, as shown in Figure 9. During periods of calm Sun the semi- diameter variations precede the matched geomagnetic storms by 60 days, while (the above discussed wrong matches, put aside) there is a little time lag when the Sun is most active. If further data confirm such behavior, the measurements of the semi-diameter can provide an easy access technique to forecast potentially hazardous events later translated as peaks of variation on the intensity of the geomagnetic field. 5. Conclusions The combination of associated measurements of the geomagnetic field and the solar diameter, by two of our ground stations, makes evident a match between peaks found in both time series during the interval from March 1998 to November 2003. The solar diameter series was confronted with five estimators of the solar activity, and found in good correlation to them, when time delays are allowed. The geomagnetic time series was compared to the Dst index time series, and a very good agreement was found too. For the intercomparison between the series, in order to remediate missing points, a FFT routine was em- ployed, with lowest band-pass equal to one week. Peaks in the series were located by moving windows of dimen- sion equal to 5% of the respective breadths. In particular, regarding the length of those series, this is commensura- 51000 51500 52000 52 -250 -200 -150 -100 -50 0 50 100 150 200 500 53000 Peak Offset (SD-GS) (day) DJM [1998-2003] (day) Figure 9. Time difference of the local maxima of semi-dia- meter variations minus intensity of geomagnetic field events. The points at which those events occur, on average, with a difference of about 60 days are highlighted. ble to the sampling of geomagnetic storms actually veri- fied in the interval. During the period corresponding to the maximum of the solar activity cycle, there is no sta- tistical significant offset between peaks in the solar di- ameter series and negative peaks in the series of the H component of the geomagnetic field. On the other hand, as the Sun becomes calm, the solar diameter peaks start to precede the geomagnetic dips. For the calm Sun peri- ods, the average is found as –61.0 ± 9.9 days. The solar flares index time series intermediates the relationship. On the long run, a year-like time offset is demanded to reach a large correlation coefficient between the flares index and solar diameter time series. On the other hand, the largest peaks of both series coincide. This is suggestive of a scenario in which off the maximum of the solar cy- cle a larger number, or lengthier events, are required to supply the energy that will ultimately build up to a mas- sive coronal event. Therefore the middle point of the en- ergy supplier and of the coronal events will be progre- ssively displaced. If new data confirm this behavior, measurements of the semi-diameter can provide a practi- cal, easy access, way to predict potentially dangerous events associated to important variations in the intensity of the geomagnetic field. 6. Acknowledgements The authors acknowledge partial financial support from the Brazilian Science Funding Agencies FAPERJ, CNPq, CAPES and FINEP. REFERENCES [1] D. Sornette, “Critical Phenomena in Natural Sciences,” Springer, Berlin, 2004. [2] A. R. R. Papa, L. M. Barreto and N. A. B. Seixas, “Statis- tical Study of Magnetic Disturbances at the Earth’s Sur- face,” Journal of Atmospheric and Solar-Terrestrial Phy- sics, Vol. 68, No. 8, 2006, pp. 930-936. doi:10.1016/j.jastp.2006.01.004 [3] A. R. R. Papa and L. P. Sosman, “Statistical Properties of Geomagnetic Measurements as a Potential Forecast Tool for Strong Perturbations,” Journal of Atmospheric and Solar-Terrestrial Physics, Vol. 70, No. 7, 2008, pp. 1102- 1109. doi:10.1016/j.jastp.2008.01.010 [4] R. T. Merrill, M. W. McElhinny and P. L. McFadden, “The Magnetic Field of the Earth: Paleomagnetism, the Core, and the Deep Mantle,” Academic Press, San Diego, 1998. [5] V. H. A. Dias, A. R. R. Papa and J. O. Franco, “Simu- lation of Geomagnetic Reversals through Magnetic Criti- cal Models,” Brazilian Journal of Physics, Vol. 38, No. 1, 2008, pp. 12-19. doi:10.1590/S0103-97332008000100004 [6] S. Dimitrova, “Different Geomagnetic Indices as an Indi- cator for Geo-Effective Solar Storms and Human Physio- logical State,” Journal of Atmospheric and Solar Terres- trial Physics, Vol. 70, No. 2-4, 2008, pp. 420-427. Copyright © 2012 SciRes. IJG 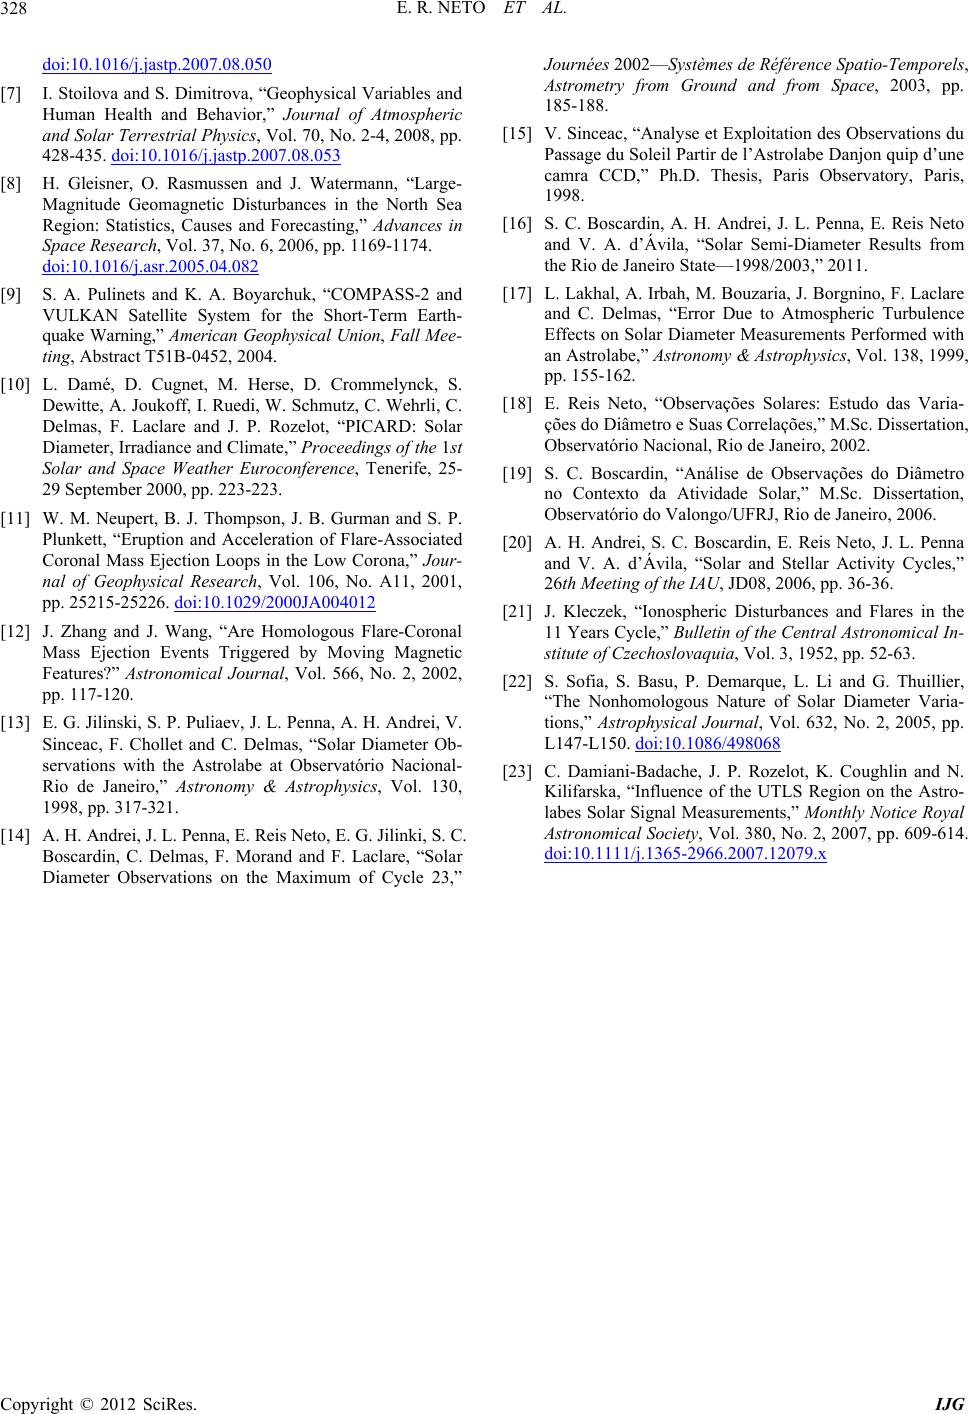 E. R. NETO ET AL. Copyright © 2012 SciRes. IJG 328 doi:10.1016/j.jastp.2007.08.050 [7] I. Stoilova and S. Dimitrova, “Geophysical Variables and Human Health and Behavior,” Journal of Atmospheric and Solar Terrestrial Physics, Vol. 70, No. 2-4, 2008, pp. 428-435. doi:10.1016/j.jastp.2007.08.053 [8] H. Gleisner, O. Rasmussen and J. Watermann, “Large- Magnitude Geomagnetic Disturbances in the North Sea Region: Statistics, Causes and Forecasting,” Advances in Space Research, Vol. 37, No. 6, 2006, pp. 1169-1174. doi:10.1016/j.asr.2005.04.082 [9] S. A. Pulinets and K. A. Boyarchuk, “COMPASS-2 and VULKAN Satellite System for the Short-Term Earth- quake Warning,” American Geophysical Union, Fall Mee- ting, Abstract T51B-0452, 2004. [10] L. Damé, D. Cugnet, M. Herse, D. Crommelynck, S. Dewitte, A. Joukoff, I. Ruedi, W. Schmutz, C. Wehrli, C. Delmas, F. Laclare and J. P. Rozelot, “PICARD: Solar Diameter, Irradiance and Climate,” Proceedings of the 1st Solar and Space Weather Euroconference, Tenerife, 25- 29 September 2000, pp. 223-223. [11] W. M. Neupert, B. J. Thompson, J. B. Gurman and S. P. Plunkett, “Eruption and Acceleration of Flare-Associated Coronal Mass Ejection Loops in the Low Corona,” Jour- nal of Geophysical Research, Vol. 106, No. A11, 2001, pp. 25215-25226. doi:10.1029/2000JA004012 [12] J. Zhang and J. Wang, “Are Homologous Flare-Coronal Mass Ejection Events Triggered by Moving Magnetic Features?” Astronomical Journal, Vol. 566, No. 2, 2002, pp. 117-120. [13] E. G. Jilinski, S. P. Puliaev, J. L. Penna, A. H. Andrei, V. Sinceac, F. Chollet and C. Delmas, “Solar Diameter Ob- servations with the Astrolabe at Observatório Nacional- Rio de Janeiro,” Astronomy & Astrophysics, Vol. 130, 1998, pp. 317-321. [14] A. H. Andrei, J. L. Penna, E. Reis Neto, E. G. Jilinki, S. C. Boscardin, C. Delmas, F. Morand and F. Laclare, “Solar Diameter Observations on the Maximum of Cycle 23,” Journées 2002—Systèmes de Référence Spatio-Temporels, Astrometry from Ground and from Space, 2003, pp. 185-188. [15] V. Sinceac, “Analyse et Exploitation des Observations du Passage du Soleil Partir de l’Astrolabe Danjon quip d’une camra CCD,” Ph.D. Thesis, Paris Observatory, Paris, 1998. [16] S. C. Boscardin, A. H. Andrei, J. L. Penna, E. Reis Neto and V. A. d’Ávila, “Solar Semi-Diameter Results from the Rio de Janeiro State—1998/2003,” 2011. [17] L. Lakhal, A. Irbah, M. Bouzaria, J. Borgnino, F. Laclare and C. Delmas, “Error Due to Atmospheric Turbulence Effects on Solar Diameter Measurements Performed with an Astrolabe,” Astronomy & Astrophysics, Vol. 138, 1999, pp. 155-162. [18] E. Reis Neto, “Observações Solares: Estudo das Varia- ções do Diâmetro e Suas Correlações,” M.Sc. Dissertation, Observatório Nacional, Rio de Janeiro, 2002. [19] S. C. Boscardin, “Análise de Observações do Diâmetro no Contexto da Atividade Solar,” M.Sc. Dissertation, Observatório do Valongo/UFRJ, Rio de Janeiro, 2006. [20] A. H. Andrei, S. C. Boscardin, E. Reis Neto, J. L. Penna and V. A. d’Ávila, “Solar and Stellar Activity Cycles,” 26th Meeting of the IAU, JD08, 2006, pp. 36-36. [21] J. Kleczek, “Ionospheric Disturbances and Flares in the 11 Years Cycle,” Bulletin of the Central Astronomical In- stitute of Czechoslovaquia, Vol. 3, 1952, pp. 52-63. [22] S. Sofia, S. Basu, P. Demarque, L. Li and G. Thuillier, “The Nonhomologous Nature of Solar Diameter Varia- tions,” Astrophysical Journal, Vol. 632, No. 2, 2005, pp. L147-L150. doi:10.1086/498068 [23] C. Damiani-Badache, J. P. Rozelot, K. Coughlin and N. Kilifarska, “Influence of the UTLS Region on the Astro- labes Solar Signal Measurements,” Monthly Notice Royal Astronomical Society, Vol. 380, No. 2, 2007, pp. 609-614. doi:10.1111/j.1365-2966.2007.12079.x
|