 International Journal of Geosciences, 2012, 3, 289-296 http://dx.doi.org/10.4236/ijg.2012.32030 Published Online May 2012 (http://www.SciRP.org/journal/ijg) Early Proterozoic U-Pb Zirc on Ages from Basement Gneiss at the Solovetsky Archipelago, White Sea, Russia Stephan Schuth1*, Victor I. Gornyy2, Jasper Berndt3, Sergei S. Shevchenko4, Sergei A. Sergeev4, Alexandr F. Karpuzov5, Tim Mansfeldt1 1Geographisches Institut, Bodengeographie/Bodenkunde, University of Cologne, Cologne, Germany 2Scientific Research Center for Ecological Safety, Russian Academy of Sciences, Saint-Petersburg, Russia 3Institut für Mineralogie, Westfälische Wilhelms-Universität Münster, Münster, Germany 4A. P. Karpinsky Russian Geological Research Institute (VSEGEI), Saint-Petersburg, Russia 5Federal Agency of Mineral Resources, Moscow, Russia Email: *s.schuth@mineralogie.uni-hannover.de, v.i.gornyy@mail.ru, jberndt@uni-muenster.de, Sergey_Shevchenko@vsegei.ru, karpuzov@rosnedra.com Received December 5, 2011; revised January 25, 2012; accepted February 24, 2012 ABSTRACT The central region of the Neoarchaean Belomorian Mobile Belt (BMB) is, except for the Solovetsky Archipelago, largely covered by the White Sea. A newly discovered granitic gneiss outcrop on Solovetsky Island, Russia, enables a first age determination of the archipelago and evaluation of the hitherto poorly constrained central BMB. Zircons sepa- rated from the orthogneiss were analysed with SIMS-SHRIMP and LA-ICP-MS techniques. Both techniques yield a concordant U-Pb age of ca. 2.430 Ga, coinciding with ages of granitic intrusions in the BMB ca. 50 km west of the So- lovetsky Islands. Keywords: Solovetsky Archipelago; Granitic Gneiss Outcrop; Age Determination; 2.430 Ga 1. Introduction The Neoarchaean to Palaeoproterozoic Belomorian Mo- bile Belt (BMB) forms a SW-NE trending belt of mostly metamorphic rocks, which extends from northern Finland to the southern region of the Arkhangelsk Oblast in the Russian Federation (see e.g. [1], and inset of Figure 1). Located to the NE is the Neoarchaean Murmansk Craton (comprising granodioritic and trondhjemitic orthognei- sses), and the Kola Province (TTG-type orthogneisses of Neoarchaean age). In the SW, the BMB borders the greenstone-granite domain of the Neoarchaean Karelian Craton (e.g. [2]). The central area of the BMB is, except for the Solovetsky Archipelago, largely covered by the White Sea, making access to rocks a difficult task. The BMB consists of abundant TTG-type rocks (age ca. 2.9 Ga), and metavolcanic rocks of an age of ca. 1.9 Ga (e.g. [2-4]). The latter are associated with metasediments and a younger suite of granitic and gabbroic intrusions. More- over, it was inferred that ca. 2.4 Ga old plutonic bodies are present in the BMB in significant proportions [4]. The Archaean units of the BMB were partially re- worked during the Palaeoproterozoic Lapland-Kola col- lisional event ca. 1.9 Gyrs ago (e.g. [1,2], and references therein). Rifting at the Kandalaksha-Dvina aulacogen crossing the western White Sea in SE-NW direction from the eastern Onega Peninsula to the Kandalaksha Bay started possibly in the late Palaeoproterozoic [1]. The aulacogen is segmented into grabens and horsts by seve- ral mostly WSW-ENE trending fault systems [5]. The oldest deposits in the grabens are volcanoclastic sediments, basic flows, and tuffs with a suggested age of ca. 1.8 - 1.4 Ga [5]. A simplified geological map is illustrated in the inset in Figure 1. A more detailed map and descrip- tion of the BMB and Karelia is given by [6]. The Solovetsky Archipelago is located in the western White Sea, about 50 km east of the city of Kem’ in Kare- lia and ca. 30 km NW of the Onega Peninsula (Figure 1). The island group consists of six large and several smaller islands with Bolshoi (Big) Solovetsky Island being the largest. About 50 km east of the archipelago, the Kan- dalaksha-Dvina aulacogen traverses the White Sea from SE to NW. The first geological map (scale 1:200,000) of the ar- chipelago was produced by [7], a section showing lith- ologies of the islands and the western coast of the White Sea is given in Figure 1. The islands are covered by gla- cial deposits derived most likely from the Kola Peninsula and the north-western areas of the BMB. The last glacia- tion of the archipelago occurred in the late Pleistocene *Corresponding author. C opyright © 2012 SciRes. IJG  S. SCHUTH ET AL. 290 Figure 1. Simplified tectonic and geological overview of the White Sea region and the Solovetsky Archipelago. The inset shows the boundaries of the different provinces in NE Fennoscandia (modified after [2]). I. T.: Inari Terrane; K. U. T. B.: Kolvitsa-Umba-Tersk Belt; L. G. B.: Lapland Granulite Belt; M. C.: Murmansk Craton; S. T.: Strelna Terrane; K.-D.: Kan- dalaksha-Dvina aulacogen (solid grey line); S. I.: Solovetsky Islands. The map shows strata of the Belomorian Mobile Belt around the city of Kem’ and the Solovetsky Islands (after [7]). Bolshoi (Big) Solovetsky Island is characterized by numerous lakes of different sizes and glacial deposits. The sample location at the slope of the Sekirnaya Hill is shown by the black dot. during the Valdai glaciation (e.g. [8]). A Neoarchaean basement (labelled “Bottom Strata” in Figure 1) with an age of ca. 2.6 - 2.2 Ga was suggested by [7] to be present beneath the islands. Moreover, the archipelago is directly located on two WSW-ENE trending zones marked by local late Archaean granitic intrusions [7]. In addition, gravimetric, seismic, and geoelectrical data recorded on Bolshoi Solovetsky by [9] revealed that the crust is thin- nest (ca. 28 km) in comparison to the surrounding area, and a mantle diapir of unkown age is situated beneath the islands. Devonian magmatic activity in the western White Sea region was likely initiated by an upwelling mantle plume, as suggested by [10], and [11] on the base of tec- tonic interpretation of satellite images. This triggered an uplift of the area and may still support present-day weak local positive thermal anomalies observed in lakes and soils, and formation of an extrazonal thermophilic eco- system on Bolshoi Solovetsky Island [12,13]. In July 2009, a group of Russian and German geolo- gists and geophysicists discovered on this island a gneiss outcrop which is probably related to the BMB. The out- crop (ca. 7.5 × 5 m) is located at the lower flanks of Se- kirnaya Hill in the north-western part of the island (Fig- ure 1). It consists of relatively fresh granitic gneiss. Other lithologies were not found in the outcrop. This pro- vides an opportunity of a first age determination of the basement of the archipelago and, in a broader context, may help to elucidate the geological evolution of the cen- tral region of the BMB. The orthogneiss was dated via the U-Pb zircon dating method employed to two different instrumental techniques (SIMS-SHRIMP and LA-ICP- MS). 2. Methods The orthogneiss sample (labelled “R1”) from Bolshoi Solovetsky Island was sawed into smaller pieces for thin section preparation, crushing in a jaw breaker and steel Copyright © 2012 SciRes. IJG  S. SCHUTH ET AL. 291 mortar. From the crushed sample, a part was ground to powder for X-ray Fluorescence (XRF) analysis employ- ing an ARL 9800 instrument at VSEGEI. The XRF data were further processed via CIPW norm for sample classi- fication. Another representative portion of the crushed material was used for separation of accessory zircon which was required for comparative age determination in different laboratories using SIMS (Secondary Ion Mass-Spectro- metry) by Sensitive High-Resolution Ion Micro Probe (SHRIMP-II, at the Centre of Isotopic Research of VSE- GEI, St. Petersburg, Russia) and Laser Ablation-Sector Field-Inductively Coupled Plasma-Mass Spectrometry technique (LA-SF-ICP-MS, at the Institute for Mineralo- gy, University of Münster, Germany), respectively. In addition of dating a hitherto unknown outcrop in a geolo- gically complex region, the two involved institutions were able to compare their respective techniques by us- ing well-defined standards and unknown zircons. The se- paration procedures employed in the Russian and Ger- man laboratories are given in Table 1. For analyses, selected zircon grains were mounted in Pb-free epoxy resin together with the TEMORA 1, GJ-1, and/or 91500 reference zircons. The grains were sectioned approximately in half, polished and coated. Cathodolu- minescence (CL) images were used to reveal the internal structures of the zircon grains and thereby define target areas within them. The technical methods applied in the different institutions are given in Table 1. 2.1. SHRIMP Analyses The results were obtained with a secondary electron mul- tiplier operated in peak-jumping mode, as outlined by [14]. A primary beam of molecular oxygen was em- ployed to bombard the zircons in order to extract secon- dary ions. A 70 μm Kohler aperture allowed focusing of the primary beam so that the ellipse-shaped analytical spot had a size ca 25 × 20 μm. The sputtered secondary ions were accelerated at 10 kV. A mass-resolution of M/ΔM ≥ 5000 (1% valley definition) was achieved via an 80 µm wide slit of the secondary ion source combined with a 100 µm multiplier slit; thus, all possible isobaric interferences were resolved. Rastering for one minute over a rectangular area of ca. 65 × 50 μm before each analysis removed the gold coating and any possible sur- face common-Pb contamination. The ion species of interest were measured in a se- quence as follows: 196(Zr2O)-204Pb-background (ca. 204 a.m.u.)-206Pb-207Pb-208Pb-238U-248ThO-254UO with in- tegration times ranging from 2 s to 14 s. Seven cycles for each analyzed spot were acquired. Apart from “unknown” zircons, each fourth measurement was carried out on the zircon Pb/U standard TEMORA 1, which has an ac- Table 1. The table lists the different analytical techniques used for this study. Technique by country Germany Russia Separation technique Hand magnet, sieving, CH2I2 heavy liquid, Frantz magnetic separator, hand-picking1 Sieving, separation table, CH2I2 heavy liquid, Frantz magnetic separator, hand-picking3 Grain fraction used63 - 125 µm 100 - 150 µm Microprobe/SEM for CL images JEOL JXA 82001 CamScan MX 25003 Coating, voltage, and current Carbon, 15 kV, 15 nA Gold, 15 kV, 10 nA Analytical technique LA-SF-ICP-MS SIMS-SHRIMP Instrument Thermo-Finnigan Element 22 SHRIMP-II3 Beam type New Wave ArF Excimer laser2 2 O, 5 nA Energy ca. 5 Jcm−2 10 kV (2nd acceleration) Spot size (number of analyses) 35 µm (n = 92), 25 µm (n = 23) ellipse 20 × 25 µm Analysis time per spot 20 ns (pulse), 10 Hz (repetition) ca. 6 min Number of analyses115 10 Discarded results17 0 Analyses ≥ 95% concordance 70 10 Reference zircons91500 91500 U-Pb age of 915001072 Ma ± 11 Ma (2σ, n = 5) 1066 Ma ±7 Ma (2σ, n = 6) U-Pb zircon age of R1 2429.1 Ma ± 9.3 Ma (2σ) 2433 Ma ± 13 Ma (2σ) MSWD 5.5 0.089 1Steinmann Institute at University of Bonn; 2Institute of Mineralogy at Uni- versity of Münster; 3A. P. Karpinsky Russian Geological Research Institute (VSEGEI), St. Petersburg. cepted 206Pb/238U age of 416.75 ± 0.24 Ma [15]. The 91500 zircon standard (U = 81.2 ppm, 206Pb/238U age = 1062.4 ± 0.4 Ma; [16]) was applied as a U-concentration standard. The Pb-U ratios have been normalized relative to a value of 0.0668 for 206Pb/238U of the TEMORA 1 reference zircons. Error in TEMORA standard calibration was 0.62%. The results were then processed with the SQUID 1.02 (see [17]) and Isoplot/Ex 3.00 (see [18]) software, using the decay constants of [19]. The common Pb correction was done on the basis of measured 204Pb and present-day Pb isotope composition, according to the model of [20]. 2.2. LA-ICP-MS Analyses The U-Pb age determinations were done using a LA-SF- ICP mass spectrometer (Element 2, ThermoFinnigan) and a New Wave ArF Excimer Laser system at Univer- Copyright © 2012 SciRes. IJG  S. SCHUTH ET AL. 292 sity of Münster, Germany. Forward power was 1330 W, gas flow rates were about 0.7 L/min for He (employed as carrier gas for ablated material), and 0.9 L/min and 1 L/min for the Ar auxiliary and sample gas, respectively. The cooling gas flow rate was set to 16 L/min. Before starting the analyses, the system has been tuned on the standard reference material SRM 612 from the NIST (National Institute of Standards and Technology) by measuring 139La, 232Th, and 232Th16O to get stable signals and a high sensitivity on 139La and 232Th peaks, as well as low oxide rates (232Th16O/232Th ~ 0.1%) during ablation. The repetition rate was 10 Hz at an energy of ~5 J/cm2. The typical spot size was 35 µm, in some cases also 25 µm. For U-Pb analyses of the zircons, the masses 204Pb, 206Pb, 207Pb, and 238U were measured. In addition, 202Hg was analyzed to correct the interference of 204Hg on 204Pb, which is important to apply, if necessary, for a common- Pb correction. The common Pb proportion for the indi- vidual spots is calculated from the 204Hg-corrected 204Pb signal, applying the two-stage model of [20]. When the contribution of estimated common 206Pb to the total 206Pb exceeded 1%, which corresponds approximately to the analytical uncertainty of the measured Pb isotope ratios, a common Pb correction was applied. Ten unknown sam- ples were bracketed with three calibration standards (GJ- 1; [21]) to correct for instrumental mass bias. The sensi- tivity for measured Pb and U isotopes for a 35 μm spot was typically in the range of 4000 cps/ppm. Age calcula- tions were done with an in-house Microsoft® Excel spreadsheet using the intercept method (e.g. [22]) to cor- rect for elemental fractionation during laser analyses. Along with the samples, the 91500 zircon standard was measured to monitor accuracy and precision of the ana- lyses. A three-shot pre-ablation was applied to all spots to remove the carbon coating and potential common Pb contamination from the surface. Out of 111 embedded zircons, 98 were selected for analyses after inspection of CL images. Cracks and inclusions were avoided. In total, 115 measurements were carried out. 3. Results 3.1. Petrography Sample R1 is a medium-grained foliated granitic gneiss with abundant orthoclase and amphibole. Hand specimen and thin section inspection yielded a composition of ca. 45 vol% of feldspar, 25 vol% of amphibole, 25 vol% of quartz, ca. 5 vol% biotite, and accessory phases like gar- net, apatite, zircon, and opaque phases. Results of XRF analyses are given in Table 2, classifying the sample as an acid alkaline rock because of its high silica and alkali content. As illustrated in Figure 2, ternary classification schemes after [23] and [24] indicate (syeno-)granite Table 2. Major element composition of the gneiss sample (XRF data). tTotal iron as Fe2O3. LOI: Loss on ignition. wt% wt% SiO2 67.0 CaO 3.13 Al2O3 12.3 Na2O 2.59 TiO2 1.33 K2O 4.22 Fe2O3t 7.11 P2O5 0.37 MnO 0.10 LOI 0.43 MgO 1.31 Sum 99.9 (b) (a) Figure 2. Classification of the gneiss R1 after [23] (a), and [24] (b), respectively. Proportions of albite (Ab), anorthite (An), orthoclase (Or), alkali feldspar (A, Afsp), quartz (Q, Qtz), and plagioclase (P) were calculated after the CIPW norm. Both schemes suggest a granite precursor rock. as a precursor rock for R1. Therefore, R1 is classified as an orthogneiss (metasyenogranite). In addition, low MgO- CaO (0.42) and high P2O5-TiO2 (0.28) ratios suggest a magmatic origin of the precursor rock [25]. The zircons are largely present as short prismatic and prismatic crystals with a length-wide ratio of ca. 1.5 to 3. Facets of prisms and pyramids are distinct, but show sometimes signs of chemical corrosion. Small, sporadic mineral and gas-liquid inclusions are observed under a binocular. In addition, the zircons of R1 often show well developed oscillatory zoning, which is sometimes present as sector zoning and is considered a typical feature of magmatic zircons (e.g. [26], and references therein). Some examples are shown as CL images in Figure 3. 3.2. SHRIMP Results All ten in situ U-Pb isotopic analyses on eight typical zircon grains, free of cracks and inclusions, gave a well- defined concordant age. The results of the zircon analy- ses are shown in Table 3 and Figure 4(a). During the course of this study, the 91500 standard zircon yielded a 207Pb/206Pb age of 1066 ± 7 Ma (n = 6). The zircons are characterized by an average Th-U ratio scattering around 0.77, and low contents of uranium (average 47 ppm), and thorium (average 36 ppm). Concentrations of non-radio- Copyright © 2012 SciRes. IJG 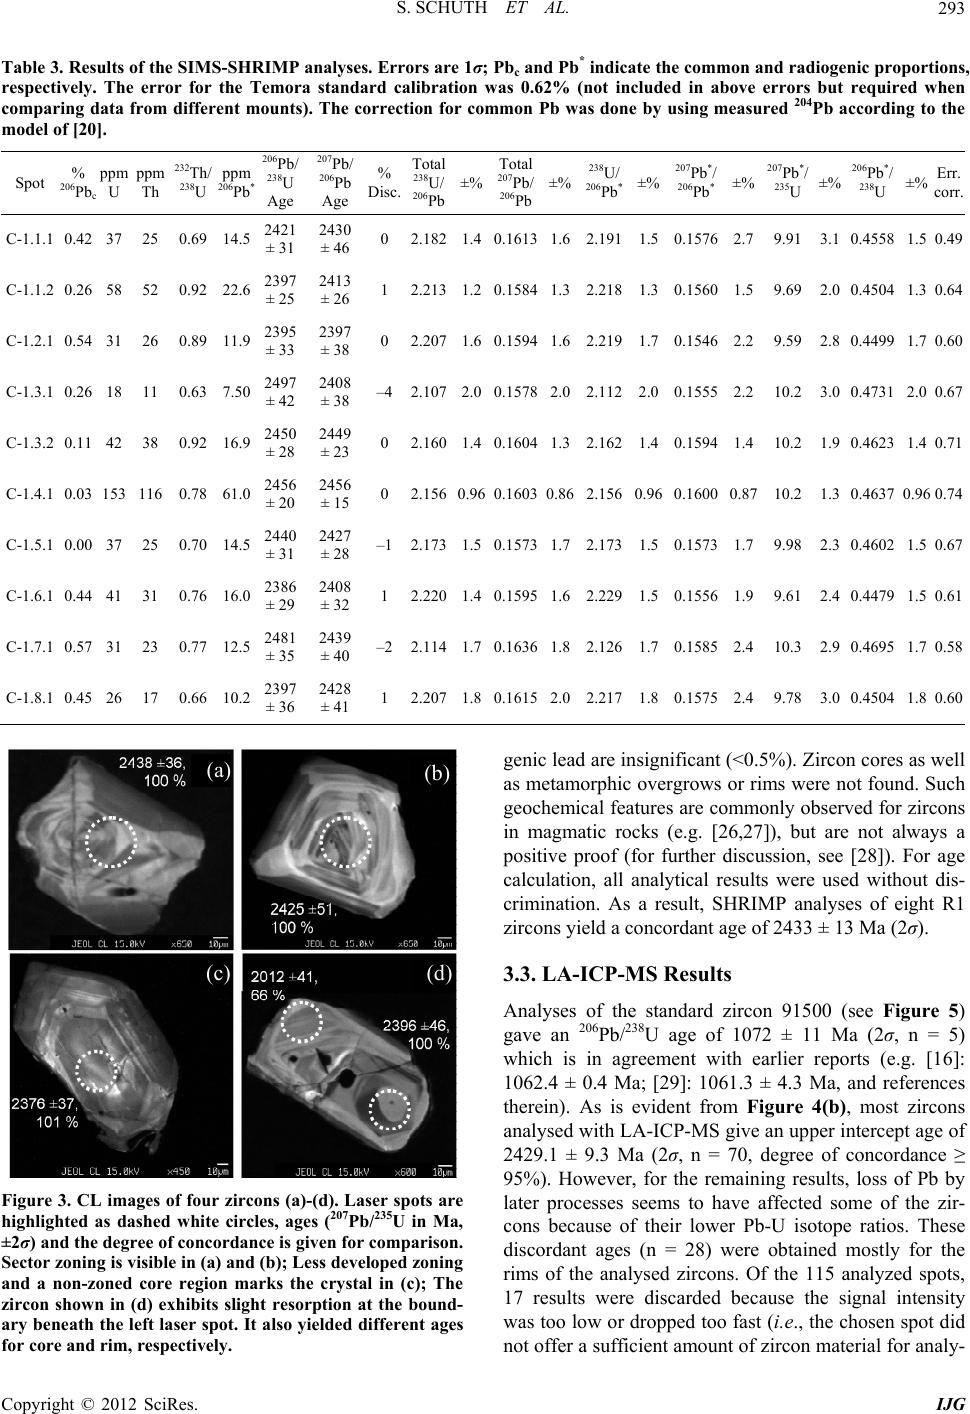 S. SCHUTH ET AL. Copyright © 2012 SciRes. IJG 293 Table 3. Results of the SIMS-SHRIMP analyses. Errors are 1σ; Pbc and Pb* indicate the common and radiogenic proportions, respectively. The error for the Temora standard calibration was 0.62% (not included in above errors but required when comparing data from different mounts). The correction for common Pb was done by using measured 204Pb according to the model of [20]. Spot % 206Pbc ppm U ppm Th 232Th/ 238U ppm 206Pb* 206Pb/ 238U Age 207Pb/ 206Pb Age % Disc. Total 238U/ 206Pb ±% Total 207Pb/ 206Pb ±% 238U/ 206Pb*±% 207Pb*/ 206Pb*±% 207Pb*/ 235U ±% 206Pb*/ 238U±% Err. corr. C-1.1.1 0.42 37 25 0.69 14.52421 ± 31 2430 ± 46 02.1821.40.16131.62.1911.50.15762.7 9.91 3.1 0.45581.50.49 C-1.1.2 0.26 58 52 0.92 22.62397 ± 25 2413 ± 26 12.2131.20.15841.32.2181.30.15601.5 9.69 2.0 0.45041.30.64 C-1.2.1 0.54 31 26 0.89 11.92395 ± 33 2397 ± 38 02.2071.60.15941.62.2191.70.15462.2 9.59 2.8 0.44991.70.60 C-1.3.1 0.26 18 11 0.63 7.502497 ± 42 2408 ± 38 –42.1072.00.15782.02.1122.00.15552.2 10.2 3.0 0.47312.00.67 C-1.3.2 0.11 42 38 0.92 16.92450 ± 28 2449 ± 23 02.1601.40.16041.32.1621.40.15941.4 10.2 1.9 0.46231.40.71 C-1.4.1 0.03 153 116 0.78 61.02456 ± 20 2456 ± 15 02.1560.960.16030.862.1560.960.16000.87 10.2 1.3 0.46370.960.74 C-1.5.1 0.00 37 25 0.70 14.52440 ± 31 2427 ± 28 –12.1731.5 0.1573 1.72.1731.50.15731.7 9.98 2.3 0.46021.50.67 C-1.6.1 0.44 41 31 0.76 16.02386 ± 29 2408 ± 32 12.2201.40.15951.62.2291.50.15561.9 9.61 2.4 0.44791.50.61 C-1.7.1 0.57 31 23 0.77 12.52481 ± 35 2439 ± 40 –22.1141.70.16361.82.1261.70.15852.4 10.3 2.9 0.46951.70.58 C-1.8.1 0.45 26 17 0.66 10.22397 ± 36 2428 ± 41 12.2071.80.16152.02.2171.80.15752.4 9.78 3.0 0.45041.80.60 genic lead are insignificant (<0.5%). Zircon cores as well as metamorphic overgrows or rims were not found. Such geochemical features are commonly observed for zircons in magmatic rocks (e.g. [26,27]), but are not always a positive proof (for further discussion, see [28]). For age calculation, all analytical results were used without dis- crimination. As a result, SHRIMP analyses of eight R1 zircons yield a concordant age of 2433 ± 13 Ma (2σ). (a) (b) (c) (d) 3.3. LA-ICP-MS Results Analyses of the standard zircon 91500 (see Figure 5) gave an 206Pb/238U age of 1072 ± 11 Ma (2σ, n = 5) which is in agreement with earlier reports (e.g. [16]: 1062.4 ± 0.4 Ma; [29]: 1061.3 ± 4.3 Ma, and references therein). As is evident from Figure 4(b), most zircons analysed with LA-ICP-MS give an upper intercept age of 2429.1 ± 9.3 Ma (2σ, n = 70, degree of concordance ≥ 95%). However, for the remaining results, loss of Pb by later processes seems to have affected some of the zir- cons because of their lower Pb-U isotope ratios. These discordant ages (n = 28) were obtained mostly for the rims of the analysed zircons. Of the 115 analyzed spots, 17 results were discarded because the signal intensity was too low or dropped too fast (i.e., the chosen spot did not offer a sufficient amount of zircon material for analy- Figure 3. CL images of four zircons (a)-(d). Laser spots are highlighted as dashed white circles, ages (207Pb/235U in Ma, ±2σ) and the degree of concordance is given for comparison. Sector zoning is visible in (a) and (b); Less developed zoning and a non-zoned core region marks the crystal in (c); The zircon shown in (d) exhibits slight resorption at the bound- ary beneath the left laser spot. It also yielded different ages for core and rim, respectively. 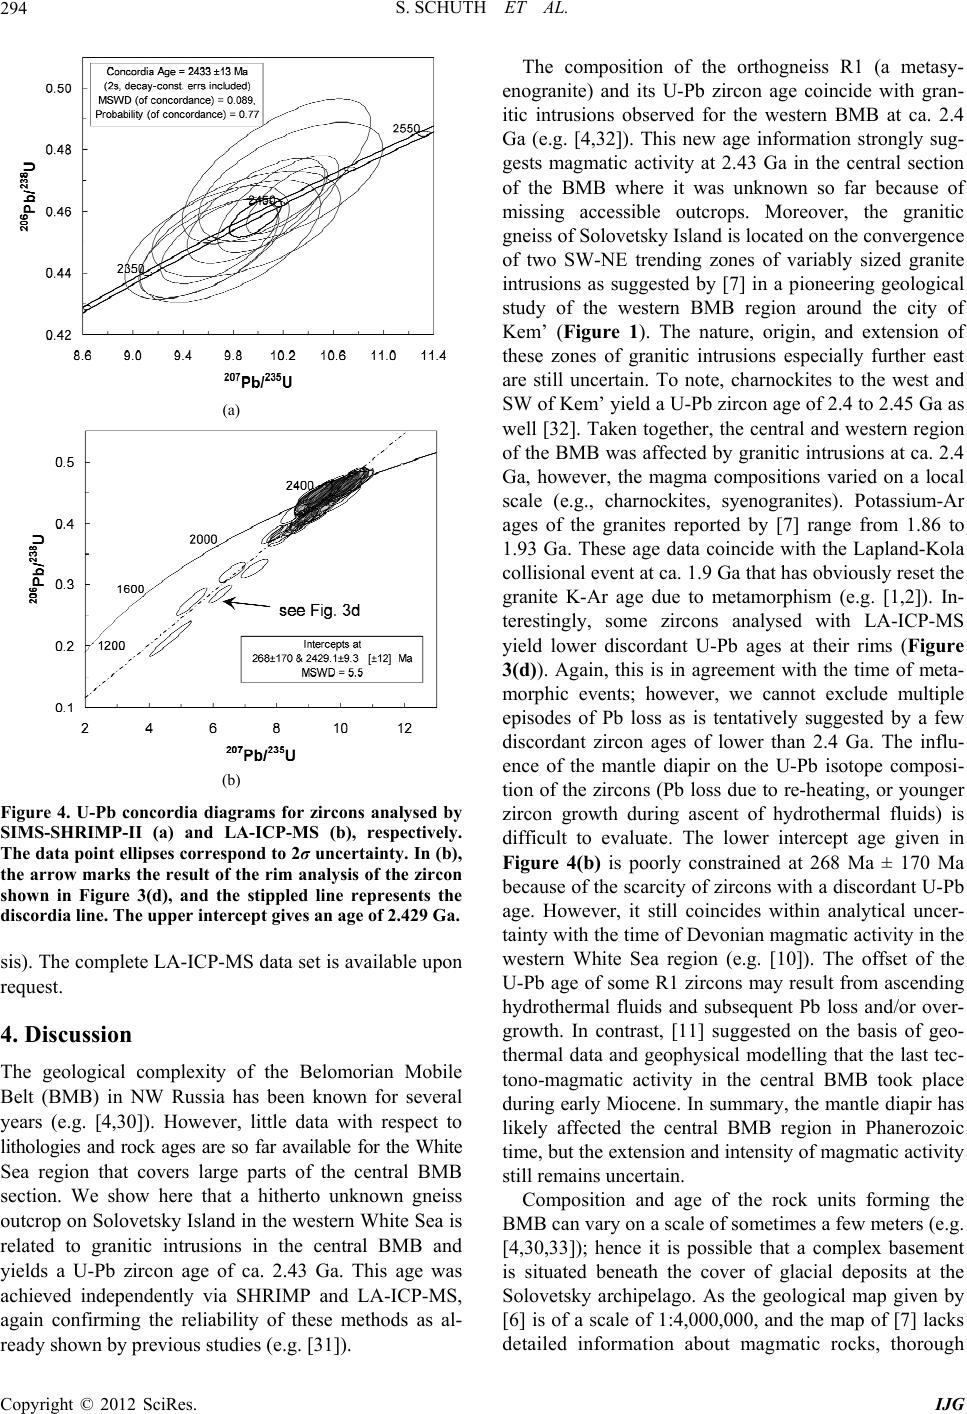 S. SCHUTH ET AL. 294 (a) (b) Figure 4. U-Pb concordia diagrams for zircons analysed by SIMS-SHRIMP-II (a) and LA-ICP-MS (b), respectively. The data point ellipses correspond to 2σ uncertainty. In (b), the arrow marks the result of the rim analysis of the zircon shown in Figure 3(d), and the stippled line represents the discordia line. The upper intercept gives an age of 2.429 Ga. sis). The complete LA-ICP-MS data set is available upon request. 4. Discussion The geological complexity of the Belomorian Mobile Belt (BMB) in NW Russia has been known for several years (e.g. [4,30]). However, little data with respect to lithologies and rock ages are so far available for the White Sea region that covers large parts of the central BMB section. We show here that a hitherto unknown gneiss outcrop on Solovetsky Island in the western White Sea is related to granitic intrusions in the central BMB and yields a U-Pb zircon age of ca. 2.43 Ga. This age was achieved independently via SHRIMP and LA-ICP-MS, again confirming the reliability of these methods as al- ready shown by previous studies (e.g. [31]). The composition of the orthogneiss R1 (a metasy- enogranite) and its U-Pb zircon age coincide with gran- itic intrusions observed for the western BMB at ca. 2.4 Ga (e.g. [4,32]). This new age information strongly sug- gests magmatic activity at 2.43 Ga in the central section of the BMB where it was unknown so far because of missing accessible outcrops. Moreover, the granitic gneiss of Solovetsky Island is located on the convergence of two SW-NE trending zones of variably sized granite intrusions as suggested by [7] in a pioneering geological study of the western BMB region around the city of Kem’ (Figure 1). The nature, origin, and extension of these zones of granitic intrusions especially further east are still uncertain. To note, charnockites to the west and SW of Kem’ yield a U-Pb zircon age of 2.4 to 2.45 Ga as well [32]. Taken together, the central and western region of the BMB was affected by granitic intrusions at ca. 2.4 Ga, however, the magma compositions varied on a local scale (e.g., charnockites, syenogranites). Potassium-Ar ages of the granites reported by [7] range from 1.86 to 1.93 Ga. These age data coincide with the Lapland-Kola collisional event at ca. 1.9 Ga that has obviously reset the granite K-Ar age due to metamorphism (e.g. [1,2]). In- terestingly, some zircons analysed with LA-ICP-MS yield lower discordant U-Pb ages at their rims (Figure 3(d)). Again, this is in agreement with the time of meta- morphic events; however, we cannot exclude multiple episodes of Pb loss as is tentatively suggested by a few discordant zircon ages of lower than 2.4 Ga. The influ- ence of the mantle diapir on the U-Pb isotope composi- tion of the zircons (Pb loss due to re-heating, or younger zircon growth during ascent of hydrothermal fluids) is difficult to evaluate. The lower intercept age given in Figure 4(b) is poorly constrained at 268 Ma ± 170 Ma because of the scarcity of zircons with a discordant U-Pb age. However, it still coincides within analytical uncer- tainty with the time of Devonian magmatic activity in the western White Sea region (e.g. [10]). The offset of the U-Pb age of some R1 zircons may result from ascending hydrothermal fluids and subsequent Pb loss and/or over- growth. In contrast, [11] suggested on the basis of geo- thermal data and geophysical modelling that the last tec- tono-magmatic activity in the central BMB took place during early Miocene. In summary, the mantle diapir has likely affected the central BMB region in Phanerozoic time, but the extension and intensity of magmatic activity still remains uncertain. Composition and age of the rock units forming the BMB can vary on a scale of sometimes a few meters (e.g. [4,30,33]); hence it is possible that a complex basement is situated beneath the cover of glacial deposits at the Solovetsky archipelago. As the geological map given by [6] is of a scale of 1:4,000,000, and the map of [7] lacks detailed information about magmatic rocks, thorough Copyright © 2012 SciRes. IJG 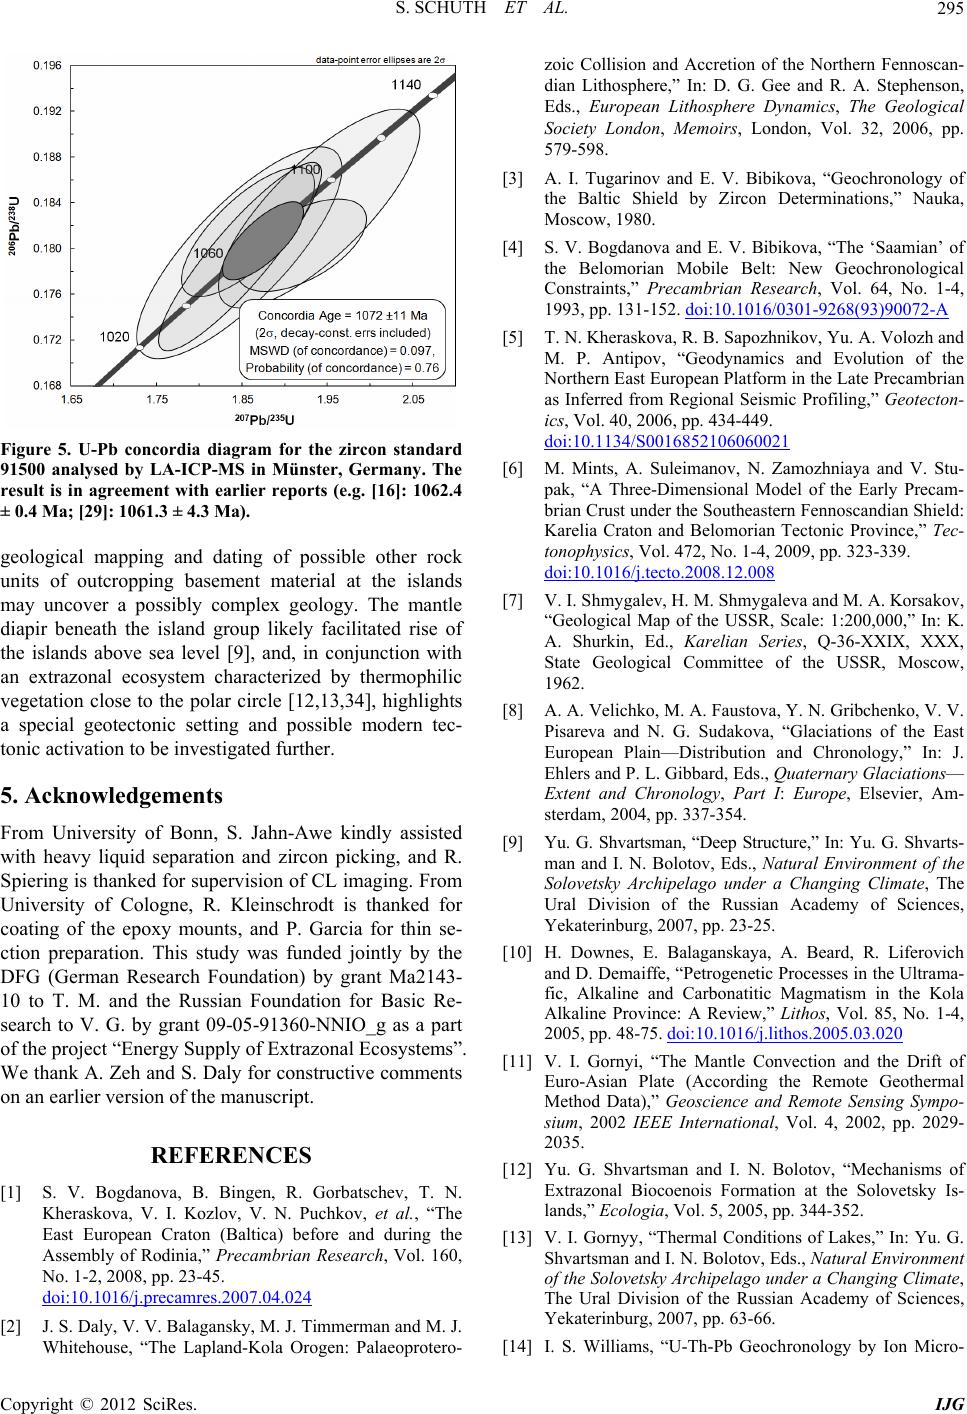 S. SCHUTH ET AL. 295 Figure 5. U-Pb concordia diagram for the zircon standard 91500 analysed by LA-ICP-MS in Münster, Germany. The result is in agreement with earlier reports (e.g. [16]: 1062.4 ± 0.4 Ma; [29]: 1061.3 ± 4.3 Ma). geological mapping and dating of possible other rock units of outcropping basement material at the islands may uncover a possibly complex geology. The mantle diapir beneath the island group likely facilitated rise of the islands above sea level [9], and, in conjunction with an extrazonal ecosystem characterized by thermophilic vegetation close to the polar circle [12,13,34], highlights a special geotectonic setting and possible modern tec- tonic activation to be investigated further. 5. Acknowledgements From University of Bonn, S. Jahn-Awe kindly assisted with heavy liquid separation and zircon picking, and R. Spiering is thanked for supervision of CL imaging. From University of Cologne, R. Kleinschrodt is thanked for coating of the epoxy mounts, and P. Garcia for thin se- ction preparation. This study was funded jointly by the DFG (German Research Foundation) by grant Ma2143- 10 to T. M. and the Russian Foundation for Basic Re- search to V. G. by grant 09-05-91360-NNIO_g as a part of the project “Energy Supply of Extrazonal Ecosystems”. We thank A. Zeh and S. Daly for constructive comments on an earlier version of the manuscript. REFERENCES [1] S. V. Bogdanova, B. Bingen, R. Gorbatschev, T. N. Kheraskova, V. I. Kozlov, V. N. Puchkov, et al., “The East European Craton (Baltica) before and during the Assembly of Rodinia,” Precambrian Research, Vol. 160, No. 1-2, 2008, pp. 23-45. doi:10.1016/j.precamres.2007.04.024 [2] J. S. Daly, V. V. Balagansky, M. J. Timmerman and M. J. Whitehouse, “The Lapland-Kola Orogen: Palaeoprotero- zoic Collision and Accretion of the Northern Fennoscan- dian Lithosphere,” In: D. G. Gee and R. A. Stephenson, Eds., European Lithosphere Dynamics, The Geological Society London, Memoirs, London, Vol. 32, 2006, pp. 579-598. [3] A. I. Tugarinov and E. V. Bibikova, “Geochronology of the Baltic Shield by Zircon Determinations,” Nauka, Moscow, 1980. [4] S. V. Bogdanova and E. V. Bibikova, “The ‘Saamian’ of the Belomorian Mobile Belt: New Geochronological Constraints,” Precambrian Research, Vol. 64, No. 1-4, 1993, pp. 131-152. doi:10.1016/0301-9268(93)90072-A [5] T. N. Kheraskova, R. B. Sapozhnikov, Yu. A. Volozh and M. P. Antipov, “Geodynamics and Evolution of the Northern East European Platform in the Late Precambrian as Inferred from Regional Seismic Profiling,” Geotecton- ics, Vol. 40, 2006, pp. 434-449. doi:10.1134/S0016852106060021 [6] M. Mints, A. Suleimanov, N. Zamozhniaya and V. Stu- pak, “A Three-Dimensional Model of the Early Precam- brian Crust under the Southeastern Fennoscandian Shield: Karelia Craton and Belomorian Tectonic Province,” Tec- tonophysics, Vol. 472, No. 1-4, 2009, pp. 323-339. doi:10.1016/j.tecto.2008.12.008 [7] V. I. Shmygalev, H. M. Shmygaleva and M. A. Korsakov, “Geological Map of the USSR, Scale: 1:200,000,” In: K. A. Shurkin, Ed., Karelian Series, Q-36-XXIX, XXX, State Geological Committee of the USSR, Moscow, 1962. [8] A. A. Velichko, M. A. Faustova, Y. N. Gribchenko, V. V. Pisareva and N. G. Sudakova, “Glaciations of the East European Plain—Distribution and Chronology,” In: J. Ehlers and P. L. Gibbard, Eds., Quaternary Glaciations— Extent and Chronology, Part I: Europe, Elsevier, Am- sterdam, 2004, pp. 337-354. [9] Yu. G. Shvartsman, “Deep Structure,” In: Yu. G. Shvarts- man and I. N. Bolotov, Eds., Natural Environment of the Solovetsky Archipelago under a Changing Climate, The Ural Division of the Russian Academy of Sciences, Yekaterinburg, 2007, pp. 23-25. [10] H. Downes, E. Balaganskaya, A. Beard, R. Liferovich and D. Demaiffe, “Petrogenetic Processes in the Ultrama- fic, Alkaline and Carbonatitic Magmatism in the Kola Alkaline Province: A Review,” Lithos, Vol. 85, No. 1-4, 2005, pp. 48-75. doi:10.1016/j.lithos.2005.03.020 [11] V. I. Gornyi, “The Mantle Convection and the Drift of Euro-Asian Plate (According the Remote Geothermal Method Data),” Geoscience and Remote Sensing Sympo- sium, 2002 IEEE International, Vol. 4, 2002, pp. 2029- 2035. [12] Yu. G. Shvartsman and I. N. Bolotov, “Mechanisms of Extrazonal Biocoenois Formation at the Solovetsky Is- lands,” Ecologia, Vol. 5, 2005, pp. 344-352. [13] V. I. Gornyy, “Thermal Conditions of Lakes,” In: Yu. G. Shvartsman and I. N. Bolotov, Eds., Natural Environment of the Solovetsky Archipelago under a Changing Climate, The Ural Division of the Russian Academy of Sciences, Yekaterinburg, 2007, pp. 63-66. [14] I. S. Williams, “U-Th-Pb Geochronology by Ion Micro- Copyright © 2012 SciRes. IJG  S. SCHUTH ET AL. Copyright © 2012 SciRes. IJG 296 probe,” In: M. A. McKibben, W. C. Shanks III and W. I. Ridley, Eds., Applications of Microanalytical Techniques to Understanding Mineralizing Processes, Society of Eco- nomic Geologists, Littleton, 1998, pp. 1-35. [15] L. P. Black, S. L. Kamo, C. M. Allen, J. N. Aleinikoff, D. W. Davis, R. J. Korsch, et al., “TEMORA 1: A New Zir- con Standard for Phanerozoic U-Pb Geochronology,” Chemical Geology, Vol. 200, 2003, pp. 155-170. doi:10.1016/S0009-2541(03)00165-7 [16] M. Wiedenbeck, P. Allé, F. Corfu, W. L. Griffin, M. Meier, F. Oberli, A. von Quadt, et al., “Three Natural Zircon Standards for U-Th-Pb, Lu-Hf, Trace Element and REE Analyses,” Geostandards Newsletter, Vol. 19, No. 1, 1995, pp. 1-23. doi:10.1111/j.1751-908X.1995.tb00147.x [17] K. R. Ludwig, “SQUID 1.02, a User Manual, a Geochro- nological Toolkit for Microsoft Excel,” Berkeley Geo- chronology Center Special Publication, Berkeley, 2001. [18] K. R. Ludwig, “User’s Manual for Isoplot/Ex, Version 3.00, A Geochronological Toolkit for Microsoft Excel,” Berkeley Geochronology Center Special Publication, Ber- keley, 2003. [19] R. H. Steiger and E. Jäger, “Subcommission on Geo- chronology: Convention on the Use of Decay Constants in Geo- and Cosmochronology,” Earth and Planetary Science Letters, Vol. 36, No. 3, 1977, pp. 359-362. doi:10.1016/0012-821X(77)90060-7 [20] S. Stacey and J. D. Kramers, “Approximation of Terres- trial Lead Isotope Evolution by a Two-Stage Model,” Earth and Planetary Science Letters, Vol. 26, 1975, pp. 207-221. doi:10.1016/0012-821X(75)90088-6 [21] S. E. Jackson, N. J. Pearson, W. L. Griffin and E. A. Be- lousova, “The Application of Laser Ablation-inductively Coupled Plasma-Mass Spectrometry to in Situ U-Pb Zir- con Geochronology,” Chemical Geology, Vol. 211, No. 1-2, 2004, pp. 47-69. doi:10.1016/j.chemgeo.2004.06.017 [22] J. Košler and P. J. Sylvester, “Present Trends and the Future of Zircon in Geochronology: Laser Ablation ICPMS,” Reviews in Mineralogy and Geochemistry, Vol. 53, No. 1, 2003, pp. 243-275. doi:10.2113/0530243 [23] F. Barker, “Trondhjemite: Definition, Environment and Hypotheses of Origin,” In: F. Barker, Ed., Trondhjemites, Dacites, and Related Rocks, Developments in Petrology, Vol. 6, 1979, pp. 1-12. [24] A. Streckeisen, “To Each Plutonic Rock Its Proper Name,” Earth-Science Reviews, Vol. 12, No. 1, 1976, pp. 1-33. doi:10.1016/0012-8252(76)90052-0 [25] C. D. Werner, “Saxonian Granulites—Igneous or Litho- genous. A Contribution to the Geochemical Diagnosis of the Original Rocks in High-Metamorphic Complexes,” ZfS-Mitteilungen, Vol. 133, 1987, pp. 221-250. [26] P. W. O. Hoskin and U. Schaltegger, “The Composition of Zircon and Igneous and Metamorphic Petrogenesis,” Reviews in Mineralogy and Geochemistry, Vol. 53, No. 1, 2003, pp. 27-62. doi:10.2113/0530027 [27] F. Tomaschek, A. K. Kennedy, I. M. Villa, M. Lagos and C. Ballhaus, “Zircons from Syros, Cyclades, Greece— Recrystallization and Mobilization of Zircon during High-Pressure Metamorphism,” Journal of Petrology, Vol. 44, No. 11, 2003, pp. 1977-2002. doi:10.1093/petrology/egg067 [28] B. Fu, T. P. Mernagh, N. T. Kita, A. I. S. Kemp and J. W. Valley, “Distinguishing Magmatic Zircon from Hydro- thermal Zircon: A Case Study from the Gidginbung High-Sulphidation Au-Ag-(Cu) Deposit, SE Australia,” Chemical Geology, Vol. 259, 2009, pp. 131-142. doi:10.1016/j.chemgeo.2008.10.035 [29] Y. Nebel-Jacobsen, E. E. Scherer, C. Münker and K. Mezger, “Separation of U, Pb, Lu, and Hf from Single Zircons for Combined U-Pb Dating and Hf Isotope Measurements by TIMS and MC-ICPMS,” Chemical Ge- ology, Vol. 220, No. 1-2, 2005, pp. 105-120. doi:10.1016/j.chemgeo.2005.03.009 [30] V. V. Balagansky, M. J. Timmerman, N. Y. Kozlova and R. V. Kislitsyn, “A 2.44 Ga Syn-Tectonic Mafic Dyke Swarm in the Kolvitsa Belt, Kola Peninsula, Russia: Im- plications for Early Palaeoproterozoic Tectonics in the North-Eastern Fennoscandian Shield,” Precambrian Re- search, Vol. 105, No. 2, 2001, pp. 269-287. doi:10.1016/S0301-9268(00)00115-7 [31] A. Gerdes and A. Zeh, “Combined U-Pb and Hf Isotope LA-(MC-)ICP-MS Analyses of Detrital Zircons: Com- parison with SHRIMP and New Constraints for the Provenance and Age of an Armorican Metasediment in Central Germany,” Earth and Planetary Science Letters, Vol. 249, 2006, pp. 47-61. doi:10.1016/j.epsl.2006.06.039 [32] E. Bibikova, T. Skiöld, S. Bogdanova, R. Gorbatschev and A. Slabunov, “Titanite-Rutile Thermochronometry Across the Boundary between the Archaean Craton in Karelia and the Belomorian Mobile Belt, Eastern Baltic Shield,” Precambrian Research, Vol. 105, 2001, pp. 315- 330. doi:10.1016/S0301-9268(00)00117-0 [33] S. B. Lobach-Zuchenko, N. A. Arestova, V. P. Chekulaev, L. K. Levsky, E. S. Bogomolov and I. N. Krylov, “Geo- chemistry and Petrology of 2.40 - 2.45 Ga Magmatic Rocks in the North-Western Belomorian Belt, Fenno- scandian Shield, Russia,” Precambrian Research, Vol. 92, 1998, pp. 223-250. doi:10.1016/S0301-9268(98)00076-X [34] V. I. Gornyy, “Distribution of Convective Heat Flow in the White Sea Region According to the Data of a Remote Geothermal Method,” In: Yu. G. Shvartsman and I. N. Bolotov, Eds., Natural Environment of the Solovetsky Archipelago under a Changing Climate, The Ural Divi- sion of the Russian Academy of Sciences, Yekaterinburg, 2007, pp. 26-28.
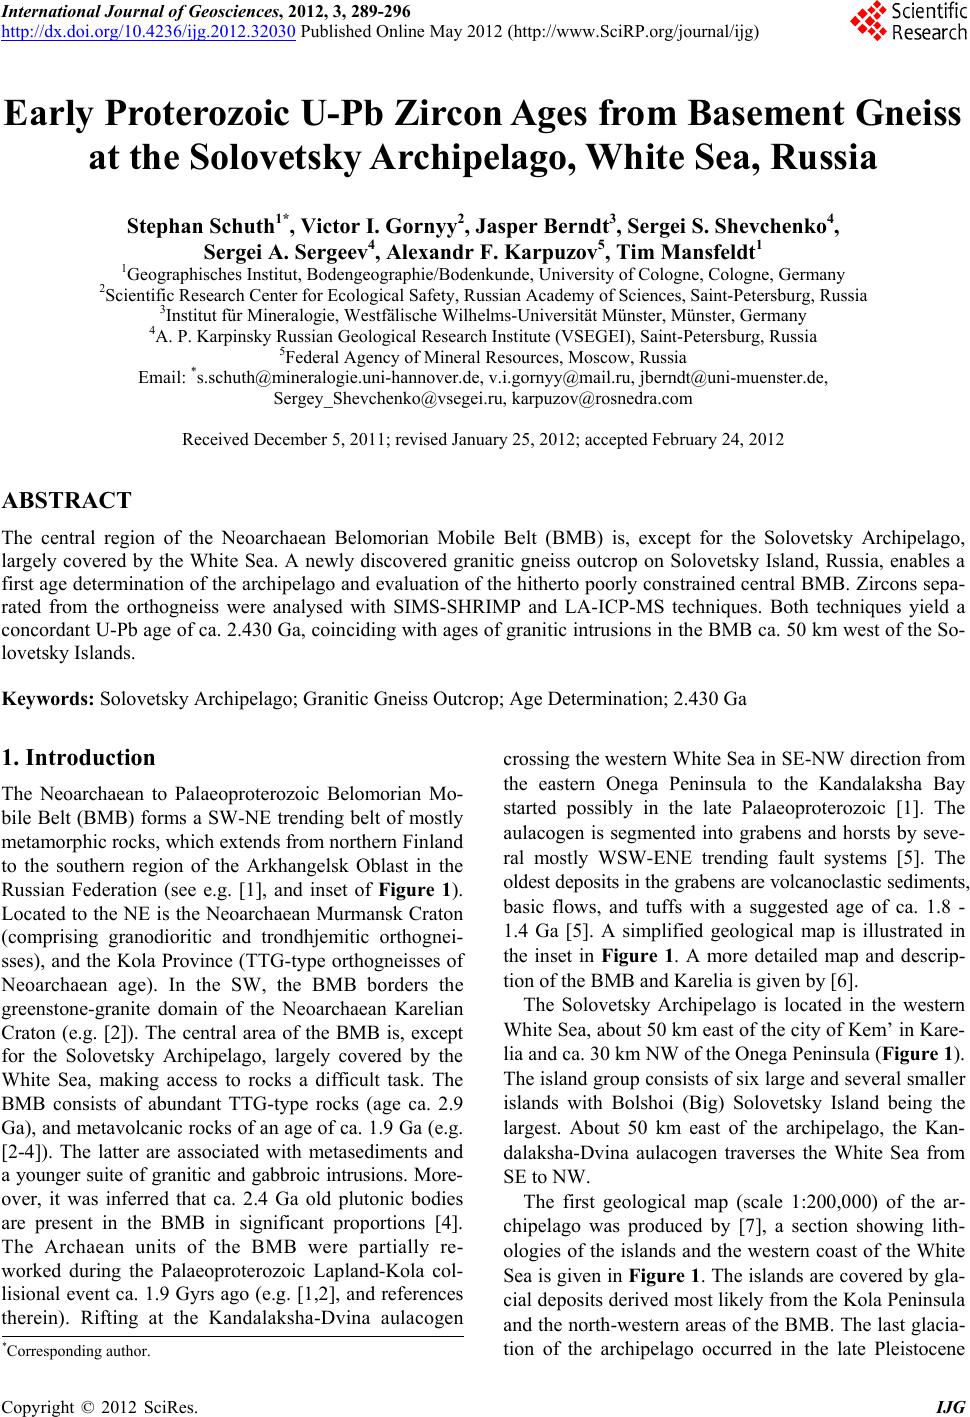
|