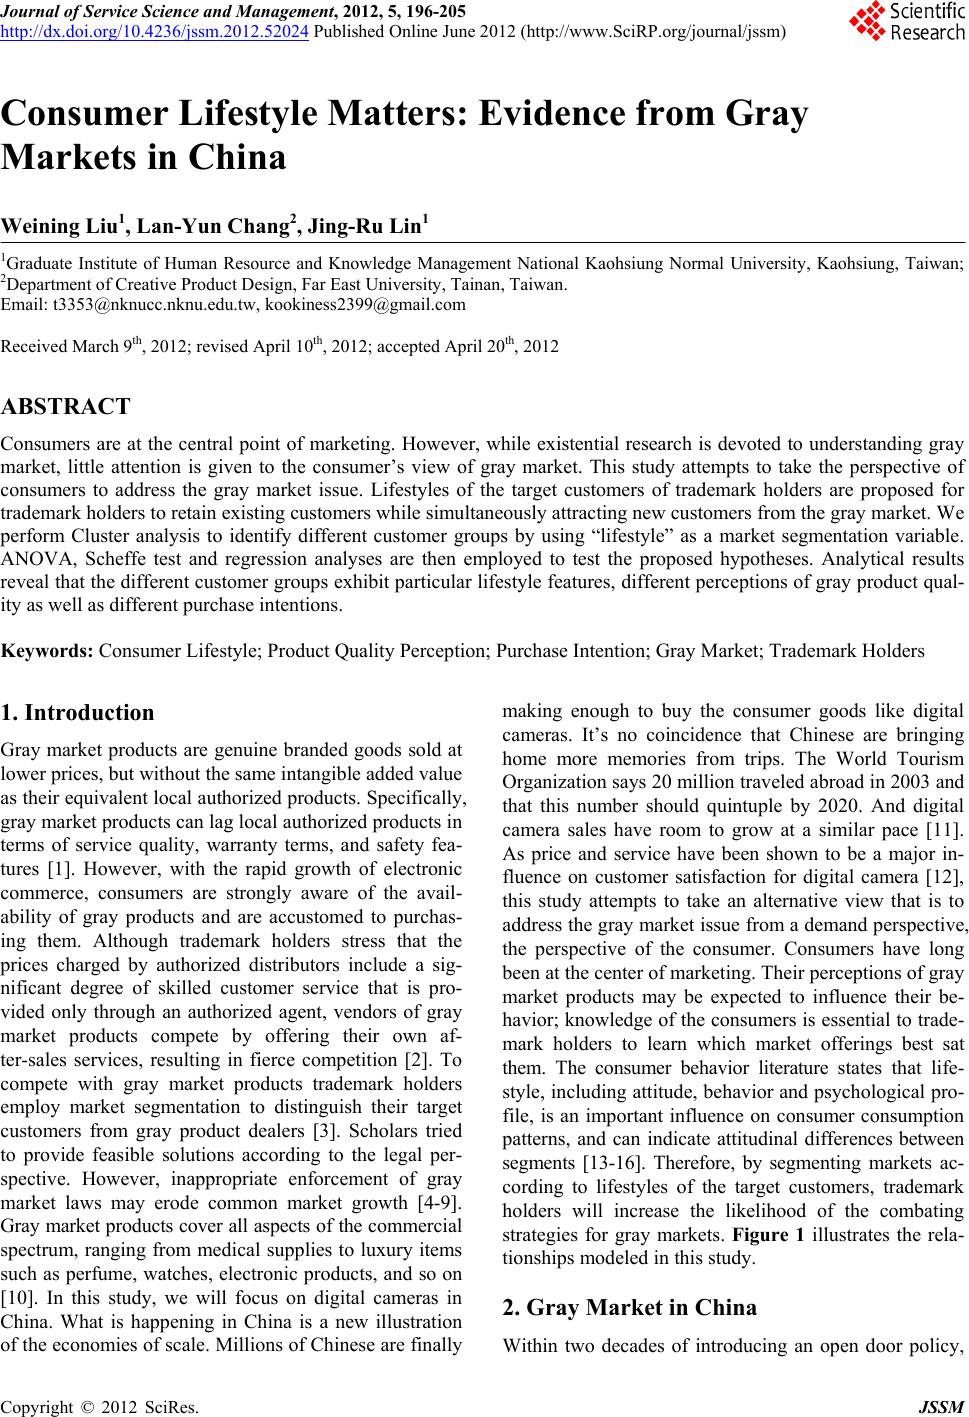
 Journal of Service Science and Management, 2012, 5, 196-205 http://dx.doi.org/10.4236/jssm.2012.52024 Published Online June 2012 (http://www.SciRP.org/journal/jssm) Consumer Lifestyle Matters: Evidence from Gray Markets in China Weining Liu1, Lan-Yun Chang2, Jing-Ru Lin1 1Graduate Institute of Human Resource and Knowledge Management National Kaohsiung Normal University, Kaohsiung, Taiwan; 2Department of Creative Product Design, Far East University, Tainan, Taiwan. Email: t3353@nknucc.nknu.edu.tw, kookiness2399@gmail.com Received March 9th, 2012; revised April 10th, 2012; accepted April 20th, 2012 ABSTRACT Consumers are at the central point of marketing. However, while existential research is devoted to understanding gray market, little attention is given to the consumer’s view of gray market. This study attempts to take the perspective of consumers to address the gray market issue. Lifestyles of the target customers of trademark holders are proposed for trademark holders to retain existing customers while simultaneously attracting new customers from the gray market. We perform Cluster analysis to identify different customer groups by using “lifestyle” as a market segmentation variable. ANOVA, Scheffe test and regression analyses are then employed to test the proposed hypotheses. Analytical results reveal that the different customer groups exhibit particular lifestyle features, different perceptions of gray product qual- ity as well as different purchase intentions. Keywords: Consumer Lifestyle; Product Quality Perception; Purchase Intention; Gray Market; Trademark Holders 1. Introduction Gray market products are genuine branded goods sold at lower prices, but without the same intangible added value as their equivalent local authorized products. Specifically, gray market products can lag local authorized products in terms of service quality, warranty terms, and safety fea- tures [1]. However, with the rapid growth of electronic commerce, consumers are strongly aware of the avail- ability of gray products and are accustomed to purchas- ing them. Although trademark holders stress that the prices charged by authorized distributors include a sig- nificant degree of skilled customer service that is pro- vided only through an authorized agent, vendors of gray market products compete by offering their own af- ter-sales services, resulting in fierce competition [2]. To compete with gray market products trademark holders employ market segmentation to distinguish their target customers from gray product dealers [3]. Scholars tried to provide feasible solutions according to the legal per- spective. However, inappropriate enforcement of gray market laws may erode common market growth [4-9]. Gray market products cover all aspects of the commercial spectrum, ranging from medical supplies to luxury items such as perfume, watches, electronic products, and so on [10]. In this study, we will focus on digital cameras in China. What is happening in China is a new illustration of the economies of scale. Millions of Chinese are finally making enough to buy the consumer goods like digital cameras. It’s no coincidence that Chinese are bringing home more memories from trips. The World Tourism Organization says 20 million traveled abroad in 2003 and that this number should quintuple by 2020. And digital camera sales have room to grow at a similar pace [11]. As price and service have been shown to be a major in- fluence on customer satisfaction for digital camera [12], this study attempts to take an alternative view that is to address the gray market issue from a demand perspective, the perspective of the consumer. Consumers have long been at the center of marketing. Their perceptions of gray market products may be expected to influence their be- havior; knowledge of the consumers is essential to trade- mark holders to learn which market offerings best sat them. The consumer behavior literature states that life- style, including attitude, behavior and psychological pro- file, is an important influence on consumer consumption patterns, and can indicate attitudinal differences between segments [13-16]. Therefore, by segmenting markets ac- cording to lifestyles of the target customers, trademark holders will increase the likelihood of the combating strategies for gray markets. Figure 1 illustrates the rela- tionships modeled in this study. 2. Gray Market in China W ithin two decades of introducing an open door policy, Copyright © 2012 SciRes. JSSM 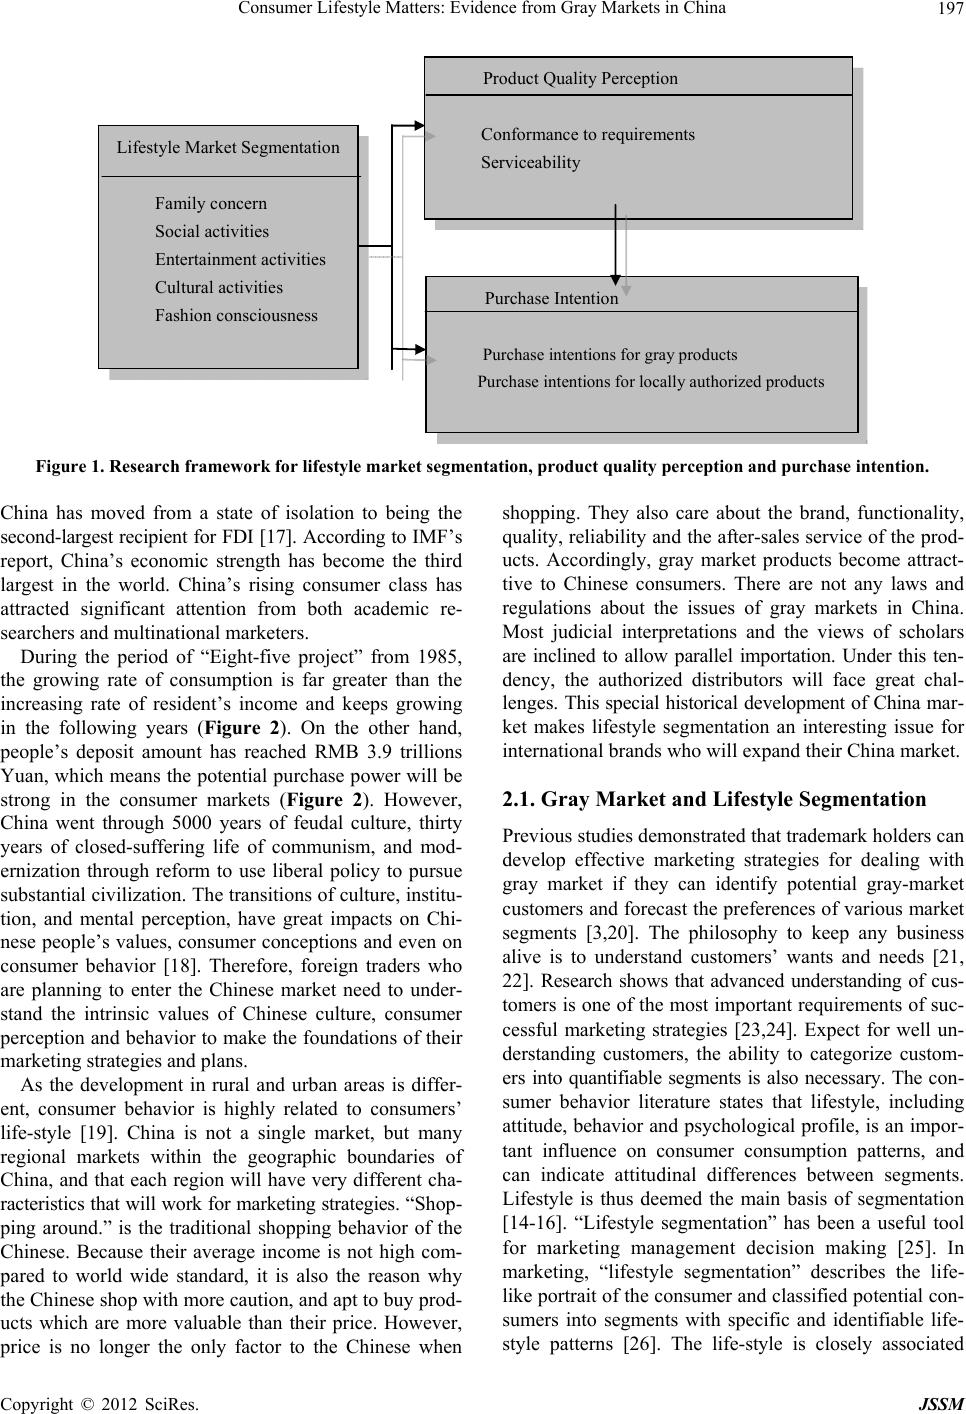 Consumer Lifestyle Matters: Evidence from Gray Markets in China 197 Lifestyle Market Segmentation Family concern Social activities Entertainment activities Cultural activities Fashion consciousness Product Quality Perception Conformance to requirements Serviceability Purchase Intention Purchase intentions for gray products Purchase intentions for locally authorized products Figure 1. Research framework for lifestyle market segmentation, product quality perception and purchase intention. China has moved from a state of isolation to being the second-largest recipient for FDI [17]. According to IMF’s report, China’s economic strength has become the third largest in the world. China’s rising consumer class has attracted significant attention from both academic re- searchers and multinational marketers. During the period of “Eight-five project” from 1985, the growing rate of consumption is far greater than the increasing rate of resident’s income and keeps growing in the following years (Figure 2). On the other hand, people’s deposit amount has reached RMB 3.9 trillions Yuan, which means the potential purchase power will be strong in the consumer markets (Figure 2). However, China went through 5000 years of feudal culture, thirty years of closed-suffering life of communism, and mod- ernization through reform to use liberal policy to pursue substantial civilization. The transitions of culture, institu- tion, and mental perception, have great impacts on Chi- nese people’s values, consumer conceptions and even on consumer behavior [18]. Therefore, foreign traders who are planning to enter the Chinese market need to under- stand the intrinsic values of Chinese culture, consumer perception and behavior to make the foundations of their marketing strategies and plans. As the development in rural and urban areas is differ- ent, consumer behavior is highly related to consumers’ life-style [19]. China is not a single market, but many regional markets within the geographic boundaries of China, and that each region will have very different cha- racteristics that will work for marketing strategies. “Shop- ping around.” is the traditional shopping behavior of the Chinese. Because their average income is not high com- pared to world wide standard, it is also the reason why the Chinese shop with more caution, and apt to buy prod- ucts which are more valuable than their price. However, price is no longer the only factor to the Chinese when shopping. They also care about the brand, functionality, quality, reliability and the after-sales service of the prod- ucts. Accordingly, gray market products become attract- tive to Chinese consumers. There are not any laws and regulations about the issues of gray markets in China. Most judicial interpretations and the views of scholars are inclined to allow parallel importation. Under this ten- dency, the authorized distributors will face great chal- lenges. This special historical development of China mar- ket makes lifestyle segmentation an interesting issue for international brands who will expand their China market. 2.1. Gray Market and Lifestyle Segmentation Previous studies demonstrated that trademark holders can develop effective marketing strategies for dealing with gray market if they can identify potential gray-market customers and forecast the preferences of various market segments [3,20]. The philosophy to keep any business alive is to understand customers’ wants and needs [21, 22]. Research shows that advanced understanding of cus- tomers is one of the most important requirements of suc- cessful marketing strategies [23,24]. Expect for well un- derstanding customers, the ability to categorize custom- ers into quantifiable segments is also necessary. The con- sumer behavior literature states that lifestyle, including attitude, behavior and psychological profile, is an impor- tant influence on consumer consumption patterns, and can indicate attitudinal differences between segments. Lifestyle is thus deemed the main basis of segmentation [14-16]. “Lifestyle segmentation” has been a useful tool for marketing management decision making [25]. In marketing, “lifestyle segmentation” describes the life- like portrait of the consumer and classified potential con- sumers into segments with specific and identifiable life- tyle patterns [26]. The life-style is closely associated s Copyright © 2012 SciRes. JSSM 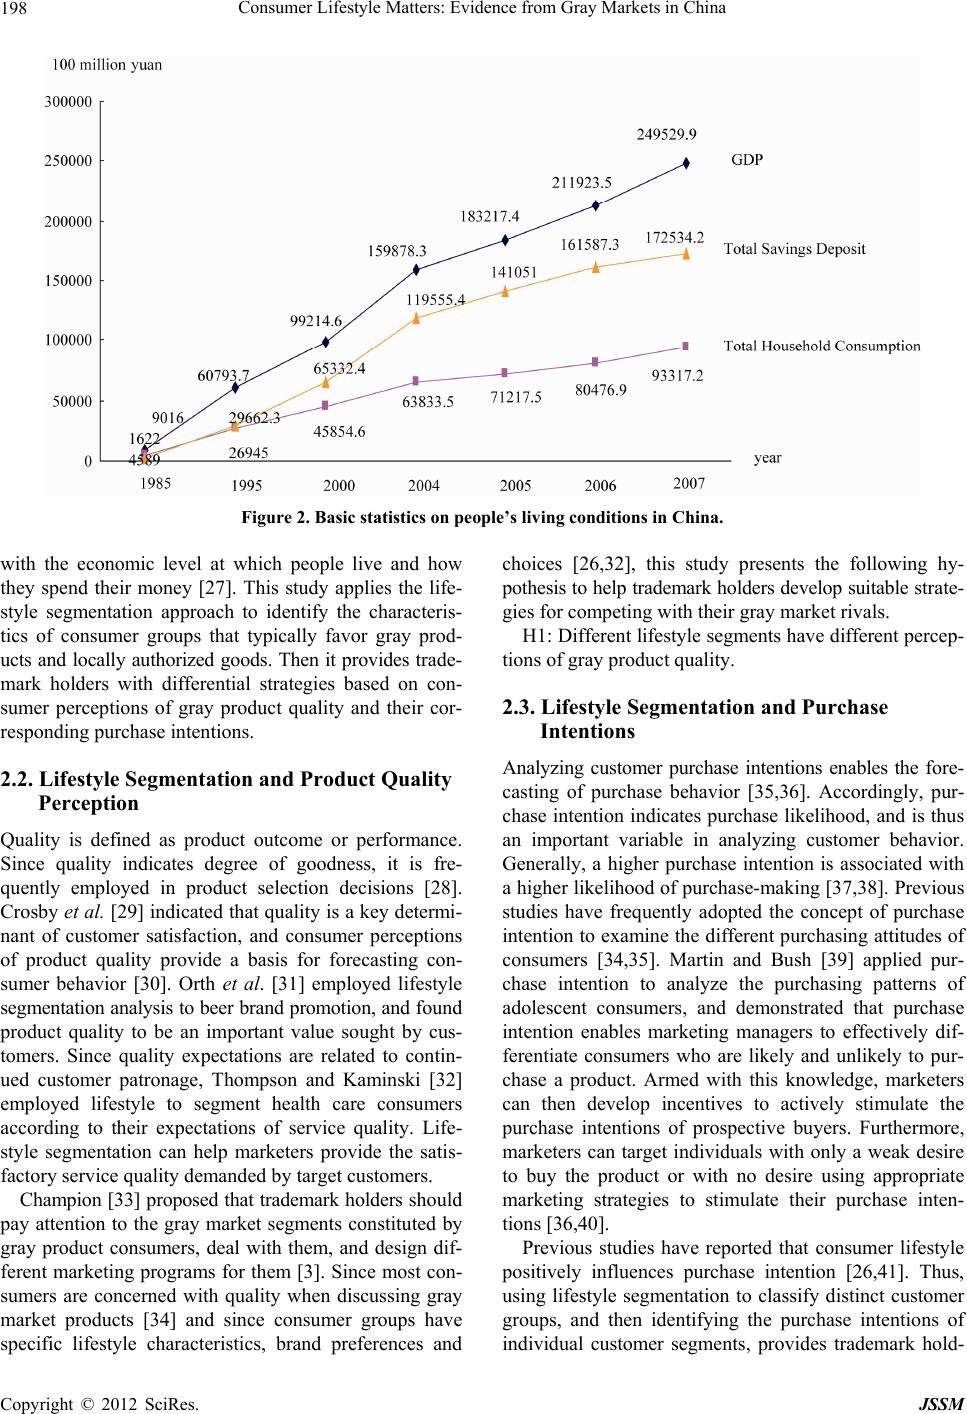 Consumer Lifestyle Matters: Evidence from Gray Markets in China 198 Figure 2. Basic statistics on people’s living conditions in China. with the economic level at which people live and how they spend their money [27]. This study applies the life- style segmentation approach to identify the characteris- tics of consumer groups that typically favor gray prod- ucts and locally authorized goods. Then it provides trade- mark holders with differential strategies based on con- sumer perceptions of gray product quality and their cor- responding purchase intentions. 2.2. Lifestyle Segmentation and Product Quality Perception Quality is defined as product outcome or performance. Since quality indicates degree of goodness, it is fre- quently employed in product selection decisions [28]. Crosby et al. [29] indicated that quality is a key determi- nant of customer satisfaction, and consumer perceptions of product quality provide a basis for forecasting con- sumer behavior [30]. Orth et al. [31] employed lifestyle segmentation analysis to beer brand promotion, and found product quality to be an important value sought by cus- tomers. Since quality expectations are related to contin- ued customer patronage, Thompson and Kaminski [32] employed lifestyle to segment health care consumers according to their expectations of service quality. Life- style segmentation can help marketers provide the satis- factory service quality demanded by target customers. Champion [33] proposed that trademark holders should pay attention to the gray market segments constituted by gray product consumers, deal with them, and design dif- ferent marketing programs for them [3]. Since most con- sumers are concerned with quality when discussing gray market products [34] and since consumer groups have specific lifestyle characteristics, brand preferences and choices [26,32], this study presents the following hy- pothesis to help trademark holders develop suitable strate- gies for competing with their gray market rivals. H1: Different lifestyle segments have different percep- tions of gray product quality. 2.3. Lifestyle Segmentation and Purchase Intentions Analyzing customer purchase intentions enables the fore- casting of purchase behavior [35,36]. Accordingly, pur- chase intention indicates purchase likelihood, and is thus an important variable in analyzing customer behavior. Generally, a higher purchase intention is associated with a higher likelihood of purchase-making [37,38]. Previous studies have frequently adopted the concept of purchase intention to examine the different purchasing attitudes of consumers [34,35]. Martin and Bush [39] applied pur- chase intention to analyze the purchasing patterns of adolescent consumers, and demonstrated that purchase intention enables marketing managers to effectively dif- ferentiate consumers who are likely and unlikely to pur- chase a product. Armed with this knowledge, marketers can then develop incentives to actively stimulate the purchase intentions of prospective buyers. Furthermore, marketers can target individuals with only a weak desire to buy the product or with no desire using appropriate marketing strategies to stimulate their purchase inten- tions [36,40]. Previous studies have reported that consumer lifestyle positively influences purchase intention [26,41]. Thus, using lifestyle segmentation to classify distinct customer groups, and then identifying the purchase intentions of individual customer segments, provides trademark hold- Copyright © 2012 SciRes. JSSM  Consumer Lifestyle Matters: Evidence from Gray Markets in China 199 ers with a valuable knowledge base for formulating ap- propriate marketing strategies. This study thus hypothe- sizes that: H2: Different lifestyle segments have different pur- chase intention of gray product. 2.4. Product Quality Perception and Purchase Intention Numerous studies confer that quality is markedly associ- ated with customer purchase intentions [42]. Earlier, Shawyer et al. [43] concluded that the likelihood of a consumer making a purchase decision increases with con- sumer perception of product quality. Furthermore, per- ceived product quality affects consumer attitudes, faith- fulness and repeat purchase behavior. Studies have also shown that consumer perceptions of a product or service as being of high quality directly or indirectly increase consumer purchase intentions [37]. This study examines the relationship between consumer perceptions of gray product quality and purchase intentions. Specifically, this study hypothesizes that: H3: Consumers’ perceptions of gray product quality positively impact their purchase intentions. 3. Methodology The present analysis is based on empirical data obtained via a self-administered questionnaire. The questionnaire was developed in English and then translated into Chi- nese. The comparability between the two versions of the questionnaire was confirmed through back translation. The questionnaire comprised four sections, covering life- style, product quality perceptions, purchase intentions and demographic variables, respectively. Besides the points related to the demographic variables, the measure- ment items were all expressed using five-point Likert scales ranging from 1 (indicating “strongly disagree”) to 5 (indicating “strongly agree”). To validate the construction of the survey measure, the questionnaire was pre-tested by distributing 40 copies among commercial centers in Hai-Dian, Beijing, where gray products are selling in many stores. Respondents were asked to give suggestions regarding the format, wording, and measurement problems of the questionnaire. From the 32 copies returned, the Cronbach’s α for life- style was 0.92, while those for product quality percep- tions and purchase intentions were 0.89 and 0.91, respec- tively. The results show that the measurement problems for each variable in the pre-test have good reliability, demonstrating the relevance of the questionnaire. Since the questionnaire contained no inappropriate content, only its wording was revised here. The formal questionnaires were distributed among commercial centers in Beijing, Tianjin and Shanghai in China to respondents randomly selected on the spot. Af- ter ascertaining that the respondents fully understood the meanings of gray market and authorized market, and had purchased gray and locally authorized products, the re- spondents were asked to complete the questionnaire. A total of 1000 copies of the questionnaire were distributed, of which 798 were returned. Eliminating incomplete questionnaires or those with uniform answers, a total of 728 valid questionnaires remained, representing a re- sponse rate of around 72.8%. Of the valid ones, 57% were completed by males and 43% by females. Regard- ing respondent age distribution, respondents aged below 20 years old accounted for 21%; those aged between 21 and 30, 35%; those between 31 and 40, 26%; those be- tween 41 and 50, 11%, and those over 51, 7%. Regarding geographical distribution, 39% were from Beijing, 27% from Tianjin, and 34% from Shanghai. Measures Lifestyle: Respondent lifestyles were assessed using a 24-item scale adapted from [26] and expressed through conventional AIO statements. The collected lifestyle data were analyzed using factor analysis based on principal component extraction and varimax rotation. Five solution factors were obtained, named “family concern”, “social activities”, “entertainment activities”, “cultural activities” and “fashion consciousness”, respectively. The Cron- bach’s α value of all dimensions was found to exceed 0.7, a level judged acceptable for current research purposes. Product quality perception: Taking the classifications of product quality proposed by Crosby et al. [29] and Teas and Agarwal [30], five-point Likert scales were developed to measure respondent perceptions of gray product quality. Factor analysis yield two dimensions, “conformance to requirements” and “serviceability”, respectively. The Cronbach’s α value of both dimensions was found to exceed 0.7, and thus both of the dimensions were considered reliable indicators of respondent product quality perception. Purchase intention: Taking the items proposed by Li et al. [35], Goode and Harris [44], and Martin and Bush [39] as a reference, five-point Likert scales were established to assess respondent purchase intentions regarding gray market goods. Factor analysis yielded two dimensions, “purchase intention for gray products” and “purchase intention for locally authorized products”, respectively. The Cronbach’s α of both dimensions both exceeded 0.7, and thus both of the dimensions were considered reliable indicators of respondent purchase intentions. 4. Results and Analysis The analysis of respondent data was commenced by per- forming a factor analysis to identify the dimensions life- Copyright © 2012 SciRes. JSSM  Consumer Lifestyle Matters: Evidence from Gray Markets in China 200 style, product quality perception and purchase intention. Cluster analysis was then conducted based on the five lifestyle factors identified by the factor analysis to assign the 728 respondents to appropriate cluster groups. Sub- sequently, multiple discriminant analysis was conducted to determine the effectiveness of the result of cluster analysis in differentiating consumer lifestyle groups and establishing their relative importance. One-way ANOVA and Scheffe tests were performed to test statistically sig- nificant differences among the different cluster groups in terms of their product quality perceptions and purchase intentions. Finally, regression analysis was conducted to examine the correlation between consumer product qual- ity perceptions and their purchase intentions. 4.1. Cluster Analysis Cluster analysis is frequently applied in market segmen- tation research [16]. The two-stage cluster analysis of the hierarchical and non-hierarchical (K-Means) method is used in this study to identify target customers of gray and authorized markets. The hierarchical method is applied to determine whether the number of clusters is appropriate via analysis of the large difference among clustering co- efficients in the agglomeration schedule, demonstrating that three-cluster solutions are chosen as the appropriate number of clusters (Table 1). The K-Means procedure is then used, based on the five lifestyle factors extracted via factor analysis. The results show that 178 cases were found in Cluster 1 (24.5%), 264 cases in Cluster 2 (36.3%), and 286 cases in Cluster 3 (39.2%) (Table 2). 4.2. Discrimanant Analysis As various previous researchers have speculated on thereliability and validity of results obtained via cluster analysis [16], discriminant analysis was performed to validate the current clustering results. Two canonical correlation functions were generated, i.e. F1: = 1059.498, Wilks’ Lambda = 0.2310, P < 0.001; and F2: = 484.739, Wilks’ Lambda = 0.5115, P < 0.001. Both correlation functions were statistically significant, confirming their validity for cluster classification. Func- 2 10 X 2 4 X Table 1. Clustering coefficients of hierarchical cluster analy- sis. Stage Clusters Combined Clustering Stage Cluster Appears Next Cluster Cluster 1 Cluster 2 CoefficientsCluster 1 Cluster 2 StageNumbers 724 1 89 21.829017 723 715 726 4 725 263 267 22.255836 720 714 7263 726 1 263 25.598206 724 725 7272 727 1 269 27.010431 726 698 01 tion 1 can effectively distinguish clusters 1 and 3, while function 2 can distinguish cluster 2 and others (Figure 3). The correct cluster classification rate (i.e. the overall hit ratio) was 95.47% (Table 3), and hence it was deduced that the cluster analysis results were sufficiently reliable for the current purpose. 4.3. Characteristics of Clusters The mean and Scheffe test results for cluster groups and lifestyle factors (Table 4) show that Cluster 1 exhibited “family concern” and “cultural activities” lifestyle char- acteristics, and thus is a group that enjoys housekeeping and is more family oriented than any other cluster. Meanwhile, the lifestyle features of Cluster 2 are related primarily to the “social activities” and “cultural activi- ties” factors; so they like going to public places and par- ticipating in outdoor activities better than consumers in other clusters. Finally, the lifestyle features of cluster 3 are related primarily to the “fashion consciousness” and “entertainment activities” factors; and the cluster is a group who care more about being fashionable, and are more interested in new and unique products, more enthu- siastic about traveling, and more interested in people and friends than any other cluster (Table 4). 4.4. Test of Hypothesis The ANOVA analysis results for lifestyle segmentation and product quality perception (Table 5) demonstrate that all lifestyle segments perceive gray product quality differently. The results indicate that three statistically significant clusters are in relation to the “conformance to requirements” and “serviceability” factors of gray product Table 2. Cluster analysis results based on five lifestyle fac- tors. Segmentation Cluster 1Cluster 2 Cluster 3Total Number of samples178 264 286 728 Percentage 24.5% 36.3% 39.2% 100% Table 3. Discriminant analysis of clustering results shown in Table 4. Actual GroupPredicted Group Total 1 2 3 Cluster 1 162(91.0%) 8(4.5%) 8(4.5%) 178 Cluster 2 7(2.7%) 255(96.6%) 2(0.8%) 264 Cluster 3 2(0.7%) 6(2.1%) 278(97.2%) 286 Percent of “grouped” cases correctly classified = (162 + 255 + 278)/728 = 95.47% (Hit Ratio) T he correct rate of percentage is in parenthesis. Copyright © 2012 SciRes. JSSM  Consumer Lifestyle Matters: Evidence from Gray Markets in China Copyright © 2012 SciRes. JSSM 201 Figure 3. Clustering results. Function 1 = –0.56274Y1* + 0.46502Y2 + 0.29359Y3 – 0.59282Y4* + 0.83241Y5*; Function 2 = 0.00437Y1 + 0.88469Y2* – 0.27791y3* + 0.46792Y4 – 0.31175Y5; .denotes largest absolute correlation between each variable and each discriminant function. Table 4. Mean and Scheffe test results for cluster groups and lifestyle factors. Cluster and Naming Family Social Entertainment Cultural Fashion Concern Activities Activities Activities Consciousness Cluster 1 0.47 –0.95 –0.13 0.33 –0.64 Cluster 2 –0.001 0.81 –0.19 0.33 –0.23 Cluster 3 –0.29 –0.15 0.25 –0.51 0.61 F value 34.018*** 321.89*** 16.07*** 74.76*** 132.30*** Scheffe test 1 > 2 1 < 2 1 < 3 1 > 3 1 < 2 1 > 3 1 < 3 2 < 3 2 > 3 1 < 3 2 > 3 2 > 3 2 < 3 ***P < 0.001; **P < 0.01; *P < 0.05. quality perception (P < 0.001). Hypothesis H1, namely that all lifestyle segments have different perceptions of gray product quality, thus is supported. Generally, the results listed in Table 5 support the following inferences: 1) members of cluster 1 have the lowest consent of gray product quality; 2) members of clusters 2 and 3 perceive gray product quality as conforming to requirements; 3) members of cluster 3 do not consent to the “service- ability” of gray product quality, and 4) members of clus- ter 2 exhibit the greatest consent to the serviceability of the three clusters. The ANOVA analysis results for lifestyle segmenta- tion and purchase intention (Table 6) indicate that all lifestyle segments have different purchase intentions re- garding gray products. As shown, all three clusters are statistically significant (P < 0.001) for both “purchase intention for gray products” and the “purchase intention for locally authorized products”. Therefore, hypothesis H2, i.e. that all lifestyle segments of customers have dif- ferent purchase intentions of gray product, is supported. The ANOVA results support the following specific in- ferences: 1) members of cluster 1 exhibit no specific preferences for either locally authorized or gray products, renamed “Neutral”; 2) members of cluster 2 show a pref- erence for locally authorized products, renamed “Trade- mark Lover”; and 3) members of cluster 3 prefer gray products, renamed “Gray Product Lover”. Finally, the regression analysis results indicate that consumer perceptions of gray product quality statistically significantly influence their purchase intentions (P < 0.001) (Table 7). Therefore, hypothesis H3, i.e. that consumer perceptions of gray product quality positively 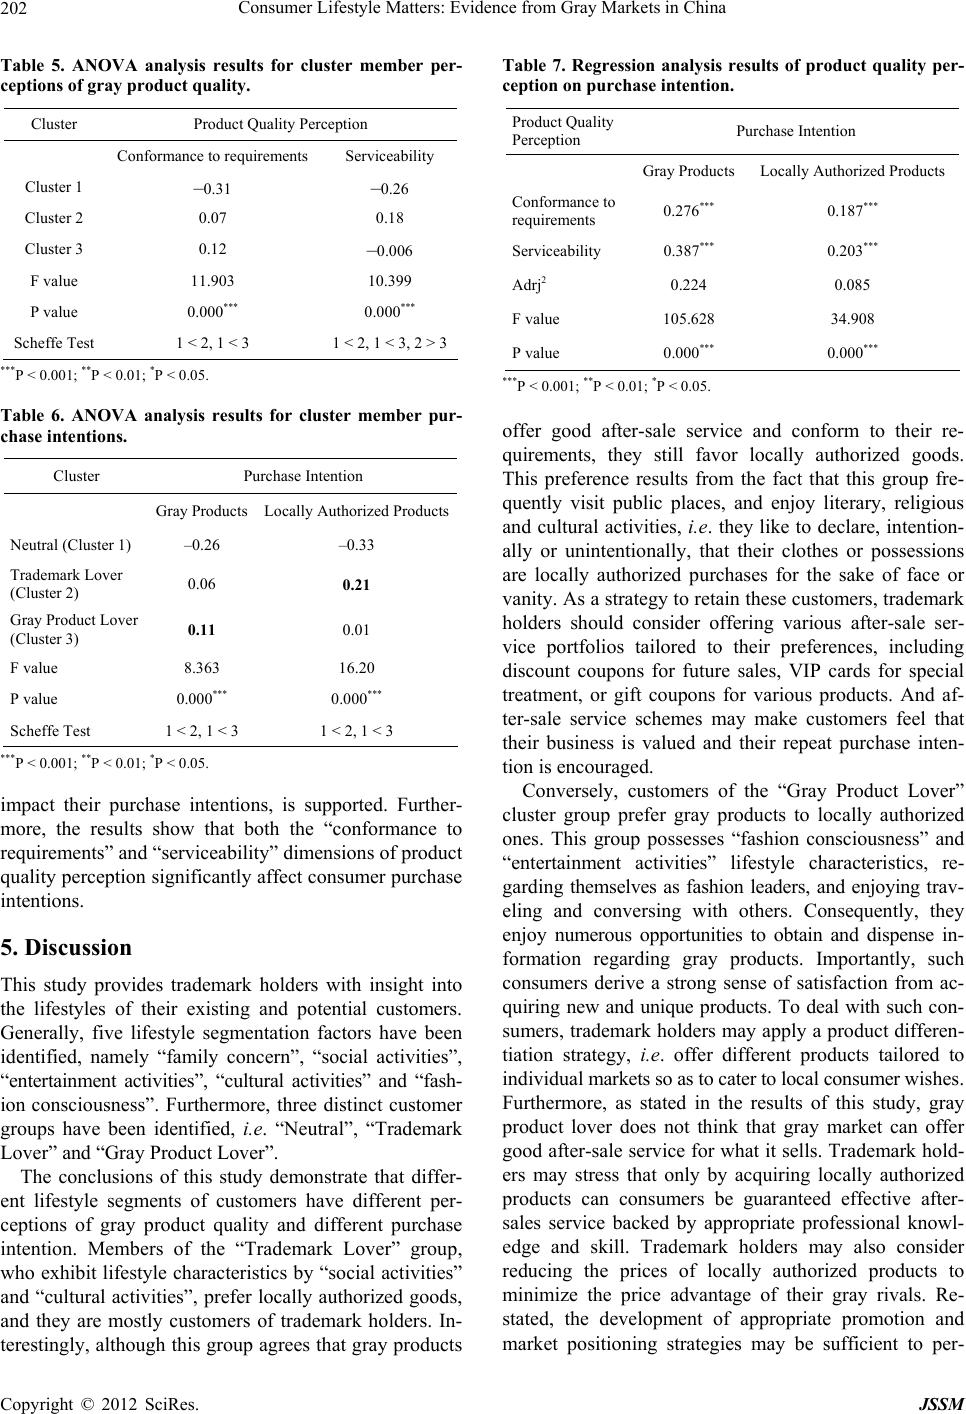 Consumer Lifestyle Matters: Evidence from Gray Markets in China 202 Table 5. ANOVA analysis results for cluster member per- ceptions of gray product quality. Cluster Product Quality Perception Conformance to requirements Serviceability Cluster 1 –0.31 –0.26 Cluster 2 0.07 0.18 Cluster 3 0.12 –0.006 F value 11.903 10.399 P value 0.000*** 0.000*** Scheffe Test 1 < 2, 1 < 3 1 < 2, 1 < 3, 2 > 3 ***P < 0.001; **P < 0.01; *P < 0.05. Table 6. ANOVA analysis results for cluster member pur- chase intentions. Cluster Purchase Intention Gray ProductsLocally Authorized Products Neutral (Cluster 1) –0.26 –0.33 Trademark Lover (Cluster 2) 0.06 0.21 Gray Product Lover (Cluster 3) 0.11 0.01 F value 8.363 16.20 P value 0.000*** 0.000*** Scheffe Test 1 < 2, 1 < 3 1 < 2, 1 < 3 ***P < 0.001; **P < 0.01; *P < 0.05. impact their purchase intentions, is supported. Further- more, the results show that both the “conformance to requirements” and “serviceability” dimensions of product quality perception significantly affect consumer purchase intentions. 5. Discussion This study provides trademark holders with insight into the lifestyles of their existing and potential customers. Generally, five lifestyle segmentation factors have been identified, namely “family concern”, “social activities”, “entertainment activities”, “cultural activities” and “fash- ion consciousness”. Furthermore, three distinct customer groups have been identified, i.e. “Neutral”, “Trademark Lover” and “Gray Product Lover”. The conclusions of this study demonstrate that differ- ent lifestyle segments of customers have different per- ceptions of gray product quality and different purchase intention. Members of the “Trademark Lover” group, who exhibit lifestyle characteristics by “social activities” and “cultural activities”, prefer locally authorized goods, and they are mostly customers of trademark holders. In- terestingly, although this group agrees that gray products Table 7. Regression analysis results of product quality per- ception on purchase intention. Product Quality Perception Purchase Intention Gray Products Locally Authorized Products Conformance to requirements 0.276*** 0.187*** Serviceability 0.387*** 0.203*** Adrj2 0.224 0.085 F value 105.628 34.908 P value 0.000*** 0.000*** ***P < 0.001; **P < 0.01; *P < 0.05. offer good after-sale service and conform to their re- quirements, they still favor locally authorized goods. This preference results from the fact that this group fre- quently visit public places, and enjoy literary, religious and cultural activities, i.e. they like to declare, intention- ally or unintentionally, that their clothes or possessions are locally authorized purchases for the sake of face or vanity. As a strategy to retain these customers, trademark holders should consider offering various after-sale ser- vice portfolios tailored to their preferences, including discount coupons for future sales, VIP cards for special treatment, or gift coupons for various products. And af- ter-sale service schemes may make customers feel that their business is valued and their repeat purchase inten- tion is encouraged. Conversely, customers of the “Gray Product Lover” cluster group prefer gray products to locally authorized ones. This group possesses “fashion consciousness” and “entertainment activities” lifestyle characteristics, re- garding themselves as fashion leaders, and enjoying trav- eling and conversing with others. Consequently, they enjoy numerous opportunities to obtain and dispense in- formation regarding gray products. Importantly, such consumers derive a strong sense of satisfaction from ac- quiring new and unique products. To deal with such con- sumers, trademark holders may apply a product differen- tiation strategy, i.e. offer different products tailored to individual markets so as to cater to local consumer wishes. Furthermore, as stated in the results of this study, gray product lover does not think that gray market can offer good after-sale service for what it sells. Trademark hold- ers may stress that only by acquiring locally authorized products can consumers be guaranteed effective after- sales service backed by appropriate professional knowl- edge and skill. Trademark holders may also consider reducing the prices of locally authorized products to minimize the price advantage of their gray rivals. Re- stated, the development of appropriate promotion and market positioning strategies may be sufficient to per- Copyright © 2012 SciRes. JSSM 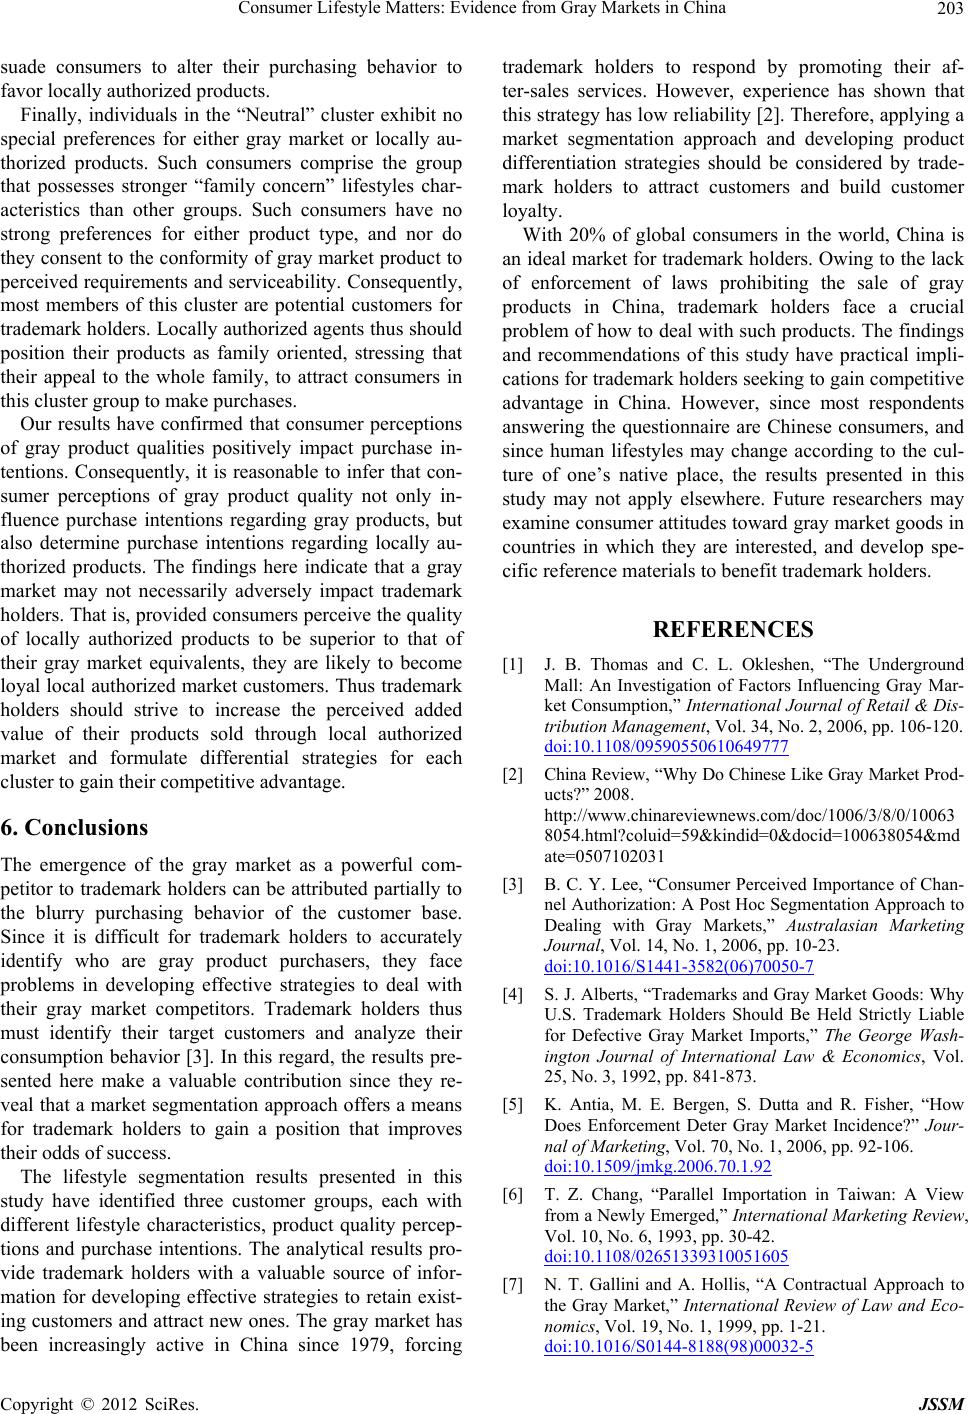 Consumer Lifestyle Matters: Evidence from Gray Markets in China 203 suade consumers to alter their purchasing behavior to favor locally authorized products. Finally, individuals in the “Neutral” cluster exhibit no special preferences for either gray market or locally au- thorized products. Such consumers comprise the group that possesses stronger “family concern” lifestyles char- acteristics than other groups. Such consumers have no strong preferences for either product type, and nor do they consent to the conformity of gray market product to perceived requirements and serviceability. Consequently, most members of this cluster are potential customers for trademark holders. Locally authorized agents thus should position their products as family oriented, stressing that their appeal to the whole family, to attract consumers in this cluster group to make purchases. Our results have confirmed that consumer perceptions of gray product qualities positively impact purchase in- tentions. Consequently, it is reasonable to infer that con- sumer perceptions of gray product quality not only in- fluence purchase intentions regarding gray products, but also determine purchase intentions regarding locally au- thorized products. The findings here indicate that a gray market may not necessarily adversely impact trademark holders. That is, provided consumers perceive the quality of locally authorized products to be superior to that of their gray market equivalents, they are likely to become loyal local authorized market customers. Thus trademark holders should strive to increase the perceived added value of their products sold through local authorized market and formulate differential strategies for each cluster to gain their competitive advantage. 6. Conclusions The emergence of the gray market as a powerful com- petitor to trademark holders can be attributed partially to the blurry purchasing behavior of the customer base. Since it is difficult for trademark holders to accurately identify who are gray product purchasers, they face problems in developing effective strategies to deal with their gray market competitors. Trademark holders thus must identify their target customers and analyze their consumption behavior [3]. In this regard, the results pre- sented here make a valuable contribution since they re- veal that a market segmentation approach offers a means for trademark holders to gain a position that improves their odds of success. The lifestyle segmentation results presented in this study have identified three customer groups, each with different lifestyle characteristics, product quality percep- tions and purchase intentions. The analytical results pro- vide trademark holders with a valuable source of infor- mation for developing effective strategies to retain exist- ing customers and attract new ones. The gray market has been increasingly active in China since 1979, forcing trademark holders to respond by promoting their af- ter-sales services. However, experience has shown that this strategy has low reliability [2]. Therefore, applying a market segmentation approach and developing product differentiation strategies should be considered by trade- mark holders to attract customers and build customer loyalty. With 20% of global consumers in the world, China is an ideal market for trademark holders. Owing to the lack of enforcement of laws prohibiting the sale of gray products in China, trademark holders face a crucial problem of how to deal with such products. The findings and recommendations of this study have practical impli- cations for trademark holders seeking to gain competitive advantage in China. However, since most respondents answering the questionnaire are Chinese consumers, and since human lifestyles may change according to the cul- ture of one’s native place, the results presented in this study may not apply elsewhere. Future researchers may examine consumer attitudes toward gray market goods in countries in which they are interested, and develop spe- cific reference materials to benefit trademark holders. REFERENCES [1] J. B. Thomas and C. L. Okleshen, “The Underground Mall: An Investigation of Factors Influencing Gray Mar- ket Consumption,” International Journal of Retail & Dis- tribution Management, Vol. 34, No. 2, 2006, pp. 106-120. doi:10.1108/09590550610649777 [2] China Review, “Why Do Chinese Like Gray Market Prod- ucts?” 2008. http://www.chinareviewnews.com/doc/1006/3/8/0/10063 8054.html?coluid=59&kindid=0&docid=100638054&md ate=0507102031 [3] B. C. Y. Lee, “Consumer Perceived Importance of Chan- nel Authorization: A Post Hoc Segmentation Approach to Dealing with Gray Markets,” Australasian Marketing Journal, Vol. 14, No. 1, 2006, pp. 10-23. doi:10.1016/S1441-3582(06)70050-7 [4] S. J. Alberts, “Trademarks and Gray Market Goods: Why U.S. Trademark Holders Should Be Held Strictly Liable for Defective Gray Market Imports,” The George Wash- ington Journal of International Law & Economics, Vol. 25, No. 3, 1992, pp. 841-873. [5] K. Antia, M. E. Bergen, S. Dutta and R. Fisher, “How Does Enforcement Deter Gray Market Incidence?” Jour- nal of Marketing, Vol. 70, No. 1, 2006, pp. 92-106. doi:10.1509/jmkg.2006.70.1.92 [6] T. Z. Chang, “Parallel Importation in Taiwan: A View from a Newly Emerged,” International Marketing Review, Vol. 10, No. 6, 1993, pp. 30-42. doi:10.1108/02651339310051605 [7] N. T. Gallini and A. Hollis, “A Contractual Approach to the Gray Market,” International Review of Law and Eco- nomics, Vol. 19, No. 1, 1999, pp. 1-21. doi:10.1016/S0144-8188(98)00032-5 Copyright © 2012 SciRes. JSSM 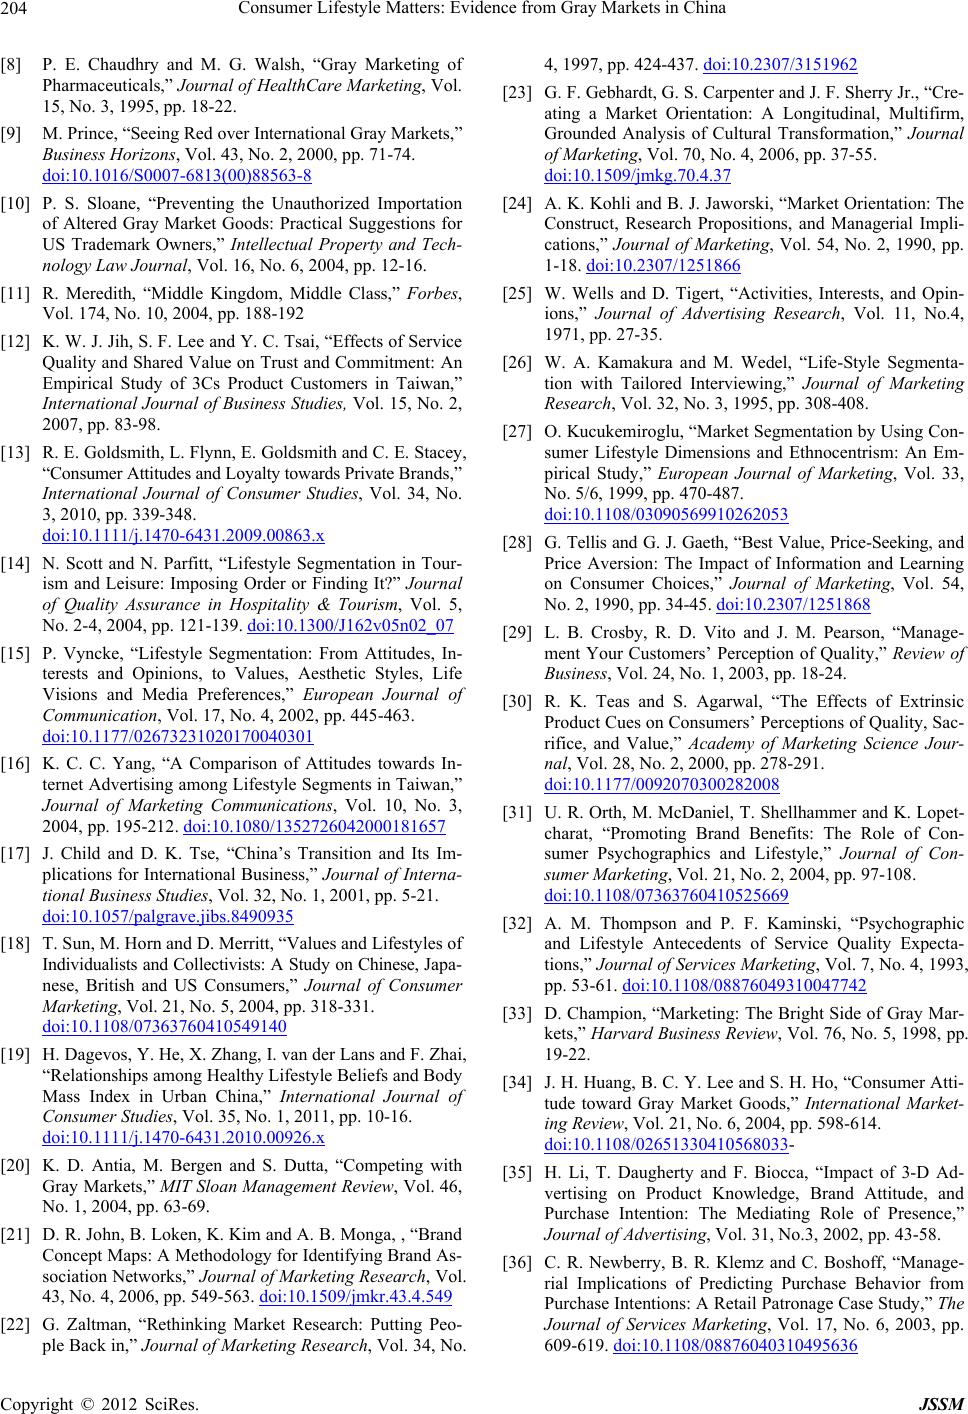 Consumer Lifestyle Matters: Evidence from Gray Markets in China 204 [8] P. E. Chaudhry and M. G. Walsh, “Gray Marketing of Pharmaceuticals,” Journal of HealthCare Marketing, Vol. 15, No. 3, 1995, pp. 18-22. [9] M. Prince, “Seeing Red over International Gray Markets,” Business Horizons, Vol. 43, No. 2, 2000, pp. 71-74. doi:10.1016/S0007-6813(00)88563-8 [10] P. S. Sloane, “Preventing the Unauthorized Importation of Altered Gray Market Goods: Practical Suggestions for US Trademark Owners,” Intellectual Property and Tech- nology Law Journal, Vol. 16, No. 6, 2004, pp. 12-16. [11] R. Meredith, “Middle Kingdom, Middle Class,” Forbes, Vol. 174, No. 10, 2004, pp. 188-192 [12] K. W. J. Jih, S. F. Lee and Y. C. Tsai, “Effects of Service Quality and Shared Value on Trust and Commitment: An Empirical Study of 3Cs Product Customers in Taiwan,” International Journal of Business Studies, Vol. 15, No. 2, 2007, pp. 83-98. [13] R. E. Goldsmith, L. Flynn, E. Goldsmith and C. E. Stacey, “Consumer Attitudes and Loyalty towards Private Brands,” International Journal of Consumer Studies, Vol. 34, No. 3, 2010, pp. 339-348. doi:10.1111/j.1470-6431.2009.00863.x [14] N. Scott and N. Parfitt, “Lifestyle Segmentation in Tour- ism and Leisure: Imposing Order or Finding It?” Journal of Quality Assurance in Hospitality & Tourism, Vol. 5, No. 2-4, 2004, pp. 121-139. doi:10.1300/J162v05n02_07 [15] P. Vyncke, “Lifestyle Segmentation: From Attitudes, In- terests and Opinions, to Values, Aesthetic Styles, Life Visions and Media Preferences,” European Journal of Communication, Vol. 17, No. 4, 2002, pp. 445-463. doi:10.1177/02673231020170040301 [16] K. C. C. Yang, “A Comparison of Attitudes towards In- ternet Advertising among Lifestyle Segments in Taiwan,” Journal of Marketing Communications, Vol. 10, No. 3, 2004, pp. 195-212. doi:10.1080/1352726042000181657 [17] J. Child and D. K. Tse, “China’s Transition and Its Im- plications for International Business,” Journal of Interna- tional Business Studies, Vol. 32, No. 1, 2001, pp. 5-21. doi:10.1057/palgrave.jibs.8490935 [18] T. Sun, M. Horn and D. Merritt, “Values and Lifestyles of Individualists and Collectivists: A Study on Chinese, Japa- nese, British and US Consumers,” Journal of Consumer Marketing, Vol. 21, No. 5, 2004, pp. 318-331. doi:10.1108/07363760410549140 [19] H. Dagevos, Y. He, X. Zhang, I. van der Lans and F. Zhai, “Relationships among Healthy Lifestyle Beliefs and Body Mass Index in Urban China,” International Journal of Consumer Studies, Vol. 35, No. 1, 2011, pp. 10-16. doi:10.1111/j.1470-6431.2010.00926.x [20] K. D. Antia, M. Bergen and S. Dutta, “Competing with Gray Markets,” MIT Sloan Management Review, Vol. 46, No. 1, 2004, pp. 63-69. [21] D. R. John, B. Loken, K. Kim and A. B. Monga, , “Brand Concept Maps: A Methodology for Identifying Brand As- sociation Networks,” Journal of Marketing Research, Vol. 43, No. 4, 2006, pp. 549-563. doi:10.1509/jmkr.43.4.549 [22] G. Zaltman, “Rethinking Market Research: Putting Peo- ple Back in,” Journal of Marketing Research, Vol. 34, No. 4, 1997, pp. 424-437. doi:10.2307/3151962 [23] G. F. Gebhardt, G. S. Carpenter and J. F. Sherry Jr., “Cre- ating a Market Orientation: A Longitudinal, Multifirm, Grounded Analysis of Cultural Transformation,” Journal of Marketing, Vol. 70, No. 4, 2006, pp. 37-55. doi:10.1509/jmkg.70.4.37 [24] A. K. Kohli and B. J. Jaworski, “Market Orientation: The Construct, Research Propositions, and Managerial Impli- cations,” Journal of Marketing, Vol. 54, No. 2, 1990, pp. 1-18. doi:10.2307/1251866 [25] W. Wells and D. Tigert, “Activities, Interests, and Opin- ions,” Journal of Advertising Research, Vol. 11, No.4, 1971, pp. 27-35. [26] W. A. Kamakura and M. Wedel, “Life-Style Segmenta- tion with Tailored Interviewing,” Journal of Marketing Research, Vol. 32, No. 3, 1995, pp. 308-408. [27] O. Kucukemiroglu, “Market Segmentation by Using Con- sumer Lifestyle Dimensions and Ethnocentrism: An Em- pirical Study,” European Journal of Marketing, Vol. 33, No. 5/6, 1999, pp. 470-487. doi:10.1108/03090569910262053 [28] G. Tellis and G. J. Gaeth, “Best Value, Price-Seeking, and Price Aversion: The Impact of Information and Learning on Consumer Choices,” Journal of Marketing, Vol. 54, No. 2, 1990, pp. 34-45. doi:10.2307/1251868 [29] L. B. Crosby, R. D. Vito and J. M. Pearson, “Manage- ment Your Customers’ Perception of Quality,” Review of Business, Vol. 24, No. 1, 2003, pp. 18-24. [30] R. K. Teas and S. Agarwal, “The Effects of Extrinsic Product Cues on Consumers’ Perceptions of Quality, Sac- rifice, and Value,” Academy of Marketing Science Jour- nal, Vol. 28, No. 2, 2000, pp. 278-291. doi:10.1177/0092070300282008 [31] U. R. Orth, M. McDaniel, T. Shellhammer and K. Lopet- charat, “Promoting Brand Benefits: The Role of Con- sumer Psychographics and Lifestyle,” Journal of Con- sumer Marketing, Vol. 21, No. 2, 2004, pp. 97-108. doi:10.1108/07363760410525669 [32] A. M. Thompson and P. F. Kaminski, “Psychographic and Lifestyle Antecedents of Service Quality Expecta- tions,” Journal of Services Marketing, Vol. 7, No. 4, 1993, pp. 53-61. doi:10.1108/08876049310047742 [33] D. Champion, “Marketing: The Bright Side of Gray Mar- kets,” Harvard Business Review, Vol. 76, No. 5, 1998, pp. 19-22. [34] J. H. Huang, B. C. Y. Lee and S. H. Ho, “Consumer Atti- tude toward Gray Market Goods,” International Market- ing Review, Vol. 21, No. 6, 2004, pp. 598-614. doi:10.1108/02651330410568033- [35] H. Li, T. Daugherty and F. Biocca, “Impact of 3-D Ad- vertising on Product Knowledge, Brand Attitude, and Purchase Intention: The Mediating Role of Presence,” Journal of Advertising, Vol. 31, No.3, 2002, pp. 43-58. [36] C. R. Newberry, B. R. Klemz and C. Boshoff, “Manage- rial Implications of Predicting Purchase Behavior from Purchase Intentions: A Retail Patronage Case Study,” The Journal of Services Marketing, Vol. 17, No. 6, 2003, pp. 609-619. doi:10.1108/08876040310495636 Copyright © 2012 SciRes. JSSM  Consumer Lifestyle Matters: Evidence from Gray Markets in China Copyright © 2012 SciRes. JSSM 205 [37] J. C. Bou, C. Camison and A. B. Escrig, “Measuring the Relationship between Firm Perceived Quality and Cus- tomer Satisfaction and Its Influence on Purchase Inten- tions,” Total Quality Management, Vol. 12, No. 6, 2001, pp. 719-734. [38] W. B. Dodds, K. B. Monroe and D. Grewal, “Effects of Price, Brand and Store Information on Buyers’ Product Evaluations,” Journal of Marketing Research, Vol. 28, No. 3, 1991, pp. 307-319. doi:10.2307/3172866 [39] C. A. Martin and A. J. Bush, “Do Role Models Influence Teenagers’ Purchase Intentions and Behavior?” Journal of Consumer Marketing, Vol. 17, No. 5, 2000, pp. 441- 455. doi:10.1108/07363760010341081 [40] M. R. Young, W. S. DeSarbo and V. G. Morwitz, “The Stochastic Modeling of Purchase Intentions and Behav- ior,” Management Science, Vol. 44, No. 2, 1998, pp. 188- 202. doi:10.1287/mnsc.44.2.188 [41] S. Todd and R. Lawson, “Lifestyle Segmentation and Museum/Gallery Visiting Behavior,” International Jour- nal of Nonprofit and Voluntary Sector Marketing, Vol. 6, No. 3, 2001, pp. 269-277. doi:10.1002/nvsm.152 [42] R. Tsiotsou, “The Role of Perceived Product Quality and Overall Satisfaction on Purchase Intentions,” International Journal of Consumer Studies, Vol. 30, No. 2, 2006, pp. 207-217. doi:10.1111/j.1470-6431.2005.00477.x [43] D. Shawyer, N. French and A. McGann, “The Effect of Price Cues on Perceived Product Quality in a Grocery Shopping Simulation,” European Journal of Marketing, Vol. 6, No. 4, 1972, pp. 217-222. doi:10.1108/EUM0000000005143 [44] M. H. Goode and L. C. Harris, “Online Behavioural In- tentions: An Empirical Investigation of Antecedents and Moderators,” European Journal of Marketing, Vol. 41, No. 5-6, 2007, pp. 512-536. doi:10.1108/03090560710737589
|