 iBusiness, 2012, 4, 98-107 http://dx.doi.org/10.4236/ib.2012.42012 Published Online June 2012 (http://www.SciRP.org/journal/ib) Does the Success of Information Systems Really Matters to Firm Performance? Rich C. Lee1,2 1Department of Information Management, National Sun Yat-sen University, Kaohsiung, Chinese Tapei; 2System Technology Group, IBM, Chinese Tapei. Email: richchihlee@gmail.com Received February 10th, 2012; revised April 1st, 2012; accepted April 11th, 2012 ABSTRACT Many failed listed-enterprises had strong information capabilities and resources; however such advantage did not help these enterprises survive during the economy difficult times. Previous research of DeLone and McLean (D & M) implied the success of information systems will enhance the performance of enterprises. Based on this implication, many enter- prises continuously invested resources on information systems as a strategy trying to gain advantage over competitors. This paper argues the Net Be nefits in D & M model—resulted from the success of Information system—does not always significantly improve the Enterprise Performance but rather has a limit on it. In fact, such an excess investment cannot improve the Enterprise Performance but exhausts more valuable resources instead. The implication of this paper is to encourage enterprises to revisit their v aluable service and reevaluate the Socio-Influences before investing more on in- formation systems. Keywords: Information System Success; Firm Performance; Service Science 1. Introduction Information systems have become the backbone of en- terprise operations for years. Many information systems highly dependent enterprises address more on reliability and sustainability. Enterprise competitiveness relies on the success of information systems; consequently these systems help enterprises generate more revenue. DeLone and McLean (D & M) had argued that Information-Qual- ity, System-Quality, and Service-Quality could stimulate Intention-to-Use and User-Satisfaction. The stimulation would further positively influence Net-Benefits [1]. Fig- ure 1 illustrated the updated version of D & M Informa- tion Systems Success model as follows: Information systems success cannot be achieves with- out adequate qualified resources. Resource-based view is one of the fundamental theories to analyze the impact of information technology on business performance. The enterprise competitive advantages are determined by the unique valuable resources [2] having the following char- acteristics: 1) Valuable: the resource is used to conceive or implement strategies that improve efficiency and ef- fectiveness; 2) Rare: the resoursces is not easy to acquire through a short period of time by competitors; 3) Imper- fectly Imitable: the resource is not easy to replicate or to imitate owing to its unique historical social inevitable conditions; and 4) Non-Substitutable: The resource is not easily replaceable. Figure 2 illustrated that Enterprise Performance would be influenced by its valuable re sources Figure 1. D & M Information systems success updated mod el. Figure 2. Resource-based view information system perfor- mance model. Copyright © 2012 SciRes. IB 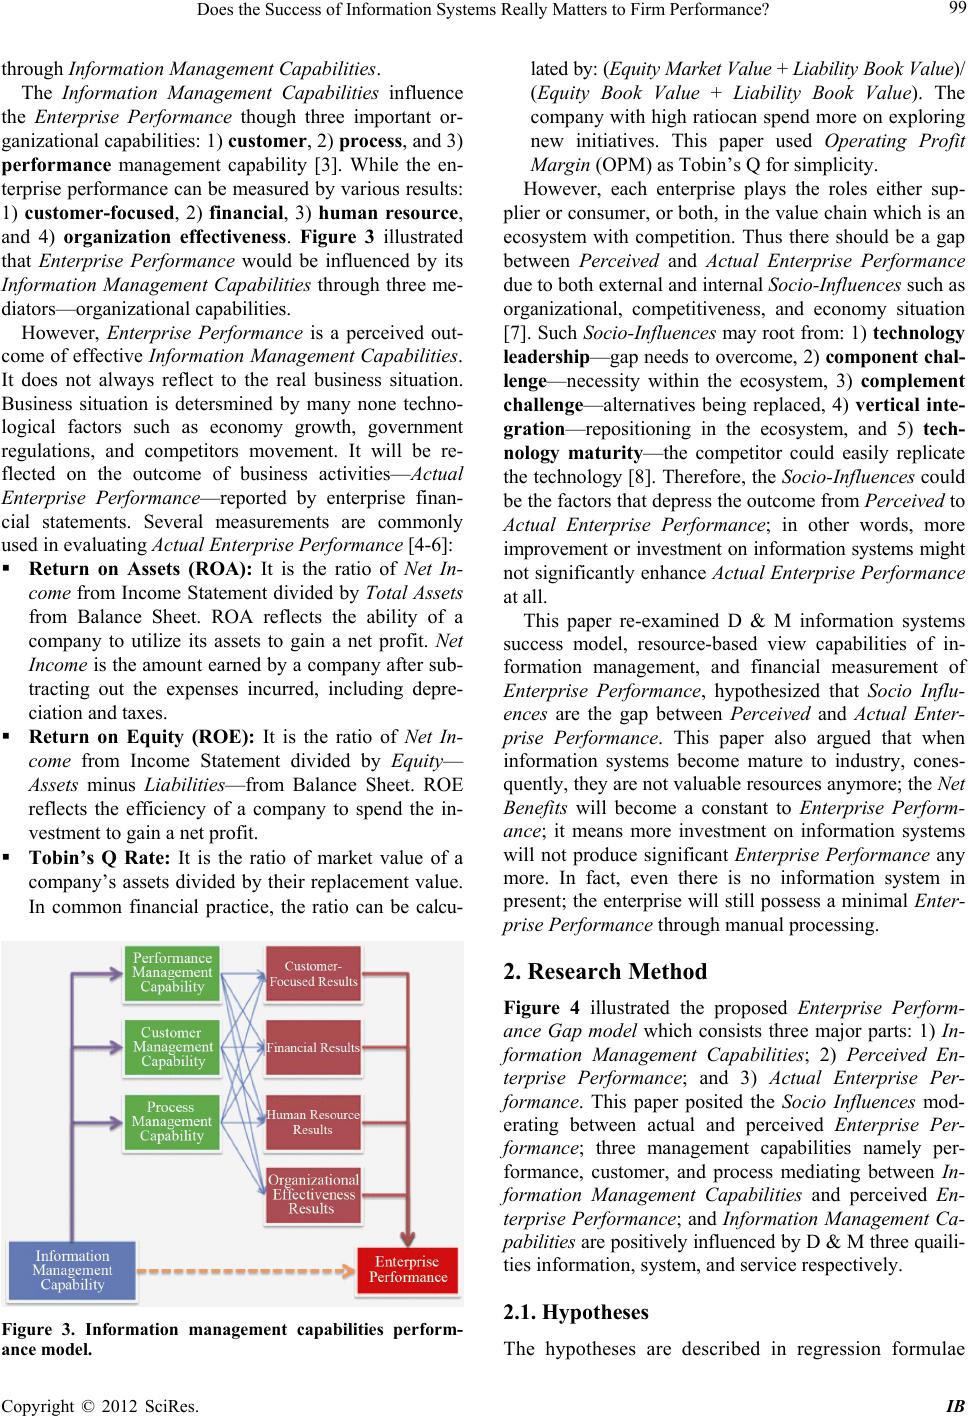 Does the Success of Information Systems Really Matters to Firm Performance? 99 through Information Management Capabilities. The Information Management Capabilities influence the Enterprise Performance though three important or- ganizational capab ilities: 1) customer, 2) process, and 3) performance management capability [3]. While the en- terprise performance can be measured by various results: 1) customer-focused, 2) financial, 3) human resource, and 4) organization effectiveness. Figure 3 illustrated that Enterprise Performance would be influenced by its Information Management Capabilities through three me- diators—organizatio nal capabilities. However, Enterprise Performance is a perceived out- come of effective Information Management Capabilities. It does not always reflect to the real business situation. Business situation is detersmined by many none techno- logical factors such as economy growth, government regulations, and competitors movement. It will be re- flected on the outcome of business activities—Actual Enterprise Performance—reported by enterprise finan- cial statements. Several measurements are commonly used in evaluating Actual Enterprise Performance [4-6]: Return on Assets (ROA): It is the ratio of Net In- come from Income Statement divided by Total Assets from Balance Sheet. ROA reflects the ability of a company to utilize its assets to gain a net profit. Net Income is the amount earned by a company after sub- tracting out the expenses incurred, including depre- ciation and taxes. Return on Equity (ROE): It is the ratio of Net In- come from Income Statement divided by Equity— Assets minus Liabilities—from Balance Sheet. ROE reflects the efficiency of a company to spend the in- vestment to gain a net profit. Tobin’s Q Rate: It is the ratio of market value of a company’s assets divided by their replacement value. In common financial practice, the ratio can be calcu- Figure 3. Information management capabilities perform- ance model. lated by: (Equity Market Value + Liability Book Value)/ (Equity Book Value + Liability Book Value). The company with high ratiocan spend more on exploring new initiatives. This paper used Operating Profit Margin (OPM) as Tobin’s Q fo r simplicity. However, each enterprise plays the roles either sup- plier or consumer, or both, in the value chain which is an ecosystem with competition. Thus there should be a gap between Perceived and Actual Enterprise Performance due to both external and intern al Socio-Influences such a s organizational, competitiveness, and economy situation [7]. Such Socio-Influences may root from: 1) technology leadership—gap needs to overcome, 2) component chal- lenge—necessity within the ecosystem, 3) complement challenge—alternatives being replaced, 4) vertical inte- gration—repositioning in the ecosystem, and 5) tech- nology maturity—the competitor could easily replicate the technology [8]. Therefore, the Socio-Influences could be the factors that depress the outcome from Perceived to Actual Enterprise Performance; in other words, more improvement or investment on information systems might not significantly enhance Actual Enterprise Performance at all. This paper re-examined D & M information systems success model, resource-based view capabilities of in- formation management, and financial measurement of Enterprise Performance, hypothesized that Socio Influ- ences are the gap between Perceived and Actual Enter- prise Performance. This paper also argued that when information systems become mature to industry, cones- quently, they are not valuable resou rces anymore; the Net Benefits will become a constant to Enterprise Perform- ance; it means more investment on information systems will not produce significant Enterprise Performance any more. In fact, even there is no information system in present; the enterprise will still p ossess a minimal Enter- prise Performance through manual processing. 2. Research Method Figure 4 illustrated the proposed Enterprise Perform- ance Gap model which consists three major parts: 1) In- formation Management Capabilities; 2) Perceived En- terprise Performance; and 3) Actual Enterprise Per- formance. This paper posited the Socio Influences mod- erating between actual and perceived Enterprise Per- formance; three management capabilities namely per- formance, customer, and process mediating between In- formation Management Capabilities and perceived En- terprise Performance; and Information Management Ca- pabilitie s are p ositively influenced by D & M three quaili- ties information, system, and service respectively. 2.1. Hypotheses The hypotheses are described in regression formulae Copyright © 2012 SciRes. IB  Does the Success of Information Systems Really Matters to Firm Performance? Copyright © 2012 SciRes. IB 100 Figure 4. Enterprise Performance Gap model. which are expected to be significant as follows: 01 Process ManagementCapacity Information ManagementCapabilities (2-3) Information Management Capabilities (HA1, HA2, and HA3 shown in Figure 4): The resources and capabilities of information systems interlink with their utilization, organizational perform- ance and business value [9]. While the capabilities of information systems are measured by their qualities con- tributed, therefore, Information Management Capabili- ties are positively influenced by three qualities namely Information, System, and Service [3]. Formula 1 depicts the linear regression as follows, and β1, β2, and β3 are expected to be significant : Mediation of Perceived Enterprise Performance (HB4, HB5, and HB6 shown in Figure 4): Well-developed IT infrastructures give rise to superior information management capability that plays a role in facilitating development of important customer manage- ment, process management, and performance manage- ment capabilities, and furthe r more, reaches superior firm performance [3]. Perceived Enterprise Performance is positively influenced by Performance, Customer , and Process Management Capacity respectively. Formula 3 depicts the linear regression as follows; β1, β2, and β3 are expected to be significant respectively: 01 2 3 Information ManagementCapabilities nformation QualitySystem Quality Service Quality (1) 01 2 3 PerceivedEnterprise Performance Performance ManagementCapacity Customer Management Capacity Process ManagementCapacity (3) Mediation of Management Capabilities (HB1, HB2, and HB3 shown in Figure 4): Information management capability enables valuable organizational capabilities through these three important organizational capabilities which mediating the links between information management capability and several measures of firm performance [3]. Performance, Cus- tomer, and Process Management Capacities are posi- tively influenced by Information Management Capabili- ties respectively. Formulas (2-1), (2-2), and (2-3) depict the linear regression as follow s, and β1 and β2 are expected to be significant: 01 Performance ManagementCapacity Information ManagementCapabilities (2-1) 01 Customer Management Capacity Information ManagementCapabilities (2-2) Moderation of Actual Enterprise Performance (HC1 and HC2 shown in Figure 4): Information systems have impacts on social, economy, organization, and the way of management, but also are mutated under the influences from them [9]. Socio Influ- ences are positively influenced by Perceived Enterprise Performance; and Actual Enterprise Performance is po- sitively influenced by Socio Influences as well. Formula 4 depicts the moderation regression as follows; β1, β2, and β3 are expected to be significant respectively: The hypotheses are described in regression formulae which are expected not to be significant as follows (HBC and HCD shown in Figure 4): 01 2 ActualEnterprisePerformancePerceivedEnterprise PerformanceSocio Influences PerceivedEnterprise PerformanceSocio Influences 3 (4)  Does the Success of Information Systems Really Matters to Firm Performance? 101 When above mentioned Mediation effects (Manage- ment Capabilities and Enterprise Performance) are posi- tive, the linear regression depicted by Formula s 5 and 6 should not be significant (i.e. both β1 are not expected to be significant respectively). 01 PerceivedEnterprise Performance Information ManagementCapabilities (5) 01 ActualEnterprise Performance PerceivedEnterprise Performance (6) S-Shape Correlation between Perceived and Actual Enterprise Performance: Formulas (7-1) and (7-2) demonstrates a theoretical model in S-shape illustrated in Figure 5 about the ideal correlation between actual and perceived Enterprise Per- formance. The coefficient ρ represents how significant Perceived Enterprise Performance shall influence on Ac- tual Enterprise Performance; γ represents the minimal Actual Enterprise Performance without information sys- tems; and ε represents the phase that information systems have not produced significant perceived Enterprise Per- formance yet. Let (7-1) perceived x Performance 1 xx actual Performancee e (7-2) 2.2. Variables Information Quality: The desirable characteristics of the system outputs including: relevance, understandability, accuracy, conciseness, completeness, understandability, currency, timeliness, and usability [10]. System Quality: The desirable characteristics of an in- formation system, such as: ease of use, system flexibility, system reliability, and ease of learning, as well as system features of intuitiveness, sophistication, flexibility, and Figure 5. S-shape between Perceived and Actual Enterprise Performances. response times [10]. Service Quality: The quality of the support that system users receive from the IS department and IT support personnel, such as: responsiveness, accuracy, reliability, technical competence, and empathy of the personnel staff [10]. Information Manag ement Capabilities: The ability to 1) provide data and information to users with the appro- priate levels of accuracy, timeliness, reliability, security, and confidentiality; 2) provide universal connectivity and access with adequate reach and range; and 3) tailor the infrastructure to emerging business needs and directions [3]. Performance Management Capacity: The ability to design and manage an effective performance measure- ment and analysis system, including selection of appro- priate metrics, gathering of data from appropriate sources of performance, analysis of data to support managerial decision making, communication of performance to ap- propriate stakeholders, and alignment of the performance management system with current and future business needs and directions [3]. Customer Management Capacity: The ability to deter- mine the requirements, expectations, and preferences of its customers and markets and is of significant importance in the contemporary business environment marked by hyper- com pe t i ti o n [3]. Process Management Capacity: The ability to attain flexibility, speed, and cost economy through the design and management of three major types of processes: 1) product design and delivery processes, including new product development and manufacturing; 2) non-product and non-service business growth processes, including innovation, research and development, supply chain ma- nagement, supplier partnering, outsourcing, mergers and acquisitions, global expansion, and project management; and 3) support processes, such as finance and accounting, facilities management, and human resources management. [3]. Perceived Enterprise Performance: An equivalent of D & M Net Benefits. The exten t to which IS a re con tr ibu - ting to the success of individuals, groups, organizations, industries, and nations, such as: improved decision-making, improved productivity, increased sales, cost reductions, improved profits, market efficiency, consumer welfare, creation of jobs, and economic development [10]. Socio-Influences: Both external and internal influences. The external influence is about social, political, econo- mic and technological factors; the internal influence is about organizational structure, strategies, and goals [7]. Actual Enterprise Performance: The financial indica- tors derived from enterprise financial reports including ROA, ROE, and Tobin’s Q Rate [4-6]. Copyright © 2012 SciRes. IB  Does the Success of Information Systems Really Matters to Firm Performance? 102 2.3. Sample According to Semiconductor Equipment and Materials International (SEMI), Taiwan has been poised to over- take Japan in 2011 as the world’s largest semiconductor materials market with growth rate of 36.2% from 2009. The semiconductor production depends on the success of manufacturing execution systems (MES) intensively. Fi- nancial institute operations rely on service and risk man- agement systems to comply with the regulations and to maximize the revenue as well. The information man- agement capabilities of these industries are considered mature than other general business. This paper collected two types of data, the empirical data from Taiwan public- listed companies of these two sectors, and the actual En- terprise Performance data from Taiwan Economy Jour- nal (TEJ). TEJ has been widely used in technology and finance related researches on Taiwan issues [11,12]. The survey questionnaires were collected from depart- ment managers related to IS, finance, manufacturing, customer-care, and auditing. It also asked the surveyed managers to focus on their core information systems in- cluding: 1) customer relationship management system; 2) supply-chain or vendor management system; 3) manu- facturing execution system for semiconductor, core-bank- ing system for banks, trading system for securities, and policy system for insurance respectively. 2.4. Encoding and Data Set The sample frame covered the numbers of surveyed enter- prises across sectors: 1) sixty-eight for semiconductor; 2) thirty-fivefor finance; and 3) seventy for optoelectronic in- dustries respectively. The response rate was 45% for the first round, 35% for the second round, and 11% for the third round, 91% in total. In order to facilitate the analysis efficiently, this paper used the same company security codes as Taiwan Stock Market designated for the surveyed enterprises, and used abbreviations for different sectors and departments as well (see Appendix 1). The schema of data set covered: 1) respondent profile; 2) qualities; 3) capabilities; 4) socio- influences; and 5) performances as hypotheses suggested (see Appendix 2). 2.5. Procedure Companies were contacted through a multi-staged proce- dure. First, a contact list derived from TEJ was used to control and monitor the progress of data collection (see Appendix 3). Secondly, a survey web site was prepared to facilitate the data collection process; the participants can find resources about the survey. Thirdly, a series of telephone calls were made to verify the contact informa- tion about managers of each company on the list, and briefly described the would be a survey kindly requiring their responses. Four thly, a cover letter of explaining the purpose the survey, how the expected research results would benefit to their companies, and the survey (see Appendix 4) was emailed to the listed managers. Fifthly, a second-round telephone calls were made to thank to those already-responded managers and to remind those who had not responded yet. A gift was sent to each res- ponded-manager through the first line sales or business partners of the author’s company. Finally, all responded data were imported to a database for further statistical analysis and tests. The factors of Actual Enterprise Performance were derived from financial reports instead of from perception. These factors were clustered into five groups as Likert- type scales applying k-means algorithm which has been widely used in financial profitability prediction [13,14]. Actual Enterprise Performance for each enterprise was calculated as Formula 8. The weights of α, β and γ are 1 as default value but also are sector dependent. For example, For those semiconductor enterprises, their operations rely on equipment intensively, thus the weight for ROE shall be assigned greater value than 1.For finance enterprises, the weight for OPM can be assigned greater value than 1 to emphasize the importance on operation cost. 3 ctualEnterprise Performance OPMROE ROA (8) 2.6. Statistical Analysis Multi-Trait/Multi-Method Analysis: To analyze the Convergent and Discriminant Validity, estimate the degree of method specificity, and scrutinize the ge- neralizability of results of empirical studies and assess- ment procedures across methods [15]. Multivariate Analysis of Variance (MANOVA): To check whether there are differences among semicon- ductor, optoelectronic and finance sectors on Qualities, Management Capabilities, Enterprise Performances, and Socio Influences respectively. Linear Regressions: To see if there were significant correlations against hypotheses under 95% confidence level. Also to validate the mediating and moderating effects of Management Capabilities and Socio Influ- ences respectively. Ordinary Least Squares (OLS) Regression Fitting: To check the correlation between Perceived and Actual Enterprise Performances fits S-shaped curve. The cost prediction in business behaves as an S-shaped curve requiring better regression than the usual linear regress- ion [16]. The behavior of Enterprise Performances is very similar to that concept and expected to be S-shap- ed as well. Copyright © 2012 SciRes. IB  Does the Success of Information Systems Really Matters to Firm Performance? 103 Clustering Analysis: Using k-means to check there were significant differences for: 1) Perceived and Actual Enterprise Performances; and 2) Socio-Influ- ences within the sector and across sectors as well [17]. 3. Discussion This paper revalidated the robustness of models of D&M Information Systems Success, Resource-based View In- formation System Performance, and Information Mana- gement Capabilities Performance as well. It also presents a composite model—Enterprise Performance Gap Model —to articulate the depression effect of Perceived Enter- prise Performance by Socio Influences reflected through financial measurements. The process of information technology adoption and its use over time—before and after adoption—is critical to measure the benefits of the adoption [18]. Enterprises with similar business model entered the market at dif- ferent timing. This influences the maturity of information technology adoption. Latter entrants will certainly adopt newer technologies than their predecessors. Evidence showed that in hig h-tech industries the newer technolog y adoption is faster than ever due to globalization [19]. The predecessors will also enhance or update their informa- tion systems to maintain the co mpetitivene ss. The assu mp- tion behind this is that the continuous investment on information systems will be expected to gain positive competitiveness in the market. As a matter of fact, the reason why information systems improve productivity is through internal process optimization—management ca- pabilities; otherwise it will be just another example of productivity-paradox [20]. The investment decision-mak- ing process of information systems keenly varies by different IT governance patterns [21]. This makes more obscure that the investment should be based on the outcome of Actual Enterprise Performance. When business model becomes mature, the difference of Management Capabilities between competitors is not significant any- more, thus Socio Influences will dominate the behavior of business performance. For emerging technologies such as optoelectronic in- dustry, the behavior of Enterprise Performance attributed to technology investment agrees to S-shaped curve: slow initial, accelerated, then diminishing improvement [22]. Another similar technology diffusion growth which fol- lowed S-curve is mobile telephony [23]. For those less information systems dependent companies than high-tech industries, the S-shape will be flatter (coefficient ρ in Formula 7-2 is smaller relatively) because the investment on information systems is not so sensitive as those tech- nology-dependent companies. This coincides to what the paper has posited. 4. Conclusion This paper re-examined D & M information systems suc- cess model, resource-based view capabilities of infor- mation management, and financial measurement of enter- prise performance, posited that Socio Influences are the gap between Perceived and Actual Enterprise Perfor- mance. It also validated that the information technology diffusion does have a limit unless newer valuable services are brought out to their customers. These newer valuable services will alleviate the impact from Socio Influences. Otherwise the Perceived Enterprise Perfor- mance contributed by information systems will be de- pressed; the Actual Enterprise Performance will behave as a near-constant just as the right-upper part of an S-shaped curve. The S-shaped curve can be used to gain insight about the relative payoff of investment in com- peting technologies, as well as to provide more insights about when and why some technologies overtake others in the race for dominance as explained earlier. The implication of this finding is to encourage enterprises to revisit their valuable services, to gain better market position, and to reevaluate the Socio Influences before investing more on information systems. REFERENCES [1] W. H. Delone and E. R. McLean, “The DeLone and McLean Model of Information Systems Success: A Ten- Year Update,” Journal of Management Information Sys- tems, Vol. 19, No. 4, 2003, pp. 9-30. [2] T. P. Liang and J. You, “Resource-Based View in Infor- mation Systems Research: A Meta-Analysis,” Proceed- ings of Pacific Asia Conference on Information Systems, Hyderabad, 10-12 July 2009, p. 72. [3] S. Mithas, N. Ramasubbu and V. Sambamurthy, “How Information Management Capability Influences Firm Per- formance,” Management Information Systems Quarterly, Vol. 35, No. 1, 2011, pp. 237-256. [4] N. A. Morgan, D. W. Vorhies and C. H. Mason, “Market Orientation, Marketing Capabilities, and Firm Perform- ance,” Strategic Management Journal, Vol. 30, No. 8, 2009, pp. 909-920. [5] E. Brynjolfsson, L. Hitt and H. Kim, “Strength in Numbers: How Does Data-Driven Decisionmaking Affect Firm Per- formance?” 2011. http://ssrn.com/abstract=1819486 [6] L. Bebchuk, A. Cohen and A. Ferrell, “What Matters in Corporate Governance?” Review of Financial Studies, Vol. 22, No. 2, 2009, pp. 783-827. doi:10.1093/rfs/hhn099 [7] R. Stockdale and C. Standing, “An Interpretive Approach to Evaluating Information Systems: A Content, Context, Process Framework,” European Journal of Operational Research, Vol. 173, No. 3, 2006, pp. 1090-1102. doi:10.1016/j.ejor.2005.07.006 [8] R. Adner and R. Kapoor, “Value Creation in Innovation Ecosystems: How the Structure of Technological Inter- dependence Affects Firm Performance in New Technol- Copyright © 2012 SciRes. IB  Does the Success of Information Systems Really Matters to Firm Performance? Copyright © 2012 SciRes. IB 104 ogy Generations,” Strategic Management Journal, Vol. 31, No. 3, 2010, pp. 306-333. doi:10.1002/smj.821 [9] A. Borek, M. Helfert, M. Ge and A. K. Parlikad, “An Information Oriented Framework for Relating IS/IT Re- sources and Business Value,” Proceedings of the Interna- tional Conference on Enterprise Information Systems, Beijing, 8-11 June 2011, pp. 358-367. [10] S. Petter, W. DeLone and E. McLean, “Measuring Infor- mation Systems Success: Models, Dimensions, Measures, and Interrelationships,” European Journal of Information Systems, Vol. 17, No. 3, 2008, pp. 236-263. doi:10.1057/ejis.2008.15 [11] W. Y. Wang and C. Chang, “Intellectual Capital and Per- formance in Causal Models: Evidence from the Informa- tion Technology Industry in Taiwan,” Journal of Intellec- tual Capital, Vol. 6, No. 2, 2005, pp. 222-236. doi:10.1108/14691930510592816 [12] S. M. L. Wong, S. Opper and R. Hu, “Shareholding Str- ucture, Depoliticization and Firm Performance,” Econo- mics of Transition, Vol. 12, No. 1, 2004, pp. 29-66. doi:10.1111/j.0967-0750.2004.00171.x [13] S. A. Ionescu, C. S. Murgoci, C. M. Gheorghe and E. Ionescu, “Making Predictions of the Profitability on the Fi- nancial Markets Using Discriminant Analysis,” Recent Ad- vances in Artificial Inteligence, Knowledge Engineering and Data Bases, 2009, p. 495. [14] S. A. Ionescu, C. S. Murgoci, C. M. Gheorghe and E. Ionescu, “Towards Profitability on the Financial Mar kets: A Discriminant Analysis Approach,” WSEAS Transac- tions on Business and Economics, Vol. 6, No. 3, 2009, pp. 99-111. [15] M. Eid, C. Geiser and F. W. Nussbeck, “Multitrait-Multi- method Analysis in Psychotherapy Research: New Meth- odological Approaches,” Psychotherapy Research, Vol. 19, No. 4-5, 2009, pp. 390-396. doi:10.1080/10503300802621198 [16] O. A. Isaac, A. A. Adedeji and I. R. Ismail, “Polynomial Regression Model of Making Cost Prediction in Mixed Cost Analysis,” Mathematical Theory and Modeling, Vol. 2, No. 2, 2012, pp. 14-23. [17] T. Kanungo, D. M. Mount, N. S. Netanyahu, C. D. Piatko, R. Silverman and A. Y. Wu, “An Efficient K-Means Clustering Algorithm: Analysis and Implementation,” IEEE Transactions on Pattern Analysis and Machine In- telligence, Vol. 24, No. 7, 2002, pp. 881-892. [18] E. Karahanna, D. W. Straub and N. L. Chervany, “Infor- mation Technology Adoption across Time: A Cross-Sec- tional Comparison of Pre -Adoption and Post-Adop tion Be- liefs,” Management Information Systems Quarterly, Vol. 23, No. 2, 1999, pp. 183-213. doi:10.2307/249751 [19] D. Comin and B. Hobija, “An Exploration of Technology Diffusion,” The American Economic Review, Vol. 100, No. 5, 2010, pp. 2031-2059. [20] V. Grover, J. Teng, A. H. Segars and K. Fiedler, “The Influence of Information Technology Diffusion and Busi- ness Process Change on Perceived Productivity: The IS Executive’s Perspective,” Information & Management, Vol. 34, No. 3, 1998, pp. 141-159. doi:10.1016/S0378-7206(98)00054-8 [21] Y. Xue, H. Liang and W. R. Boulton, “Information Tech- nology Governance in Information Technology Invest- ment Decision Processes: The Impact of Investment Cha- racteristics, External Environment, and Internal Context,” Management Information Systems Quarterly, Vol. 32, No. 1, 2008, p. 67. [22] M. A. Schilling and M. Esmundo, “Technology S-Curves in Renewable Energy Alternatives: Analysis and Implica- tions for Industry and Government,” Energy Policy, Vol. 37, No. 5, 2009, pp. 1767-1781. doi:10.1016/j.enpol.2009.01.004 [23] F. S. Wu and W. L. Chu, “Diffusion Models of Mobile Telephony,” Journal of Business Research, Vol. 63, No. 5, 2010, pp. 497-501.  Does the Success of Information Systems Really Matters to Firm Performance? 105 Appendices Appendix 1. Abbreviations for Data. Field Name Representation Semiconductor Code Optoelectronic Code Finance Code Design SD Bank FB Foundry SF Insurance FI Package Test SP Securities FS Sector Others SO OE Others FO Company TWSE Company Code Function Code Function Code Function Code Customer P A C Department Finance Process Audit F Information I Others O Appendix 2. Data Set Schema. Quality Management Capabilities Sector Company Department Information SystemServicePerformance Customer Process Survey Survey Socio-Influences Actual Enterprise Performance Perceived Enterprise Performance External InternalROE ROA Tobin’s Q Encoded Survey Derived from TEJ & Clustered by k-means Appendix 3. Survey Progress Control Table (Sample). Manager Time of Calls Response of Calls Company Position NameTELEmail1st2nd3rd1st 2nd Gift Operator Customer C Y/N Finance F Process P Information I Audit A TWSE Company Code Others O Appendix 4. Questionnaire. Background emiconductorS Finance Sector Design Foundry Package-Test Other Bank Securities Insurance Other Company Managerial Position Customer Finance Audit IS Process Others Evaluated System Customer Relationship Vendor Process Others Qualities Worse-Good 1 2 3 4 5 )1 On what degree that information system could provide adequate information to manage customers and vendors? Information )2 On what degree that information system could provide adequate information to manage revenue-generating processes? Copyright © 2012 SciRes. IB  Does the Success of Information Systems Really Matters to Firm Performance? 106 Continued )3 On what degree that information system could provide adequate information to facilitate internal processes? Worse-Good 1 2 3 4 5 )1 On what degree that information system could provide rich functionalities to manage customers and vendors? )2 On what degree that information system could provide rich functionalities to facilitate internal processes? System )3 On what degree that information system could provide rich fun ctionalities to ma nag e reve nue -ge ner ati ng processes? Worse-Good 1 2 3 4 5 )1 How stable information system could support servicing to customers and vendors? )2 How stable information system could support servicing to core internal processes? Service )3 How stable informatio n system could sup port servicing to revenue-generating processes? Management Capabilities Worse-Good1 2 3 4 5 )1 On what degree that information system could improve product/service process eff iciency? )2 On what degree that information system could improve personnel productivity? Performance )3 On what degree that information system could improve decision-making quality? Worse-Good1 2 3 4 5 )1 On what degree that information system coul d improve customer intim acy? )2 On what degree that information system could improve vendor intimacy? Customer )3 On what degree that information system could improve product/service sales? Worse-Good1 2 3 4 5 )1 On what degree that information system could provide effective communication among departments? )2 On what degree that information system could provide useful data for internal processes? Process )3 On what degree that information system could support core revenue-generating processes? Worse-Good1 2 3 4 5 )1 On what degree that information system could improve company’s performance? )2 On what degree that information system could improve company’s customers/vendors intimacy? Perceived Performance )3 On what degree that information system could improve company’s process efficiency? Worse-Good1 2 3 4 5 )1 On what degree that information system could improve company’s performance due to inter-organizationalconflict? )2 On what degree information system could improve themarket position to beat competition? Socio-Influences )3 On what degree information system could improve revenue-generating to defy the recession? )4 On whatdegree information system could improve the competitive strength? )5 On what degree information system could improve the relationship among suppliers? Copyright © 2012 SciRes. IB 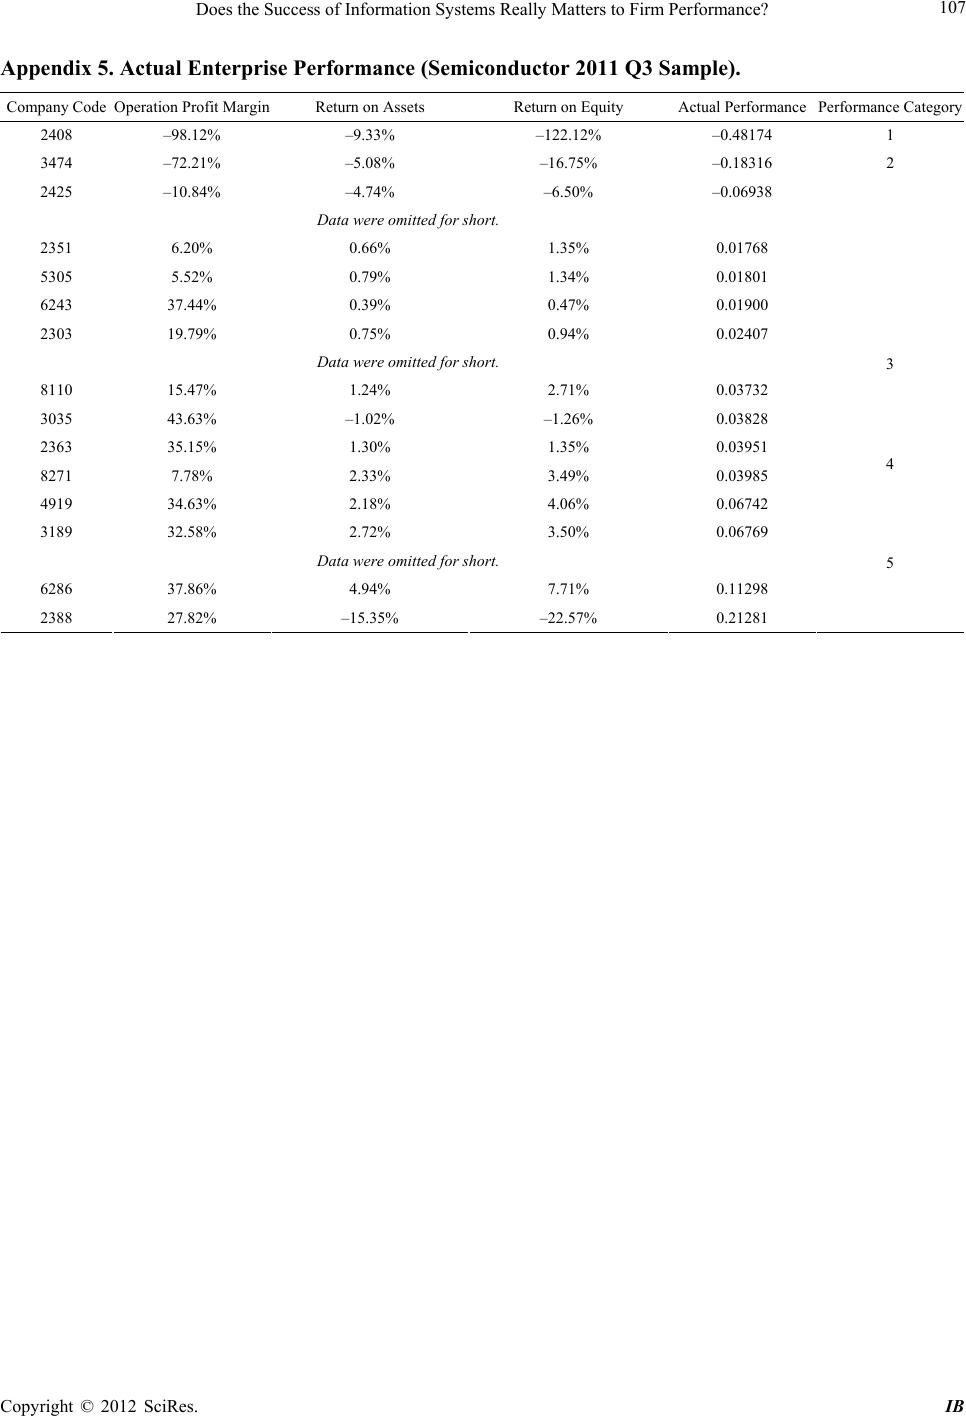 Does the Success of Information Systems Really Matters to Firm Performance? Copyright © 2012 SciRes. IB 107 Appendix 5. Actual Enterprise Performance (Semiconductor 2011 Q3 Sample). Company Code Operation Profit Margin Return on Assets Return on Equity Actual Performance Performance Category 2408 –98.12% –9.33% –122.12% –0.48174 1 3474 –72.21% –5.08% –16.75% –0.18316 2 2425 –10.84% –4.74% –6.50% –0.06938 Data were omitted for short. 2351 6.20% 0.66% 1.35% 0.01768 5305 5.52% 0.79% 1.34% 0.01801 6243 37.44% 0.39% 0.47% 0.01900 2303 19.79% 0.75% 0.94% 0.02407 Data were omitted for short. 8110 15.47% 1.24% 2.71% 0.03732 3035 43.63% –1.02% –1.26% 0.03828 3 2363 35.15% 1.30% 1.35% 0.03951 8271 7.78% 2.33% 3.49% 0.03985 4 4919 34.63% 2.18% 4.06% 0.06742 3189 32.58% 2.72% 3.50% 0.06769 Data were omitted for short. 6286 37.86% 4.94% 7.71% 0.11298 2388 27.82% –15.35% –22.57% 0.21281 5
|